Abstract
Approximately half of all cardiovascular deaths associated with acute coronary syndrome occur when the thin fibrous cap tissue overlying the necrotic core in a coronary vessel is torn, ripped or fissured under the action of high blood pressure. From a biomechanics point of view, the rupture of an atheroma is due to increased mechanical stresses in the lesion, in which the ultimate stress (i.e. peak circumferential stress (PCS) at failure) of the tissue is exceeded. Several factors including the cap thickness, morphology, residual stresses and tissue composition of the atheroma have been shown to affect the PCS. Also important, we recently demonstrated that microcalcifications (µCalcs) > 5 µm are a common feature in human atheroma caps, which behave as local stress concentrators, increasing the local tissue stress by at least a factor of two surpassing the ultimate stress threshold for cap tissue rupture. In the present study, we used both idealized µCalcs with spherical shape and actual µCalcs from human coronary atherosclerotic caps, to determine their effect on increasing the circumferential stress in the fibroatheroma cap using different hyperelastic constitutive models. We have found that the stress concentration factor (SCF) produced by µCalcs in the fibroatheroma cap is affected by the material tissue properties, µCalcs spacing, aspect ratio and their alignment relative to the tensile axis of the cap.
Keywords: micro computed tomography, vulnerable plaque, microcalcifications, fibrous cap rupture
INTRODUCTION
Approximately half of all cardiovascular deaths associated with acute coronary syndrome occur when the thin fibrous cap tissue overlying the necrotic core in a coronary vessel is torn, ripped or fissured under the action of high blood pressure (Davies and Thomas, 1981; Davies and Thomas, 1985; Burke et al., 1999). Based on its morphology and tissue composition, a vulnerable plaque has been described as a positively remodeled lesion rich in vasa-vasorum containing a lipid rich pool with a fibrous cap infiltrated by macrophages (Burke et al., 1997; Burke et al., 1999; Virmani et al., 2003; Virmani et al., 2007). From a biomechanics point of view, the rupture of an atheroma is due to increased mechanical stresses in the lesion, in which the ultimate stress (i.e. peak circumferential stress (PCS) at failure) of the tissue is exceeded as initially proposed in (Born and Richardson, 1989; Richardson et al., 1989). This basic hypothesis was subsequently explored by numerous investigators using 2D and 3D finite element analysis (FEA) and fluid structure interaction numerical models in which various aspects of plaque morphology, tissue properties, residual and fluid shear stress are examined (Cheng et al., 1993; Finet et al., 2004; Tang et al., 2005; Vengrenyuk et al., 2008; Akyildiz et al., 2011; Speelman et al., 2011; Rambhia et al., 2012). These and related studies are described in more detail in a recent review by Cardoso and Weinbaum (2013).
An important advance in the PCS hypothesis was the realization that cellular level microcalcifications (µCalcs) in fibrous caps could behave as local stress concentrators, increasing the local tissue stress by at least a factor of two surpassing the ultimate stress threshold for cap tissue rupture (Vengrenyuk et al., 2006). The presence of µCalcs in caps is a plausible explanation as to why approximately 40% of cap tears occur in the center of the cap (Richardson et al 1989; Maehara et al. 2002), why ruptures frequently did not coincide with the predicted location of PCS and why caps > 65 µm thickness could rupture at tissue stresses far below the 300 kPa critical threshold proposed in Cheng et al. (1993). In a series of studies (Vengrenyuk et al., 2006; Vengrenyuk et al., 2008; Vengrenyuk et al., 2010; Maldonado et al., 2012; Maldonado et al., 2013) the µCalc hypothesis has been further explored leading to the most recent paper, Kelly-Arnold et al. (2013), in which nearly 35,000 µCalcs > 5 µm were observed and analyzed in the fibrous caps of 22 non-ruptured lesions using 2.1-µm resolution µCT. In view of the numerous µCalcs that can now be seen in the fibrous caps it was no longer feasible to do 3D FEA or FSI calculations of the local tissue stress and simplifying numerical procedures were devised to quickly hone in on and quantitatively analyze which particle shapes and particle clusters are potentially dangerous. In the present study, we used both idealized µCalcs with spherical shape and actual µCalcs from human coronary atherosclerotic caps, to determine their effect on the circumferential stress in the cap of the fibroatheroma (FA). We have also investigated whether the stress concentration factor (SCF) produced by the µCalcs in the FA cap is affected by the material tissue properties, µCalc spacing, aspect ratio and their alignment relative to the tensile axis of the cap. This behavior is explored using several of the most widely used constitutive models.
MATERIALS AND METHODS
Idealized multi-layer model of fibroatheroma
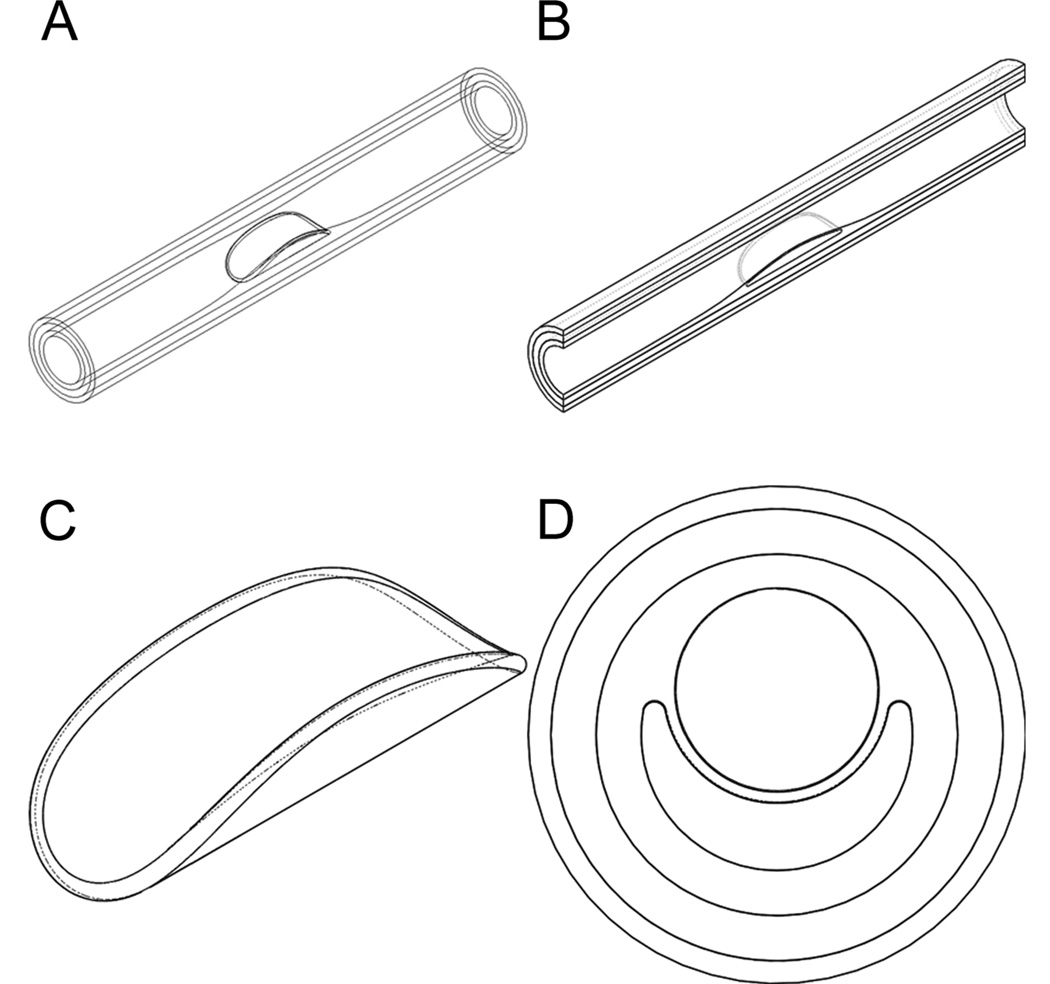
The human coronary fibroatheroma was modeled as a thick walled non-linear elastic cylindrical tube consisting of three distinct layers, namely the tunica intima (I), tunica media (M) and adventitia (A) layer. The idealized model represents a 30mm long segment of the artery, and includes a 10mm long fibroatheroma at the mid portion of the vessel. The FA is characterized by an eccentric pathological thickening of the intima layer, containing a semi-annular lipid core (LC). The radius of the lumen in the healthy portion of the vessel is 1.6mm and gradually decreases to 1.0mm in the FA region. The thicknesses of the I, M, and A tissue layers are 0.2mm, 0.4mm and 0.3mm, respectively. Isometric views of the whole blood vessel, longitudinal cut, and lipid core are shown in Figs. 1A–C, respectively. The cross section of the vessel at the mid length of the artery is shown in Fig. 1D. The fibrous cap (FC), in this model is a 0.1mm thick tissue layer located between the lumen and the LC of the FA (Fig. 1D). The FC also contains either 1 or 2 spherical µCalc(s) at the center of the cap aligned in the circumferential direction, as shown in Figure 2. The diameter of the Calcs was 10 µm and the spacing between the µCalcs was 4 µm. The degree of stenosis in the FA model was defined as the ratio between the cross section area at the location of minimal radius in the FA and the cross section area in the healthy region of the vessel, in this model being 60.9%, which corresponds to a mildly severe stenotic FA.
Figure 1.
Idealized macroscopic model of a human coronary fibroatheroma. A) Isometric view of the whole blood vessel, B) longitudinal cut, C) lipid core, and D) cross section of the FA.
Figure 2.
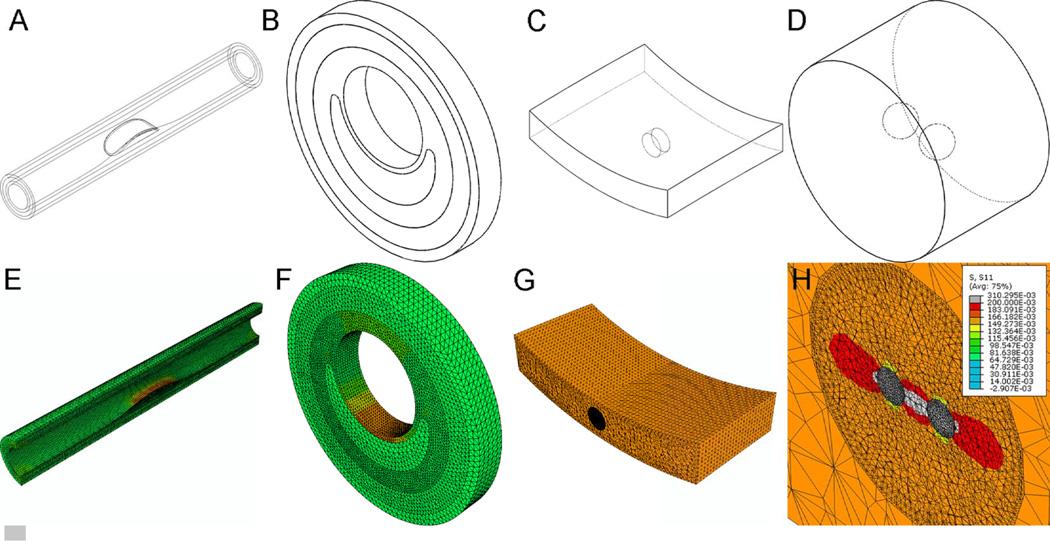
Multiscale FEA approach to analyze circumferential stresses around µCalcs embeded in the cap of a fibroatheroma. A) macroscopic (global) model, B) annular section of the atheroma, C) microscopic model of the atheroma cap with µCalcs in the center of the cap, and D) magnified view of the cylindrical ROI containing two µCalcs aligned to the tensile axis of the cap. E–H) Map of circumferential stresses under the loaded condition for all three scales of modeling. H) σθθ was greatly increased in the circumferential direction at the external poles of µCalcs and even more in the region between the µCalcs, whose spacing was 0.4 times their diameter.
Constitutive model
The soft tissue layers of the artery were treated as hyperelastic solid materials and its mechanical behavior under large strains was investigated using three different constitutive models, namely the Neo-Hookean, Mooney-Rivlin and Holzapfel models (Holzapfel et al., 2000; Holzapfel et al., 2005; Belzacq et al., 2012).
Neo-Hookean model (NH)
The strain energy density function in a compressible neo-Hookean material is given by
| (1) |
where C10 and D1 are material constants related to the shear modulus, μ, and bulk modulus, K, of the tissue by
| (2) |
and Ī1, the first invariant of the deviatoric part of the right Cauchy-Green deformation tensor, is expressed as
| (3) |
in which I1 is the first invariant of the right Cauchy-Green deformation tensor, given by
| (4) |
where λi are the principal stretches, and J is the third invariant of the deformation gradient, F,
| (5) |
When the material is incompressible, J = 1 and the stress energy density function for an incompressible Neo-Hookean material becomes
| (6) |
Mooney-Rivlin model (MR)
The strain energy density function in the Mooney-Rivlin model is a linear combination of the two first invariants of the left Cauchy-Green deformation tensor. The strain energy density function for a compressible Mooney-Rivlin solid material is given by:
| (7) |
where C10 and C01 are material constants, given by
| (8) |
and Ī1 and Ī2 are defined as:
| (9) |
In an incompressible Mooney-Rivlin solid material, J = 1, and the strain energy density function reduces to
| (10) |
Holzapfel model (H)
The strain energy density function in the Holzapfel solid material is given by (Holzapfel et al., 2000; Belzacq et al., 2012):
| (11) |
where C10, is associated to the non-collagenous matrix of the artery, and it describes the isotropic behavior of the material. The anisotropic behavior is thus taken into consideration by the constants k1, and k2. The collagenous fibers in each of the artery layers are arranged at a particular angle, which is described in a cylindrical polar coordinate system by
| (12) |
where βi are the angles between the collagen fibers, arranged in symmetrical spirals, in each of the artery layers, i = I, M, A. The parameter κ indicates the level of dispersion in the fiber direction.
Material properties
Parameters for the hyperelastic constitutive models, C10, C01, D1, k1, k2, and β, were obtained from data (Mean ± SD) previously reported in the literature for each tissue layer (Holzapfel et al., 2005) and Eqs 2 & 7 (summarized in Table 1). In turn, the µCalcs are considered as homogeneous, isotropic, solid elastic material, with properties similar to calcified bone tissue, E= 18,000 kPa and ν=0.3. The lipid in the core is assumed as a homogeneous fluid with a 5kPa bulk modulus and ν=0.49.
Table 1.
Material properties of intima, media and adventitia from Holzapfel, G. A. et al., (2005)
| µ (kPa) | K (kPa) | k1 (kPa) | k2 (---) | β (degrees) | |
|---|---|---|---|---|---|
| Intima | 27.90±10.59 | 130±250 | 263.66±490.95 | 170.88±125.47 | 60.3±18.2 |
| Media | 1.27±0.63 | 10±3.5 | 21.60±7.12 | 8.21±3.27 | 20.6±5.5 |
| Adventitia | 7.56±4.66 | 20±16 | 38.57±32.53 | 85.03±58.94 | 67.0±8.5 |
3D Multiscale Finite Element Analysis
To obtain a detailed analysis of the stresses around the µCalcs in the cap of the fibroatheroma, a 3D sub-modeling approach was implemented (Maldonado et al., 2012; Maldonado et al., 2013) using ABAQUS (V. 6.10 Simulia, Providence, RI). The macroscopic scale or global model consists of the model geometry shown in Fig. 2A, which does not include the microcalcifications in the cap of the FA. A physiological level blood pressure of 110 mmHg (14.6 kPa) was applied at the lumenal side of the intima layer, and both displacement and rotation of nodes along the external surface of the adventitia were set to zero as boundary conditions of the global model.
Solution of this global model is then interpolated onto the boundary of the second level model, consisting of an annular section of the artery at the medial portion of the FA (Fig. 2B). The element size of the mesh in this second level model is ~10 times smaller than in the global model of the artery, producing a higher resolution of the stresses in the FA cap.
The solution on this annular section of the atheroma is then used to drive the third scale of the model, which consist of an arc segment of the cap at the center of the fibroatheroma (Fig. 2C). Inside this cap segment, a cylindrical region of interest (ROI) was meshed with finite elements about 10 times smaller than in the previous level. Two spherical µCalcs in close proximity to each other were introduced in the cylindrical ROI, aligned in the circumferential (tensile) axis of the cap (Fig. 2D), with a element size mesh 2 times smaller than the one used in the cylindrical ROI. The multiscale modeling thus made it possible to accurately resolve the stresses around the µCalcs.
The blood pressure applied to the lumen of the artery produces a significant increase in the stresses along the tensile axis of the fibrous cap (circumferential stresses, σθθ), as shown for the pressurized condition of the first and second level models in Figs. 2E and 2F. At the third level model, it was also confirmed that the circumferential stress is the largest in the cap center, as shown in (Fig. 2G). A magnified view of the stresses around the µCalcs in the cap demonstrates that σθθ was greatly increased in the circumferential direction at the external poles of µCalcs and even more in the space between the µCalcs.
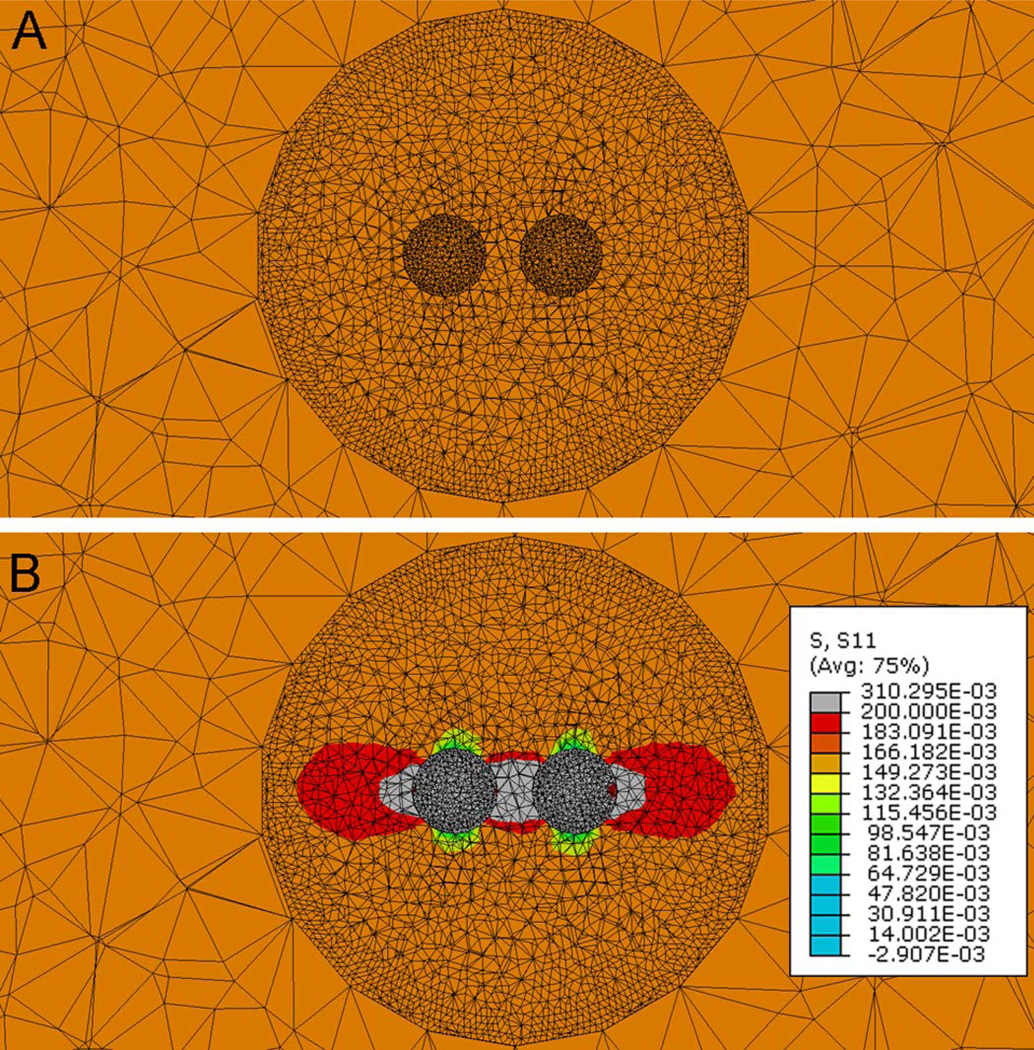
The circumferential stresses, σθθ, are then measured at the nodes around the spherical µCalcs (Fig. 3) under two cases, first when the material properties of the spherical region representing the µCalcs are substituted by those of the soft cap tissue (, Fig. 3A) and second when the material properties of the µCalcs are those of calcified tissue (, Fig. 3B). The ratio between the circumferential stresses, and , is defined as a stress concentration factor (SCF) produced by the presence of µCalc(s) in the cap. For both measurements, the FE meshes were exactly the same and these measurements were obtained using the 3D multiscale modeling approach in which the blood pressure was applied to the lumen of the artery.
Figure 3.
The stress concentration factor is computed using the third level model under the loaded condition, in which the material properties of the µCalcs are either those of the intima fibrotic tissue (Fig. 3A) or those of calcified tissue (Fig. 3B). The SCF due to the presence of µCalcs is computed as the ratio of the circumferential stresses, and at the tensile pole of the µCalc.
FE model convergence criteria
Convergence of the numerical solution of the model was investigated for all three scales in the model (whole FA, FA annular segment, and cap). Size of the finite elements used in each model was reduced until a change smaller than 0.5% in the circumferential stresses measured in the cap was reached. The mesh size for the several components of the model are reported in table 2. Each level of the multiscale models contained ~300,000–700,000 elements.
Table 2.
Mesh size for the several components of the model
| Global model | Annular model | Arc segment of the cap | |||
|---|---|---|---|---|---|
| Cap segment | Cylindrical ROI | µCalcs | |||
| Intima | 431,886 | 200,886 | 196,854 | 79,035 | 42,291 |
| Media | 111,524 | 116.845 | --- | --- | --- |
| Adventitia | 135,591 | 66,848 | --- | --- | --- |
| Lipid core | 44,355 | 42,401 | --- | --- | --- |
| TOTAL | 723,356 | 426,980 | 318,180 | ||
Patient-specific Fibroatheromas
Ninety six human coronary arteries were harvested from 32 atherosclerotic whole human hearts obtained from the National Disease Research Interchange. Both left and right coronary arteries were dissected preserving their ostium and segments from the right coronary artery (RCA), the left anterior descending artery (LAD) and the circumflex artery (LCX). Coronary specimens were scanned using a high resolution micro computed tomography (HR-µCT) system (1172, SkyScan, Belgium) at 6.7-µm resolution to identify the location of atheromas within the vessel, and thus re-scanned at 2.1-µm resolution for quantitative analysis of µCalcs in the atheroma. Water, air and hydroxyapatite standards (1mm diameter rods containing 250 and 750mg/cm3 hydroxyapatite) were used to calibrate grey color images to mineral density (CTAn, V.1.10.1, SkyScan, BE), allowing identification of lipid, calcified and soft tissues within the atheroma. Sixty-six human coronary fibroatheromas were identified based on the presence of an eccentric thick vessel wall with a visible atheroma core. Histology and transmission electron microscopy (TEM) images of µCalcs found in human atheroma caps (Kelly-Arnold et al., 2013) were manually segmented and the 2D contours of the µCalc were approximated with overlapping ellipses of different size and aspect ratio. The ellipses were then revolved along their major axis to construct a 3D shape. This realistic complex 3D µCalc geometry was then placed virtually in the center of the cap of a 3D idealized atheroma.
µCalc aspect ratio
HR-µCT images of the atheromas were binarized to segment the calcified particles from the soft tissues in the atheroma using a global thresholding method (Gu et al., 2012; Palacio-Mancheno PE et al., 2013). The volume, surface and centroid of each individual 3D object was calculated automatically using CTAn analysis software. An equivalent spherical diameter D = (6V/π)1/3 was calculated based on the volume V of each particle along with its sphericity Sph, which is defined by Sph = Seq/S where S is the measured surface area and Seq = πD2. If the particle is assumed to be an ellipsoid of revolution its sphericity can be approximated by Sph = (r/l)1/3 provided Sph > 0.5 or l < 8r. Using the volume of an ellipsoid, Vell = πr2l/6 one can now solve for r and l, the semi-minor and semi-major axes of the ellipsoid. The aspect ratio of each µCalc was determined as l/r.
Simplified model to approximate complex µCalc boundary shapes
Simplified FEA models were used to investigate the effect of complex boundary shapes of agglomerated µCalcs on SCF at the poles of the µCalcs. An agglomerated particle from histology was approximated using (1) a simplified geometry in which the particle is formed by the tips at both ends of the particle, maintaining the same radii of curvature at its poles, (2) an equivalent ellipsoid with same major and minor axes as the particle, without maintaining the µCalc radii of curvature at the poles, (3) a model geometry with same major-axis length and radii of curvature at the poles of the µCalc.
Orientation of µCalc(s) relative to tensile axis of cap
The effect of the orientation of µCalcs relative to the tensile axis of the cap on the SCF at the poles of the inclusion was determined using FEA in two cases: (1) an elongated calcified particle, and (2) a pair of spherical µCalcs, after rotating the µCalc(s) clockwise every 10 degrees from 0° to 90° with respect of the tensile axis of the cap.
RESULTS
I. Effect of tissue properties on SCF around µCalcs
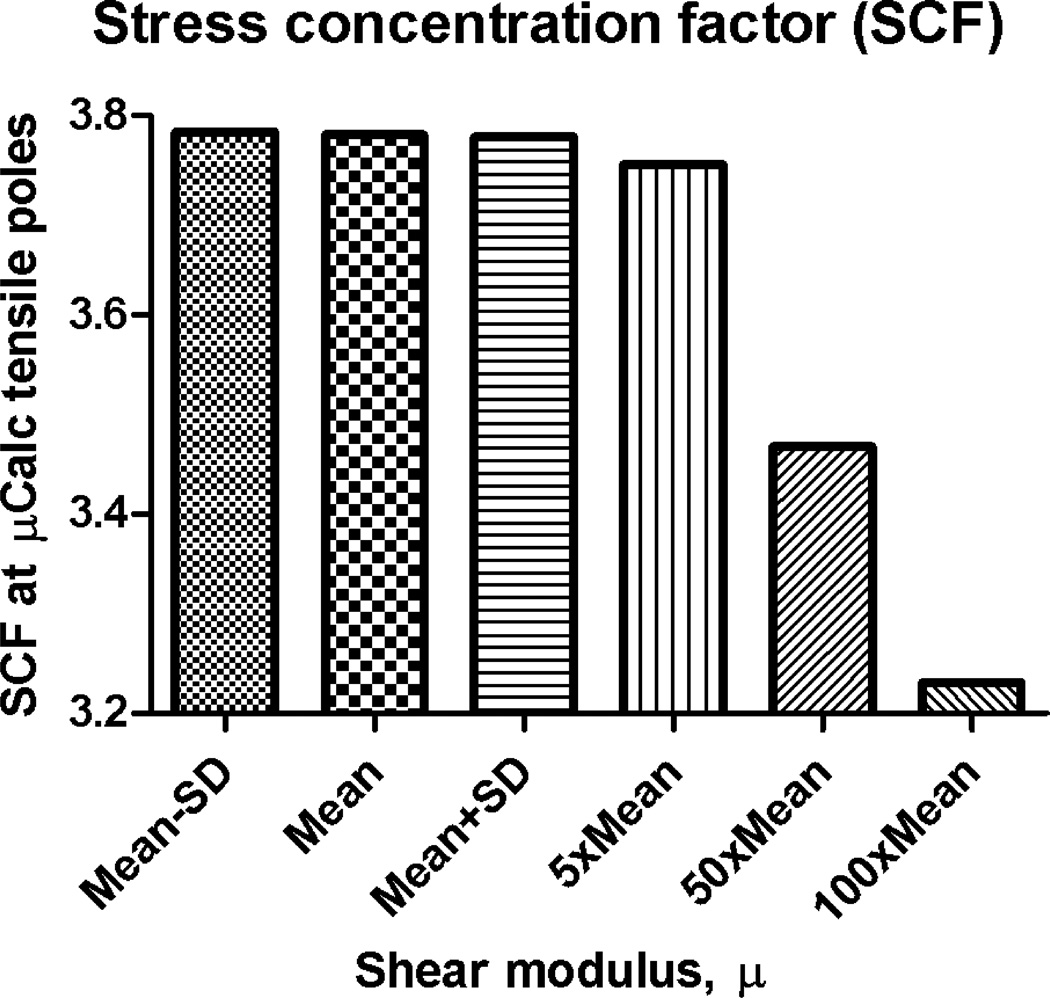
The effect of soft tissue shear modulus on the stress concentration factor created around µCalcs was determined using the 3D FEA multiscale approach in the compressible Neo-Hookean material model. The FEA was performed for 6 different values of µ (Mean−SD, Mean, Mean+SD, 5×Mean, 50×Mean and 100×Mean.) in each of the three main artery layers in Table 1, while keeping K and all other properties constant. The ratio between the peak circumferential stresses, and at the surface of the µCalc was used to determine the SCF for each case. Comparison of the stress concentration factor for these 6 cases shown in Fig. 4 indicates that there is practically no difference between the SCF produced within the limits of variance for healthy arteries (Mean±SD), but it starts to decrease when µ becomes 5×Mean, and even more for 50×Mean and 100×Mean of healthy tissue shear modulus values. Five times the shear modulus seems to correspond to fibrotic tissue in the cap, while 50 and 100 times the shear modulus is here computed to confirm the observed trend, in which the SCF decreases as µ increases (i.e. the tissue stiffens).
Figure 4.
Effect of tissue properties on stress concentration factor around µCalcs. Changes on SCF are shown as a function of changes on material properties of all three main artery layers (Mean−SD, Mean, Mean+SD, 5×Mean, 50×Mean and 100×Mean). Isotropic Neo-Hookean hyperelastic constitutive model.
II. Effect of tissue incompressibility on stress concentration factor around µCalcs
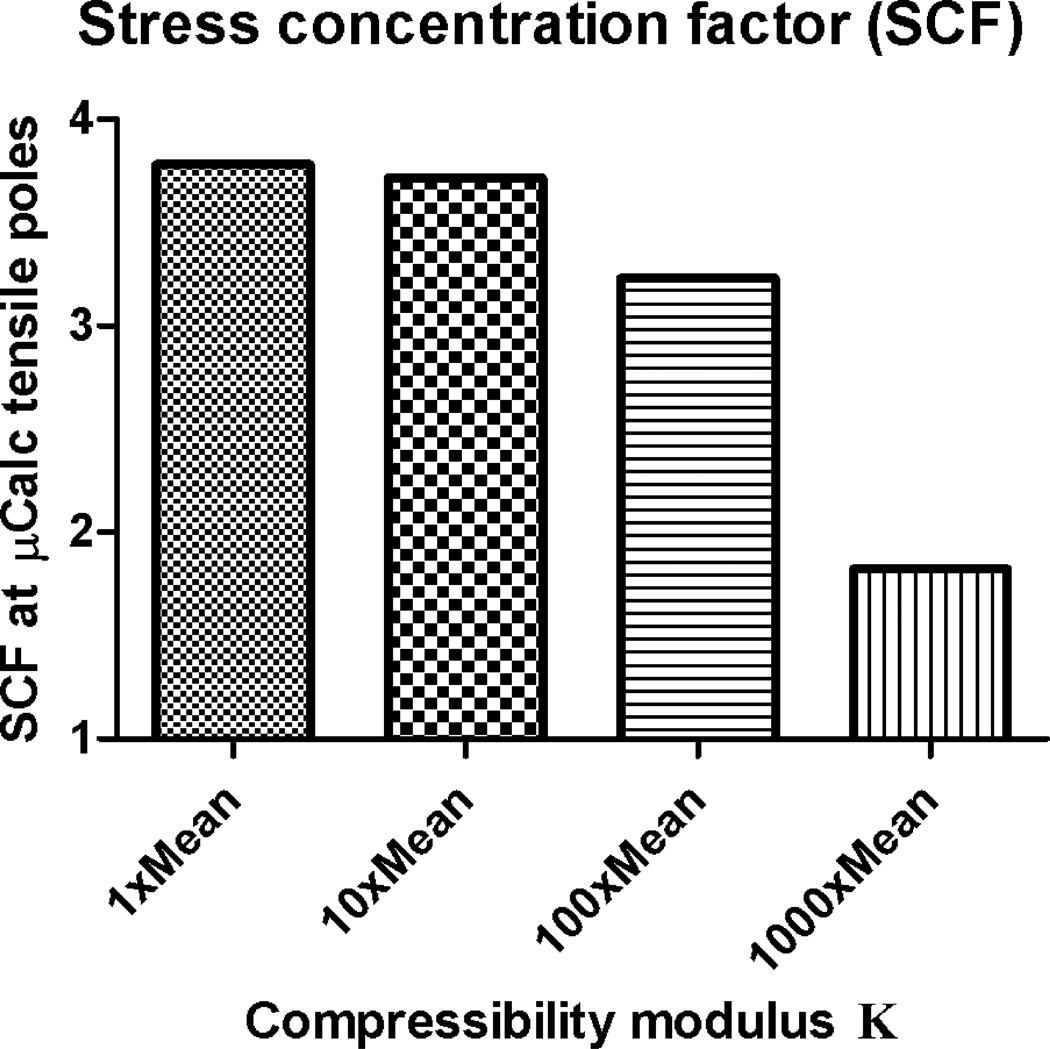
The effect of soft tissue compressibility, K, on the stress concentration factor created around µCalcs was determined using a similar approach to the one for the shear modulus above. In this case, all material parameters were kept constant, except for the value of K, which was varied as 1×Mean, 10×Mean, 100×Mean and 1000×Mean of the bulk compressibility modulus in all three artery layers from healthy tissue in Table 1. The corresponding Poisson's ratio, ν, for each of those values of K and µ was obtained using
| (13) |
leading to for the I, M and A layers under the 1×K condition; for the 10×K case, and for 100×K, and for 1000×K. Comparison of the SCF for these 4 cases of compressibility in Fig. 5 indicates that there is a very small difference between the SCF for 1×K and 10×K, but the decrease in SCF becomes significant at 100×K and 1000×K.
Figure 5.
Effect of tissue incompressibility on SCF around µCalcs. Changes on SCF are shown as a function of changes on bulk modulus (1×Mean, 10×Mean, 100×Mean and 1000×Mean) in all three main artery layers using values of µ and K in Table 1. Isotropic Neo-Hookean hyperelastic constitutive model.
III. Effect of constitutive model on SCF around µCalcs
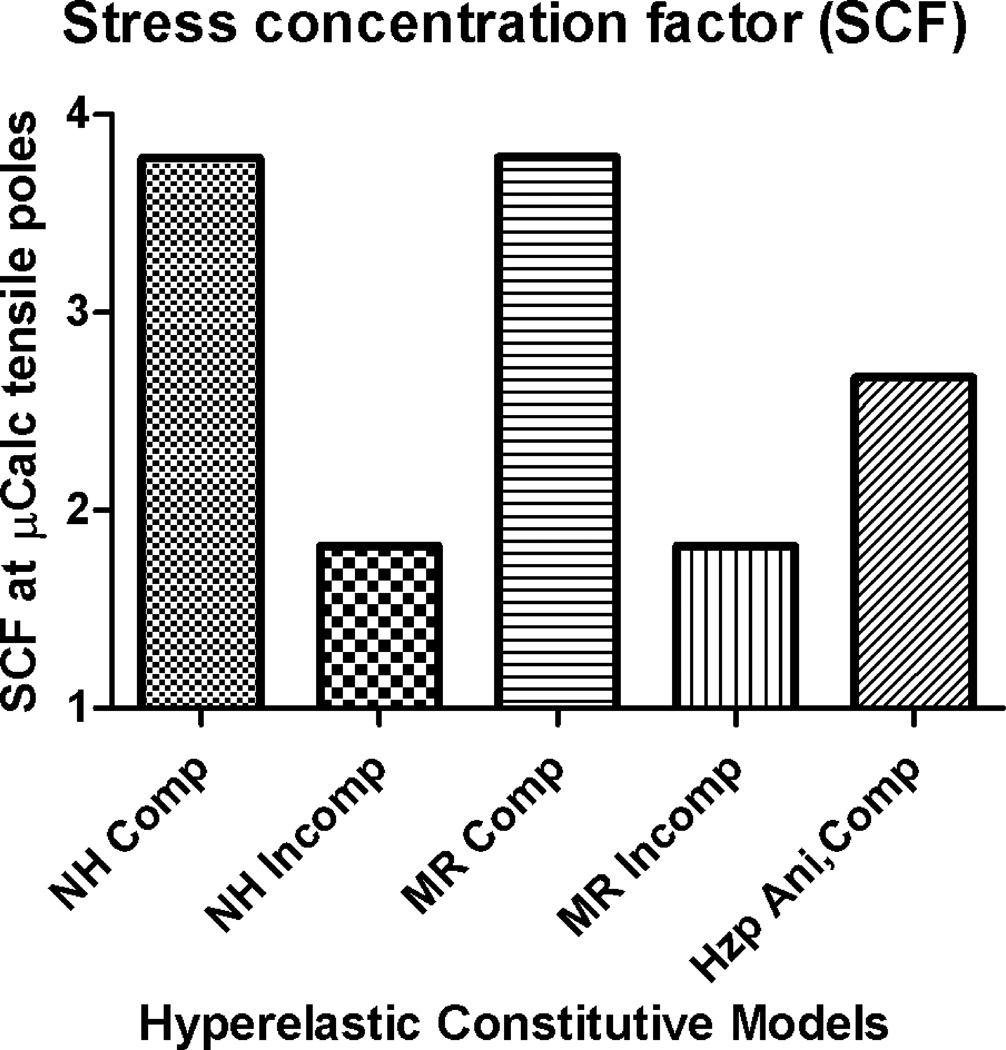
The effect of the constitutive model employed to calculate the peak circumferential stresses around µCalcs on the SCF was determined using the mean values of material properties reported in Table 1. The models that were compared include the isotropic compressible and incompressible Neo-Hookean, isotropic compressible and incompressible Mooney-Rivlin and the anisotropic compressible Holzapfel model. The SCF in the compressible case of the Neo-Hookean and Mooney-Rivlin models are practically the same. The incompressible case for both Neo-Hookean and Mooney-Rivlin also lead to SCF that are similar to each other, but significantly different to the compressible case. The anisotropic compressible Holzapfel model exhibited a SCF that is significantly smaller than the SCF obtained using isotropic compressible models, but larger than the SCF obatined for isotropic incompressible models (Figure 6).
Figure 6.
Effect of hyperelastic constitutive model on stress concentration factor around µCalcs. A) Neo-Hookean compressible, B) Neo-Hookean incompressible, C) Mooney-Rivlin compressible, D) Mooney-Rivlin incompressible, and E) Holzapfel anisotropic compressible.
IV. Effect of aspect ratio of µCalcs on SCF around µCalcs
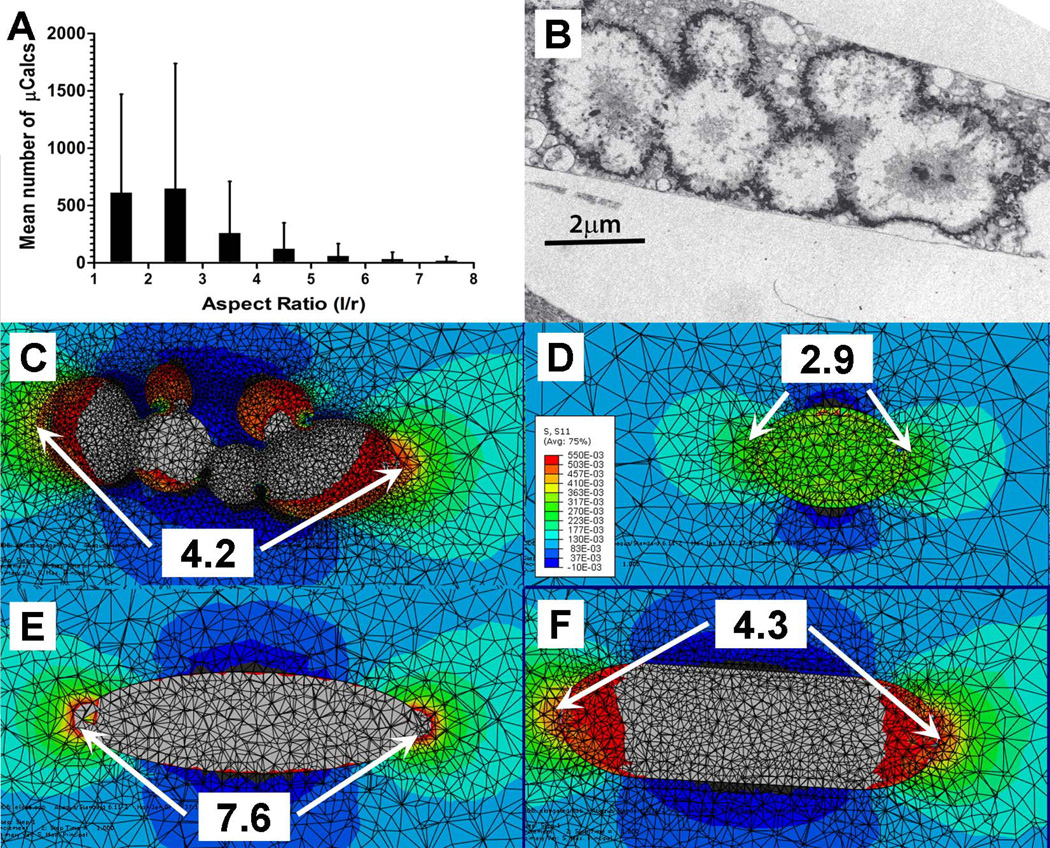
The aspect ratio of elongated µCalcs was calculated as an equivalent prolate spheroid with an equivalent volume and surface area. Figure 7.A shows the average number of µCalcs as a function of their aspect ratio l/r. An average of 612±860 µCalcs have an l/r<2, 648±1091 µCalcs have 2<l/r<3, 261±450 µCalcs have 3<l/r<4, and 95±168 µCalcs have 4<l/r<8. Vengrenyuk et al. (2008) have shown that whereas a near spherical µCalc would cause a 2-fold increase in PCS, a prolate spheroid with an aspect ratio l/r>2 could cause more than a 4-fold increased stress in a localized region near its ends.
Figure 7.
Simplified FEA model was used to investigate the effect of complex boundary shapes of agglomerated µCalcs on SCF. (A) distribution of µCalcs in the fibrous cap by aspect ratio, (B) TEM image of aggregated calcifying matrix vesicles forming µCalcs in a mouse atheroma, (C) original boundary shapes of agglomerated µCalcs in panel B, (D) a simplified model geometry in which the radii of curvature at the poles were maintained, (E) an equivalent ellipsoid with same major and minor axes as the µCalc, but without maintaining the particle curvature at the poles, (F) same major length of the particle and its curvature at the poles of the µCalc. Numbers show calculated stress concentration factor at the poles.
The aspect ratio and orientation of a single prolate µCalc along the tensile axis of the cap have an important effect on the SCF produced by such µCalc. A simplified FEA model was used to investigate the effect of complex boundary shapes of agglomerated µCalcs on SCF at the poles of the microinclusion. The histology-based FEA calculated stress concentration factor at the poles of the agglomerated particle in Kelly-Arnold et al., (2013) is shown in Figure 7.B and 7.C, indicating that the presence of this elongated particle would increase the local stress 4.2 times at its ends, instead of the 2-fold increase calculated for its volume equivalent sphere. In Figure 7.D, the agglomerated particle was approximated using a simplified geometry in which the particle is formed by the tips at both ends of the particle, maintaining the same radii of curvature at its poles, resulting in an underestimated SCF (=2.9). On the contrary, when the agglomerated particle was approximated by an equivalent ellipsoid with same major and minor axes as the µCalc, without maintaining the particle radii of curvature at the poles, the SCF was significantly overestimated (SCF=7.6), as shown in Figure 7.E. The best result was found when the agglomerated particle was approximated by a simplified model that retained the length of the major axis of the particle and its curvature at the poles of the µCalc (SCF=4.3), as depicted in Figure 7.F.
V. Effect of orientation of µCalcs on SCF
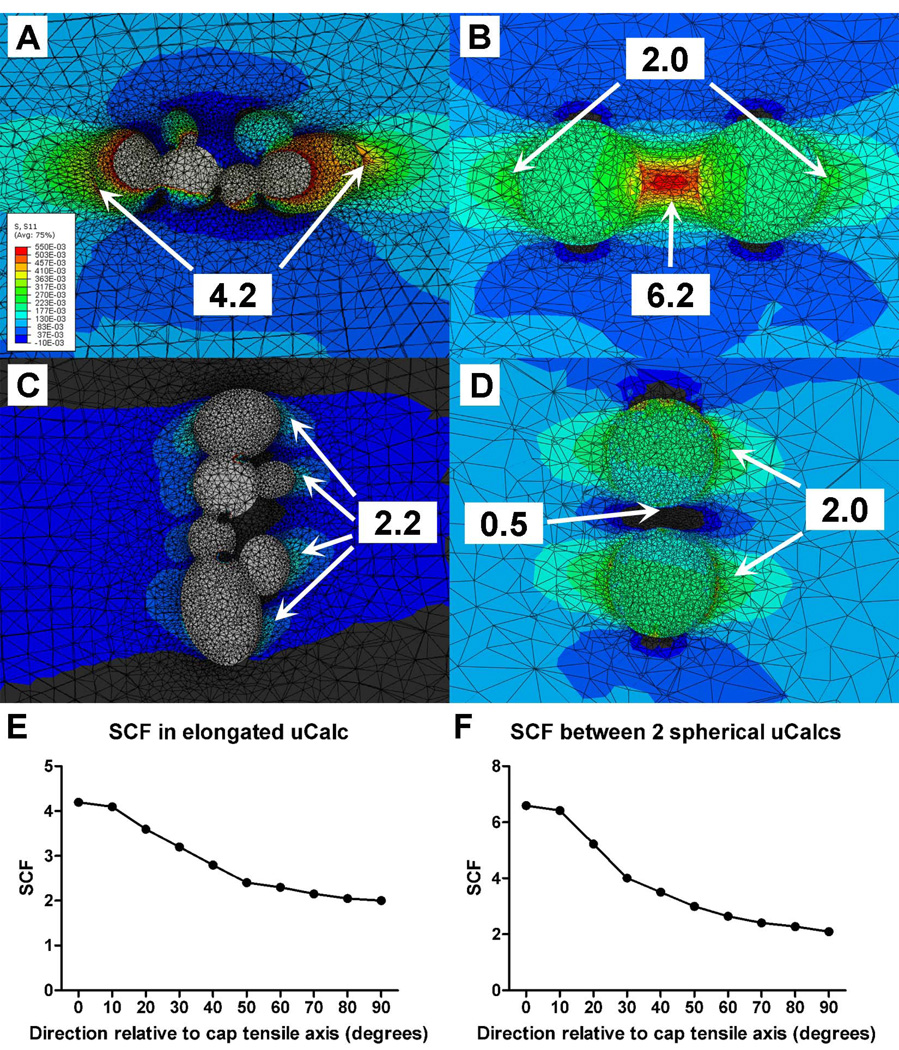
The SCF also depends on the orientation of the elongated particle relative to the tensile axis of the cap. The SCF produced by the agglomerated calcification in Figure 7.B was analyzed at different orientations within the cap. The SCF was maximal when the particle was aligned with the tensile axis of the cap, and decreased to a minimum value when oriented perpendicular to the tensile axis, as shown in Figure 8.A, 8.C and 8.E. The orientation of two or more close particles, h/D < 0.5, (where h is the distance between particles and D the diameter of the particles) relative to the tensile axis of the cap can also have a directional-dependent effect on SCF. In Figure 8.B, 8.D and 8.F, the SCF is reported for a pair of spherical microinclusions (h/D=0.4) that were analyzed after being rotated every 10 degrees until being perpendicular to the tensile axis of the cap. The maximal PCS occurs between the pair of particles when oriented along the tensile axis. The PCS decreases as the particles are oriented off the tensile axis and becomes minimal (PCS=2) at the tensile poles of each particle, as if they were isolated one from the other. Interestingly, the SCF in the region located between the µCalcs is < 1.0 (value 0.5) indicating compression when they are found perpendicular to the tensile axis. Overall, the FEA indicates that four key shape parameters determine PCS at the poles of a single µCalc or pair of µCalcs: (1) the aspect ratio of the particle, (2) the curvature of the µCalc complex at its poles, (3) the proximity between µCalc pairs, and (4) the orientation of the µCalc(s) relative to the tensile axis of the cap.
Figure 8.
Variations in stress concentration factor (SCF) due to the orientation of the Calc relative to the tensile axis of the cap. (A) SCF produced by the agglomerated calcification in Figure 7.B when oriented parallel to the tensile axis of the cap, and (C) oriented perpendicular to the tensile axis of the cap. (B) SCF due to a pair of two close particles, h/D = 0.4, (where h is the distance between particles and D the diameter of the particles) along the tensile axis of the cap, and (D) perpendicular to the tensile axis of the cap. SCF reported as a function of the particle orientation relative to the tensile axis of the cap for particle agglomeration in (A), Fig. 8E, and spherical particle pair in (B), Fig. 8F.
DISCUSSION
In the present study, we investigated the effect of µCalcs on the peak circumferential stress within the cap of the fibroatheroma (FA) under a number of different material properties and hyperelastic constitutive models. We have found that the stress concentration factor (SCF) produced by the µCalcs in the FA cap is both affected by the material tissue properties, and the constitutive model employed. When the shear modulus of the three main layers in the artery was varied within the physiological range of healthy tissues, the SCF produced by µCalcs was practically the same. However, when the shear modulus increase 5 times, case corresponding to a fibrous cap tissue, the SCF slightly decreased, but decreased more significantly when the shear modulus increased 50–100 times the original value. The effect of the soft tissue compressibility on SCF was also analyzed by changing the value of the bulk modulus K, resulting in more noticeable changes in SCF, when compared to changes due to µ. Interestingly, the SCF decreased from almost 4 to less than 2 when a very high modulus (1000×K) was employed, for which case the soft tissues could be considered incompressible. When the SCF was studied using different constitutive models, similar results were found for both compressible Neo-Hookean and Mooney-Rivlin models, and also when comparing the incompressible cases for both these models. However the SCF in the compressible and incompressible cases was significantly different. In turn, the anisotropic, compressible Holzapfel model produced SCF values smaller than the isotropic compressible Neo-Hookean and Mooney-Rivlin models, demonstrating an effect of anisotropy on SCF. Overall, these results indicate that both compressibility and anisotropy of the tissue play a role on the SCF produced by µCalcs. This is explained by the fact that the stress concentration factor depends on the contrast between the material properties inside and outside of the µCalcs, and it is in particular observed for the incompressible materials.
In addition to the contrast between soft and hard tissues in the cap, the µCalcs aspect ratio and their alignment relative to the tensile axis of the cap have an effect on the SCF produced by µCalcs. The SCF produced at the poles of a spherical particle in the cap has been shown to be 2, irrespective of its relative position in the cap (Vengrenyuk et al., 2006). However, an elongated particle in the cap would produce an SCF between 2–5 depending on its aspect ratio (Vengrenyuk et al., 2008). The studies by Maldonado et al., (2012; 2013) also provided the initial evidence that both the size of a µCalc and the proximity between pairs of µCalcs are important determinants of SCF in atheroma caps, and can potentially transform a stable plaque into a vulnerable one. The proximity, h/D ratio between two particles was confirmed to have an SCF between 2–7 in Kelly-Arnold, A. et al., (2013). In the present study, HR-µCT at 2.1-µm resolution allowed not only a more accurate quantification of the number of µCalcs, but assessment of their morphology (aspect ratio). It was shown that the µCalcs that produce a larger increase in SCF have an elongated shape and/or a small h/D ratio, when oriented along the tensile axis of the cap. While these findings are here reported for human coronary arteries containing microcalcifications, the calcification process is not exclusive to coronary arteries, and could happen in other arteries, such as carotid and iliac plaques. However, the background stresses generated in caps may be different since tissue composition, material properties and morphology of plaques in other blood vessels could be different.
The overall effect of microcalcifications in plaque vulnerability can be summarized as an intensifier of the background circumferential stress in the cap. The stress concentration factor (SCF) produced by µCalcs does not depend on the specific µCalc location within the cap (center or shoulders); it is now known that it depends on the properties of the soft tissue material in the artery layers, the compressibility of the tissue, its anisotropy, size and shape of the µCalc as well as the proximity between two or more µCalcs. The SCF, which is typically in the range of 2–5, can exceed five or more if the µCalcs are very closely spaced and aligned along the tensile axis of the cap. In turn, the magnitude of the background stress in the cap depends on the atheroma morphology (i.e. cap thickness, necrotic core size, location and shape of lipid core) and tissue composition (i.e. lipid core composition, residual stresses). Therefore, if the cap has no µCalcs, the cap needs to thin to ~30µm to reach the rupture threshold and become prone to rupture (Maldonado et al., 2012). Also, if µCalc(s) are located in caps with very low background stress, the increase in stress concentration produced by µCalcs may not be sufficient to reach the rupture threshold. However, the presence of µCalc(s) in the cap with a background stress of about one fifth - one half the rupture threshold (a stable plaque), will produce a significant increase on local stress, which may exceed the cap rupture threshold, and thus transform a non vulnerable plaque into a vulnerable one.
Acknowledgements
This research has been supported by NIH ARRA grant RCI HL101151 to SW, NIH AG034198 to LC, NSF-BMMB 1333560, NSF-MRI 0723027, MRI 1229449 and PSC CUNY award to LC.
Footnotes
Publisher's Disclaimer: This is a PDF file of an unedited manuscript that has been accepted for publication. As a service to our customers we are providing this early version of the manuscript. The manuscript will undergo copyediting, typesetting, and review of the resulting proof before it is published in its final citable form. Please note that during the production process errors may be discovered which could affect the content, and all legal disclaimers that apply to the journal pertain.
Conflict of interest
The authors have no conflict of interest.
References
- Akyildiz AC, Speelman L, van Brummelen H, Gutierrez MA, Virmani R, van der Lugt A, van der Steen AF, Wentzel JJ, Gijsen FJ. Effects of intima stiffness and plaque morphology on peak cap stress. Biomed Eng Online. 2011;10:25. doi: 10.1186/1475-925X-10-25. [DOI] [PMC free article] [PubMed] [Google Scholar]
- Belzacq T, Avril S, Leriche E, Delache A. A numerical parametric study of the mechanical action of pulsatile blood flow onto axisymmetric stenosed arteries. Med Eng Phys. 2012;34(10):1483–1495. doi: 10.1016/j.medengphy.2012.02.010. [DOI] [PubMed] [Google Scholar]
- Born GVR, Richardson PD. Mechanical properties of human atherosclerotic lesions. In: Glagov S, Newman WP, Shaffer S, editors. Pathology of the Human Atherosclerotic Plaque. Berlin: Springer; 1989. [Google Scholar]
- Burke AP, Farb A, Malcom GT, Liang Y, Smialek JE, Virmani R. Plaque rupture and sudden death related to exertion in men with coronary artery disease. JAMA. 1999;281(10):921–926. doi: 10.1001/jama.281.10.921. [DOI] [PubMed] [Google Scholar]
- Burke AP, Farb A, Malcom GT, Liang YH, Smialek J, Virmani R. Coronary risk factors and plaque morphology in men with coronary disease who died suddenly. N Engl J Med. 1997;336(18):1276–1282. doi: 10.1056/NEJM199705013361802. [DOI] [PubMed] [Google Scholar]
- Cardoso L, Weinbaum S. Changing views of the biomechanics of vulnerable plaque rupture: a review. Ann. Biomed. Eng. doi: 10.1007/s10439-013-0855-x. Published online: 11 July 2013. [DOI] [PMC free article] [PubMed] [Google Scholar]
- Cheng GC, Loree HM, Kamm RD, Fishbein MC, Lee RT. Distribution of circumferential stress in ruptured and stable atherosclerotic lesions. A structural analysis with histopathological correlation. Circulation. 1993;87(4):1179–1187. doi: 10.1161/01.cir.87.4.1179. [DOI] [PubMed] [Google Scholar]
- Davies MJ, Thomas AC. Plaque fissuring--the cause of acute myocardial infarction, sudden ischaemic death, and crescendo angina. Br Heart J. 1985;53(4):363–373. doi: 10.1136/hrt.53.4.363. [DOI] [PMC free article] [PubMed] [Google Scholar]
- Davies MJ, Thomas T. The pathological basis and microanatomy of occlusive thrombus formation in human coronary arteries. Philos Trans R Soc Lond B Biol Sci. 1981;294(1072):225–229. doi: 10.1098/rstb.1981.0101. [DOI] [PubMed] [Google Scholar]
- Finet G, Ohayon J, Rioufol G. Biomechanical interaction between cap thickness, lipid core composition and blood pressure in vulnerable coronary plaque: impact on stability or instability. Coron Artery Dis. 2004;15(1):13–20. doi: 10.1097/00019501-200402000-00003. [DOI] [PubMed] [Google Scholar]
- Gu XI, Palacio-Mancheno PE, Leong DJ, Borisov YA, Williams E, Maldonado N, Laudier D, Majeska RJ, Schaffler MB, Sun HB, Cardoso L. High resolution micro arthrography of hard and soft tissues in a murine model. Osteoarthritis and Cartilage. 2012;20(9):1011–1019. doi: 10.1016/j.joca.2012.05.004. [DOI] [PMC free article] [PubMed] [Google Scholar]
- Holzapfel GA, Gasser TC, Ogden RW. A new constitutive framework for arterial wall mechanics and a comparative study of material models. Journal of Elasticity. 2000;61(1–3):1–48. [Google Scholar]
- Holzapfel GA, Sommer G, Gasser CT, Regitnig P. Determination of layer-specific mechanical properties of human coronary arteries with nonatherosclerotic intimal thickening and related constitutive modeling. Am J Physiol Heart Circ Physiol. 2005;289(5):H2048–H2058. doi: 10.1152/ajpheart.00934.2004. [DOI] [PubMed] [Google Scholar]
- Kelly-Arnold A, Maldonado N, Laudier D, Aikawa E, Cardoso L, Weinbaum S. A revised microcalcification hypothesis for fibrous cap rupture in human coronary arteries. Proc Natl Acad Sci USA. 2013;110(26):10741–10746. doi: 10.1073/pnas.1308814110. [DOI] [PMC free article] [PubMed] [Google Scholar]
- Maehara A, et al. Morphologic and angiographic features of coronary plaque rupture detected by intravascular ultrasound. J. Am. Coll. Cardiol. 2002;40(5):904–910. doi: 10.1016/s0735-1097(02)02047-8. [DOI] [PubMed] [Google Scholar]
- Maldonado N, Kelly-Arnold A, Cardoso L, Weinbaum S. The explosive growth of small voids in vulnerable cap rupture; cavitation and interfacial debonding. J Biomech. 2013;46(2):396–401. doi: 10.1016/j.jbiomech.2012.10.040. [DOI] [PMC free article] [PubMed] [Google Scholar]
- Maldonado N, Kelly-Arnold A, Vengrenyuk Y, Laudier D, Fallon JT, Virmani R, Cardoso L, Weinbaum S. A mechanistic analysis of the role of microcalcifications in atherosclerotic plaque stability: potential implications for plaque rupture. Am J Physiol Heart Circ Physiol. 2012;303(5):H619–H628. doi: 10.1152/ajpheart.00036.2012. [DOI] [PMC free article] [PubMed] [Google Scholar]
- Palacio-Mancheno PE, Larriera AI, Doty SB, Cardoso L, SP F. 3D assessment of cortical bone porosity and tissue mineral density using high- resolution micro-CT: effects of resolution and threshold method. J. Bone Miner. Res. 2014 Jan;29(1):142–150. doi: 10.1002/jbmr.2012. [DOI] [PMC free article] [PubMed] [Google Scholar]
- Rambhia SH, Liang X, Xenos M, Alemu Y, Maldonado N, Kelly A, Chakraborti S, Weinbaum S, Cardoso L, Einav S, Bluestein D. Microcalcifications increase coronary vulnerable plaque rupture potential: a patient-based micro-CT fluid-structure interaction study. Ann Biomed Eng. 2012;40(7):1443–1454. doi: 10.1007/s10439-012-0511-x. [DOI] [PubMed] [Google Scholar]
- Richardson PD, Davies MJ, Born GV. Influence of plaque configuration and stress distribution on fissuring of coronary atherosclerotic plaques. Lancet. 1989;2(8669):941–944. doi: 10.1016/s0140-6736(89)90953-7. [DOI] [PubMed] [Google Scholar]
- Speelman L, Akyildiz AC, den Adel B, Wentzel JJ, van der Steen AF, Virmani R, van der Weerd L, Jukema JW, Poelmann RE, van Brummelen EH, Gijsen FJ. Initial stress in biomechanical models of atherosclerotic plaques. J Biomech. 2011;44(13):2376–2382. doi: 10.1016/j.jbiomech.2011.07.004. [DOI] [PubMed] [Google Scholar]
- Tang D, Yang C, Zheng J, Woodard PK, Saffitz JE, Petruccelli JD, Sicard GA, Yuan C. Local maximal stress hypothesis and computational plaque vulnerability index for atherosclerotic plaque assessment. Ann Biomed Eng. 2005;33(12):1789–1801. doi: 10.1007/s10439-005-8267-1. [DOI] [PMC free article] [PubMed] [Google Scholar]
- Vengrenyuk Y, Cardoso L, Weinbaum S. Micro-CT based analysis of a new paradigm for vulnerable plaque rupture: cellular microcalcifications in fibrous caps. Mol Cell Biomech. 2008;5(1):37–47. [PubMed] [Google Scholar]
- Vengrenyuk Y, Carlier S, Xanthos S, Cardoso L, Ganatos P, Virmani R, Einav S, Gilchrist L, Weinbaum S. A hypothesis for vulnerable plaque rupture due to stress-induced debonding around cellular microcalcifications in thin fibrous caps. Proc Natl Acad Sci U S A. 2006;103(40):14678–14683. doi: 10.1073/pnas.0606310103. [DOI] [PMC free article] [PubMed] [Google Scholar]
- Vengrenyuk Y, Kaplan TJ, Cardoso L, Randolph GJ, Weinbaum S. Computational Stress Analysis of Atherosclerotic Plaques in ApoE Knockout Mice. Annals of Biomedical Engineering. 2010;38(3):738–747. doi: 10.1007/s10439-009-9897-5. [DOI] [PubMed] [Google Scholar]
- Virmani R, Burke AP, Kolodgie FD, Farb A. Pathology of the thin-cap fibroatheroma: a type of vulnerable plaque. J Interv Cardiol. 2003;16(3):267–272. doi: 10.1034/j.1600-0854.2003.8042.x. [DOI] [PubMed] [Google Scholar]
- Virmani R, Narula J, Leon M, Willerson JTE. The Vulnerable Atherosclerotic Plaque: Strategies for Diagnosis and Management. Malden, MA: Blackwell; 2007. [Google Scholar]


