

Abstract
Cyclic adenosine monophosphate (cAMP) is a second messenger that may be associated with olfactory function. No known studies have compared existing collection methods for determining nasal cAMP levels. This is a prospective study comparing the comfort and reliability of the nasal curette and cytobrush. A secondary outcome collected for feasibility testing was characterizing the association between cAMP and olfactory function. We enrolled 19 normal olfaction and 10 olfactory dysfunction subjects. Olfaction was measured by the University of Pennsylvania Smell Identification Test. Two samples were obtained from each nasal cavity at the initial visit and at 1 week follow-up. Comfort was measured by a visual analog scale (VAS). cAMP levels were determined by an enzyme immunoassay. For the curette and cytobrush, mean VAS scores were 0.3 and 0.7 cm (p = 0.48). Intraclass correlation coefficients were 0.81 (curette) and 0.65 (cytobrush) for the initial visit and 0.64 and 0.54 between the initial and follow-up visit. Using the curette, mean cAMP was 537 and 480 fmol/(mg/mL) for the normal and dysfunction cohorts (p = 0.18). Using the cytobrush, cAMP was 505 and 477, respectively (p = 0.65). The curette and cytobrush are both comfortable and reliable collection methods for determining nasal cAMP levels.
Keywords: Anosmia, cAMP, curette, cytobrush, olfaction, olfactory epithelium, UPSIT
Normal odor detection enhances the taste of food and detects dangerous stimuli such as natural gas or spoiled food. The prevalence of smell dysfunction has been estimated to be nearly 20% in certain countries.1 Unfortunately, for most people there is no treatment for this disorder.
Cyclic adenosine monophosphate (cAMP) is an important second messenger in the mechanism of olfaction.2 Odor molecules bind to the odor–receptor complex, which activates type III adenylate cyclase via the trimeric guanine nucleotide binding protein, Golf. This results in increased intracellular cAMP, which, in turn, causes calcium influx and subsequent depolarization and activation of the olfactory sensory neuron. cAMP is then hydrolyzed and deactivated by phosphodiesterase (PDE), attenuating the signal.
Henkin et al. published a study on nasal cAMP levels in 206 patients with varying degrees of smell loss.3 cAMP levels were determined from spontaneous nasal discharge collected over 1–4 days. This study showed that lower cAMP levels may be associated with decreased smell function.
Collection of spontaneous nasal discharge has potential challenges. The volume and quality of samples may vary for each subject. If collected over several days, patient compliance may affect sample quality and with inherent variations that may be difficult to standardize. Our study will evaluate other existing options for collecting nasal samples.
In addition to nasal discharge, options for nasal cell collection include the cotton swab, nasal curette, and nasal cytobrush. Lin et al. performed a prospective comparison of the nasal curette and cotton swab to obtain nasal cells from allergic rhinitis patients.4 The curette provided a higher yield of eosinophils in these patients. In a second prospective study, Lin et al. compared the cytological yield of the nasal curette and cytobrush in allergic rhinitis patients.5 Compared with the cytobrush, the nasal curette showed superior leukocyte yield and better correlation with active disease.
There are no published studies comparing the reliability or comfort level of existing nasal cell collection methods for determining cAMP levels. The primary aim of this study was to assess the feasibility of using the nasal curette and cytobrush by (1) comparing the relative comfort of the nasal curette versus the cytobrush and (2) determining the reliability of each collection method. A secondary aim was to gather preliminary data to characterize cAMP levels in subjects with normal and abnormal smell function.
METHODS
This project was approved by the University of Washington Institutional Review Board Human Subjects Division. Written informed consent was obtained from all participating subjects. All procedures were performed at the University of Washington Nursing Clinical Research Center. The study spanned from March to October 2011.
The study population was composed of the general local population with self-reported, normal smell function and University of Washington Medical Center patients with diagnosed olfactory dysfunction.
The inclusion criteria for the normal olfaction cohort were as follows: (1) self-reported normal smell function followed by confirmation with a normal University of Pennsylvania Smell Identification Test (UPSIT), a validated 40-item scratch and sniff test6; (2) age of >18 years.
Inclusion criteria for the olfactory dysfunction cohort included (1) an ICD9 diagnostic code for olfactory dysfunction followed by confirmation with an abnormal UPSIT score and a score of ≤34 for women and ≤33 for men is defined as abnormal smell function, (2) patients with idiopathic olfactory dysfunction, and (3) age of >18 years.
Volunteers were excluded from enrollment for any of the following reasons: (1) unable to give informed consent or complete self-administered questionnaires written in English because of cognitive impairment, language barriers, or severe medical conditions; (2) allergy to lidocaine; (3) active sinonasal disease; (4) previous nasal or sinus surgery; (5) currently smoking or using other smoked or inhaled drugs; and/or (6) pregnant or planning to become pregnant.
We aimed to recruit a total of 30 volunteers, 20 with normal olfaction and 10 with olfactory dysfunction. This was based on a power calculation to detect a significant difference in comfort level between the nasal cytobrush and curette using a 10-cm visual analog scale (VAS) with the following parameters: an effect size of 13 mm, SD of 1.1 cm, power of 90%, and α = 0.05.7,8
Subjects in the normal cohort were scheduled for two appointments and those in the dysfunction cohort were scheduled for one appointment. An identical protocol was performed for both cohorts during the first appointment. Subjects completed an olfactory-related health questionnaire and the UPSIT to assess smell function.
The procedure began with anterior rhinoscopy to rule out any nasal pathology. A mixture of oxymetazoline and 4% topical lidocaine was sprayed into each nostril to decongest and anesthetize the nasal mucosa. A small cotton ball soaked with 4% lidocaine was then placed into the nasal cavity for 5 minutes to further anesthetize the mucosa. Two samples were collected using each method on the same side. This served as the initial test–retest reliability data. Samples were obtained from the middle or inferior turbinate depending on the extent of visualization on anterior rhinoscopy. Each sample was placed on dry ice immediately after collection. Participants were then asked to complete a VAS for pain for each collection method.
All subjects with normal olfaction were then randomized to enter either an intervention cohort (saline irrigations) or a nonintervention cohort. Data from subjects in the intervention cohort were excluded from the reliability analysis and are reported in a separate study. Volunteers in the nonintervention cohort returned for a 1-week follow-up appointment. At the follow-up visit, each subject repeated the UPSIT and nasal collections, which were performed using the same protocol by the same operator. All samples were placed immediately on dry ice. This group served as a test–retest measure that would account for potential day-to-day cAMP variability.
Sample Processing
Cytobrush and curette samples were resuspended in 500 μL of phosphate-buffered saline with 0.5 mM of isobutyl-methylxanthine, a general PDE inhibitor that inhibits most PDEs. The cells were disrupted using a sonicator over two 30-second cycles, interrupted by incubation over ice. After sonication, a 50-μL aliquot was removed and set aside for determination of protein concentration. Two volumes of cool 100% ethanol were added for protein precipitation. The samples were placed on ice for 10 minutes and then centrifuged at 2000 × g at 4°C for 10 minutes. The supernatant was transferred to a new Eppendorf tube and allowed to dry overnight at 55°C. The dried supernatant was resuspended in 320 μL of an assay buffer and cAMP concentrations were determined using an Amersham cAMP Biotrak enzyme immunoassay 96-well system (catalog number RPN2251; Amersham, Pittsburgh, PA).
Protein concentration was determined using the 50-μL aliquot after sonication. This was determined using a spectrophotometric assay in a BioTek Epoch microplate reader (BioTek, Winooski, VT).
Statistical Analysis
Data were maintained in an Excel spreadsheet (Microsoft Corp., Redmond, WA). All cAMP concentrations (fmol) were standardized with the total protein concentration (mg/mL) of each sample. An intraclass correlation coefficient (ICC) was calculated for each collection method using cAMP levels derived from the two samples collected during the first visit. An ICC was also calculated between the mean cAMP levels from the initial visit and cAMP levels in samples collected at the 1-week follow-up appointment. A one-way test of absolute agreement was used to calculate ICC using IBM SPSS software (SPSS, Inc., Chicago, IL).
VAS scores were recorded in centimeters. Using Stata software (StataCorp, College Station, TX), scores between the curette and cytobrush from the initial visit were compared using a paired Wilcoxon test. A Wilcoxon rank sum test was used to compare cAMP levels between the normal olfaction and dysfunction cohort. For those in the normal cohort, mean UPSIT scores were calculated from the initial and follow-up visits. A scatterplot was generated to assess correlation between UPSIT scores and cAMP levels.
RESULTS
Twenty-three subjects with self-reported normal smell function and 6 subjects with smell dysfunction were enrolled into the study. Four of the 23 subjects with self-reported normal smell function were found to have smell loss on the UPSIT and were crossed over to the dysfunction cohort, yielding 19 subjects with normal smell and 10 with olfactory dysfunction. Eleven of the 23 subjects with self-reported normal smell function were randomized to return in 1 week with no further intervention. All subjects had normal rhinologic exams. A total of 29 samples were processed using the described protocol. Same-day, duplicate samples were processed in 25 of 29 subjects; therefore, the test–retest analysis includes data from a total of 25 samples.
Table 1 shows demographic data and average UPSIT scores of enrolled subjects. The mean age of volunteers with normal smell function was 37 compared with 59 in the dysfunction cohort. There was a slight male predominance in the normal olfaction cohort. The average UPSIT scores were 37 and 28 in the normal and dysfunction cohorts, respectively.
Table 1.
Demographic information and mean UPSIT scores for each cohort with standard errors

UPSIT = University of Pennsylvania Smell Identification Test.
All subjects returned for their scheduled follow-up appointment. Two subjects in the normal cohort reported a history of environmental allergies. Three subjects took antihistamines for allergies. Two of the 10 subjects in the dysfunction cohort reported a history of environmental allergies. None of the volunteers had olfactory dysfunction–related health disorders. No volunteers reported active sinonasal disease during their visit.
All subjects were able to undergo the procedures. There were no instances of significant discomfort during the collection. Of all enrolled patients, only one volunteer in the normal cohort experienced self-limited epistaxis, which did not require intervention. We were able to perform all collections within a 30-minute appointment.
VAS pain scores were measured on a 0- to 10-cm scale. Scores from the initial visit were used in the analysis. The mean scores were 0.3 cm for the nasal curette compared with 0.7 cm for the cytobrush (p = 0.48).
The calculated ICC and 95% confidence interval for each method collected during the initial visit (n = 25) was 0.81 (0.62–0.91) for the curette and 0.65 (0.35–0.83) for the cytobrush, suggesting strong correlation (Table 2). ICCs were also calculated using mean cAMP levels from the initial visit and samples collected during the follow-up visit. A total of 11 follow-up samples were processed for each collection method. The calculated ICCs were 0.64 (0.14–0.89) and 0.54 (0–0.85) for the curette and cytobrush, respectively—showing good correlation.
Table 2.
ICC and 95% confidence interval for normal olfaction samples collected on the same day and those collected 1 wk apart
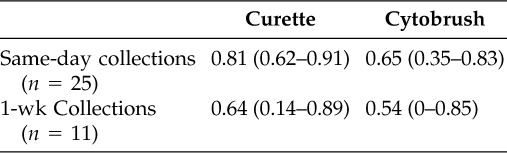
ICC = intraclass correlation coefficient.
Mean standardized cAMP levels from the curette collections were 537 fmol/(mg/mL) for the 19 normal cohort samples and 480 fmol/(mg/mL) for the 10 dysfunction cohort samples (p = 0.18; Table 3). For the cytobrush, mean cAMP levels were 505 fmol/(mg/mL) for the normal cohort and 477 fmol/(mg/mL) for the dysfunction cohort (p = 0.65).
Table 3.
Mean standardized cAMP levels with standard error for the curette and cytobrush stratified by olfactory function

cAMP = cyclic adenosine monophosphate.
A scatterplot of UPSIT scores versus cAMP levels for each method did not show a significant correlation between the two variables (Fig. 1).
Figure 1.

Scatterplot of mean standardized cAMP levels and UPSIT scores with a line of best fit. The vertical line denotes the division between normal and abnormal UPSIT scores. (A) Curette cAMP levels. (B) Cytobrush cAMP levels.
DISCUSSION
Our data show that both the nasal curette and the cytobrush are comfortable collection methods with mean VAS pain scores below 1 cm on a 10-cm scale. It has been shown that a clinically significant VAS score ranges from 1 to 1.3 cm, suggesting that, on average, subjects did not experience clinically significant discomfort.8 To our knowledge, this is the first clinical study to objectively measure the comfort of these collection methods.
Both methods yielded reliable cAMP levels although the curette appeared to be slightly more reliable than the cytobrush. The lower ICC values when comparing 1-week follow-up samples suggest there may be a day-to-day variability in nasal cAMP levels.
Although both the curette and the cytobrush were comfortable and reliable, the primary operator preferred the curette. It was smaller than the cytobrush and provided a wider view into the nasal cavity. Given its smaller surface area, it was easier to target a specific area of the nasal mucosa.
Although there was no statistically significant difference in cAMP levels between the two cohorts, mean cAMP levels were higher in the normal cohort for both collection methods. Additionally, although there was no significant correlation between UPSIT scores and cAMP levels, a majority of higher cAMP levels tended to aggregate in the range of UPSIT scores that correspond to normal olfaction. It is important to stress that this study was not powered to test the ability of this technique to compare intranasal cAMP between normal and abnormal olfactory function. Nevertheless, these trends are encouraging for future studies.
There are no known studies on the effects of oxymetazoline or lidocaine on intranasal cAMP levels. We performed a preliminary study in five volunteers where collections were performed with and without lidocaine. There was no significant difference in cAMP yield. Regardless, all subjects received the same volume and duration of oxymetazoline and lidocaine; therefore, any potential effects on cAMP should be equal across each cohort.
The primary objective of this study was to assess the feasibility of studying cAMP levels in humans using existing nasal cell collection methods. We have shown that this can be performed comfortably, reliably, and in a feasible amount of time. Although this study was not powered to detect a significant difference or correlation in cAMP levels, we did observe encouraging trends. We believe this study generates important point estimates to guide future studies on the relationship of cAMP levels and olfaction.
One major limitation in this study was the significant difference in age between cohorts. This is not surprising because olfactory function tends to decline with age.9 It will be important to use age-matched cohorts in future studies. Additionally, because of limited visualization, a majority of samples were obtained from the inferior turbinate. The distribution of olfactory epithelium in human nasal mucosa is variable. Studies have shown that olfactory epithelium can be located in the superior aspects of the nasal septum, superior turbinate, and on the middle turbinate.10–14 The distribution pattern of olfactory epithelium along the inferior turbinate remains unclear and warrants further investigation. Endoscopic-guided collections should be used in future studies to assure more consistent visualization of the known olfactory regions along the nasal mucosa.
CONCLUSION
This feasibility study showed that both the nasal curette and the cytobrush are comfortable and reliable methods for obtaining cellular specimens for scientific study. The pilot data from this study can serve as a guide for larger, prospective studies to better characterize the clinical implications of cAMP in human olfaction.
ACKNOWLEDGMENTS
The authors thank Carolyn Bea for technical assistance, administrative support, and coordination of this study and Vicky Li for technical assistance in the processing of nasal samples.
Footnotes
Funded by the National Center for Research Resources and the National Center for Advancing Translational Sciences, National Institutes of Health, Grant KL2 RR025015 (GE Davis), and grants from the National Institutes of Health: RO1 DC004156 (DR Storm), T32 DC000018–27 (JJ Liu), and TL1 RR025016 (AS Hecht).
The authors have no conflicts of interest to declare pertaining to this article
REFERENCES
- 1. Brämerson A, Johansson L, Ek L, et al. 2004 Prevalence of olfactory dysfunction: The Skövde population-based study. Laryngoscope 114:733–737, 2004 [DOI] [PubMed] [Google Scholar]
- 2. Pace U, Hanski E, Salomon Y, Lancet D. Odorant-sensitive adenylate cyclase may mediate olfactory reception. Nature 316:255–258, 1985 [DOI] [PubMed] [Google Scholar]
- 3. Henkin RI, Velicu I. cAMP and cGMP in nasal mucus related to severity of smell loss in patients with smell dysfunction. Clin Invest Med 31:E78–E84, 2008 [DOI] [PubMed] [Google Scholar]
- 4. Lin RY, Clarin E, Lee M, et al. Patterns of nasal eosinophilia in allergy clinic patients as determined by swab and curette sampling. Allergy Asthma Proc 18:221–226, 1997 [DOI] [PubMed] [Google Scholar]
- 5. Lin RY, Nahal A, Lee M, Menikoff H. Cytologic distinctions between clinical groups using curette-probe compared to cytology brush. Ann Allergy Asthma Immunol 86:226–231, 2001 [DOI] [PubMed] [Google Scholar]
- 6. Doty RL, Shaman P, Kimmelman CP, Dann MS. University of Pennsylvania smell identification test: A rapid quantitative olfactory function test for the clinic. Laryngoscope 94:176–178, 1984 [DOI] [PubMed] [Google Scholar]
- 7. Gallagher EJ, Liebman M, Bijur PE. Prospective validation of clinically important changes in pain severity measured on a visual analog scale. Ann Emerg Med 38:633–638, 2001 [DOI] [PubMed] [Google Scholar]
- 8. Kovásc-Balint Z, Csathó A, László JF, et al. Exposure to an inhomogeneous static magnetic field increases thermal pain threshold in healthy human volunteers. Bioelectromagnetics 32:131–139, 2011 [DOI] [PubMed] [Google Scholar]
- 9. Welge-Lüssen A. Ageing, neurodegeneration, and olfactory and gustatory loss. B-ENT 5(suppl):129–132, 2009 [PubMed] [Google Scholar]
- 10. Féron F, Perry C, McGrath JJ, Mackay-Sim A. New techniques for biopsy and culture of human olfactory epithelial neurons. Arch Otolaryngol Head Neck Surg 124:861–866, 1998 [DOI] [PubMed] [Google Scholar]
- 11. Leopold DA, Hummel T, Schwob JE, et al. Anterior distribution of human olfactory epithelium. Laryngoscope 110:417–421, 2000 [DOI] [PubMed] [Google Scholar]
- 12. Nibu K, Li G, Zhang X, et al. Olfactory neuron-specific expression of NeuroD in mouse and human nasal mucosa. Cell Tissue Res 298:405–414, 1999 [DOI] [PubMed] [Google Scholar]
- 13. Apuhan T, Yildrium YS, Simşek T, et al. Concha bullosa surgery and the distribution of human olfactory neuroepithelium. Eur Arch Otolayngol 270:953–957, 2013 [DOI] [PubMed] [Google Scholar]
- 14. Say P, Leopold D, Cochran G, et al. Resection of the inferior superior turbinate: Does it affect olfactory ability of contain olfactory neuronal tissue? Am J Rhinol 18:157–160, 2004 [PubMed] [Google Scholar]