

Abstract
This study used path analysis to examine effects of cognitive activity and physical activity on cognitive functioning in older adults, through pathways involving beta-amyloid (Aβ) burden, cerebrovascular lesions, and neural injury within brain regions affected in Alzheimer’s disease (AD). Ninety-two cognitively normal older adults (75.2±5.6 years) reported lifetime cognitive activity and current physical activity using validated questionnaires. For each participant, we evaluated cortical Aβ burden (using PIB-PET), cerebrovascular lesions (using MRI-defined white matter lesion (WML)), and neural integrity within AD regions (using a multimodal biomarker). Path models (adjusted for age, gender, and education) indicated that higher lifetime cognitive activity and higher current physical activity was associated with fewer WMLs. Lower WML volumes were in turn related to higher neural integrity and higher global cognitive functioning. As shown previously, higher lifetime cognitive activity was associated with lower PIB retention, which itself moderated the impact of neural integrity on cognitive functioning. Lifestyle activity may thus promote cognitive health in aging by protecting against cerebrovascular pathology and Aβ pathology thought to be relevant to AD development.
Keywords: Cognitive activity, Physical activity, Cognitive aging, Beta-amyloid, PIB-PET, white matter lesion
1 Introduction
Cognitive and physical engagement are among the modifiable lifestyle risk factors for Alzheimer’s disease (AD) (Barnes and Yaffe, 2011), with high potential for preventing or slowing AD progression. Higher levels of cognitive and physical activity are related to lower cross-sectional (Christensen, et al., 1996,Floel, et al., 2010,Hultsch, et al., 1993,Newson and Kemps, 2005) and longitudinal (Wilson, et al., 2002b) cognitive decline and decreased risk of AD (Scarmeas, et al., 2009,Wilson, et al., 2002a,Wilson, et al., 2002b). Given this importance of lifestyle activities, biological mechanisms through which cognitive and physical activities benefit cognitive health in aging (Thies, et al., 2013) need to be delineated.
The recent ability to measure biomarkers thought to be associated with AD pathological processes (Ewers, et al., 2011,Jack, et al., 2010) has provided a way to examine effects of lifestyle on brain pathological burden and cognitive abilities in cognitively normal older adults. Previous research has proposed that the development of AD involves multiple pathological pathways that converge on temporo-parietal brain regions most severely affected in AD. Neural integrity in these regions is captured by established AD-sensitive biomarkers such as regional cortical thinning, regional glucose hypometabolism, and hippocampal atrophy (Dickerson, et al., 2009,Jack, et al., 2012,Knopman, et al., 2012).
One associate of neural injury in AD is cerebrovascular disease. Measureable through white matter lesions (WMLs), cerebrovascular disease is frequently observed in neuropathological examinations in combination with AD pathology in older adults (Schneider and Bennett, 2010). Research has further demonstrated that cerebrovascular disease affects brain structure (Cardenas, et al., 2012,Wirth, et al., 2013c), which itself is correlated with lower cognitive functioning in aging (Raji, et al., 2012). Cognitive and physical activities, on the other hand, could protect against cerebrovascular pathology and thereby help to maintain cognitive health. Lifestyle factors are known to promote white matter (Gow, et al., 2012,Lovden, et al., 2010) and gray matter (Erickson, et al., 2010,Erickson, et al., 2011,Floel, et al., 2010,Ho, et al., 2011) integrity in older adults, by potentially increasing neurogenesis (Erickson, et al., 2011), angiogenesis and/or reducing cerebrovascular risk factors, in particular through physical activity (Kramer, et al., 2006).
On the other hand, Aβ-plaque burden can be found in older adults (Sperling, et al., 2011), where this pathological hallmark of AD can be detected in vivo using (11C) labeled Pittsburgh-Compound-B (PIB) Positron Emission Tomography (PET) imaging (Klunk, et al., 2004,Mintun, et al., 2006)). Aβ deposition may predict subtle (subclinical) cognitive alterations in cognitively normal older individuals (Hedden, et al., 2013) and interact with neural injury in AD-vulnerable regions to aggravate preclinical cognitive decline (Desikan, et al., 2012,Wirth, et al., 2013a,Wirth, et al., 2013b). Importantly, lifestyle activities could dampen the risk of Aβ pathology. This is suggested by previous research showing that both greater lifetime cognitive activity and physical exercise are related to lower brain Aβ burden (Landau, et al., 2012,Liang, et al., 2010).
This study aimed to confirm and extend previous work and construct a comprehensive integrated model that combined lifestyle factors, brain pathological burden, and cognitive functioning in cognitively normal older adults. Using a cross-sectional design and path modeling similar to previous work (Vemuri, et al., 2012), we examined multiple-predictor pathways including cognitive and physical activity, biomarkers reflecting Aβ burden, cerebrovascular disease as well as neural injury with AD-vulnerable regions, and cognitive ability. We first confirmed that separate pathways for cerebrovascular pathology and Aβ pathology are associated with lower cognitive functioning. Adding cognitive and physical activity as exogenous predictors to the pathway model, we conjectured that beneficial effects of lifestyle would be seen on cerebrovascular burden (measured using WML volumes) and on Aβ burden (measured using PIB-PET), which in turn would help to maintain neural integrity (measured using gray-matter thickness, glucose metabolism, and hippocampal volume (Wirth, et al., 2013a)) and cognitive functioning.
2 Methods
2.1 Selection of participants
The sample included 92 community-dwelling cognitively normal older people from the Berkley Aging Cohort (BAC), an ongoing longitudinal study. For the present sample, eligibility criteria included a Geriatric depression scale score (Yesavage, et al., 1982) ≤ 10, Mini mental status examination (MMSE) (Folstein, et al., 1975) score ≥ 25, normal memory functions (all memory scores within -1.5 standard deviations [SD] of age-, gender-, race- and years of education-adjusted norms), and age between 60 – 90 years at first visit. Individuals reported no current serious medical, neurological or psychiatric illnesses (except hypertension [32% of the cases], hyperlipidemia [37%] and diabetes mellitus [3%]). This sample included all 65 individuals from a previous publication (Landau, et al., 2012) that exclusively investigated associations of lifetime cognitive activity and cortical PIB retention.
Each participant underwent a standardized neuropsychological test session as well as MRI and PET scanning (Table 1). For individuals with multiple assessments, the neuropsychological evaluation closest to MRI scanning was chosen. Written informed consent was obtained from each participant in accordance with the Institutional Review Boards of the University of California, Berkeley and Lawrence Berkeley National Laboratory (LBNL).
Table 1.
Characteristics of the participants
| Participants, number | 92 |
| Age at MRI, years (SD), span | 75.2 (5.6), 63 – 88 |
| Women, number (%) | 58 (63) |
| Education, years (SD), span | 16.9 (1.9), 12 – 20 |
| MMSE, mean score (SD), span | 28.7 (1.4), 25 – 30 |
| Measurement characteristics | |
| Δtime (MRI – FDG), years (SD), span | 0.1 (0.4), 0.0 – 1.8 |
| Δtime (FDG – PIB), years (SD), span | 0.0 (0.0), 0.0 – 0.1 |
| Δtime (NTS – MRI), years (SD), span | 0.3 (0.2), 0.0 – 0.8 |
| Lifestyle activity | |
| Cognitive activity, mean score (SD), span | 3.5 (0.5), 2.0 – 4.6 |
| Physical activity a, mean score (SD), span | 10766.8 (9541.8), 0.0 – 53856.5 |
| Biomarkers | |
| WML (mm3), median (SD), span | 2229.0 (2024.3), 922.0 – 10789.0 |
| PIB index, median (SD), span | 1.04 (0.18), 0.82 – 1.76 |
| Cortical Thickness (mm), mean (SD), span | 2.8 (0.2), 2.1 – 3.1 |
| FDG-PET, mean (SD), span | 1.5 (0.1), 1.3 – 1.7 |
| HV (mm3), mean (SD), span | 3532.6 (430.1), 2141.0 – 4828.5 |
Mean or Median and standard deviation (SD) and span are provided
The physical activity score was divided by a factor of 10 for descriptive purposes. Selected abbreviations: MMSE, Mini Mental Status Examination; Δ, Absolute difference, NTS, Neuropsychological Test Session; WML, White Matter Lesion, PIB, Pittsburgh-Compound-B; HV, Hippocampal Volume
2.2 Assessment of cognitive and physical activity
2.2.1 Cognitive activity
Cognitive activity was measured using a cognitive activity interview, described elsewhere (Wilson, et al., 2003). In brief, a 25-item interview was administered, in which the frequency of relatively common cognitively demanding activities, such as reading books, newspapers and magazines, writing letters, going to the library and playing games, was recorded across age epochs at age 6, 12, 18, 40 (retrospectively), and at the current age. Responses were provided on a 5-point frequency scale ranging from 1 (once a year or less) to 5 (every day or almost every day). For each participant, we calculated the mean of each age epoch and created three cognitive activity measures: early (average over the age epochs 6, 12 and 18), middle life (average over the age epoch 40), and current (average over the current age epoch) life.
A test-retest analysis was conducted for 75 of our participants, who completed at least two cognitive activity interview measurements with an average time interval of 1.63 years (SD = 0.50). Test-retest reliability was measured using the intra-class correlation coefficient (ICC) and indicated good reliability for the age-epoch related measures, that is for early life cognitive activity (ICC: r = 0.92, 95% CI: 0.88, 0.95), for middle life cognitive activity an ICC of r = 0.89, 95% CI: 0.83, 0.93, and for current cognitive activity the ICC was r = 0.79, 95% CI: 0.67, 0.87. The results replicate earlier re-test correlation reports based on an independent sample (Wilson, et al., 2003) and a smaller BAC sample (Landau, et al., 2012). Evaluating the reproducibility using t-tests, cognitive activity measures for early life (t[74] = 0.27, p = 0.90), middle life (t[74] = 0.27, p = 0.79) and current life (t[74] = 0.64, p = 0.52) did not differ significantly between first and second administration of the questionnaire and there was no significant variation across age epochs, as indicated by a repeated-measure ANOVA (F(2,148) = 0.28, p = 0.76).
2.2.2 Physical activity
Current physical activity was measured using a previously validated physical activity interview based on the modified Minnesota leisure-time activities questionnaire (Geffken, et al., 2001,Taylor, et al., 1978). A list of 15 leisure-time physical activities (e.g., cycling, dancing, bowling, swimming) was provided and participants were asked if they participated in any of the given activities. For each activity, information was further collected on the frequency (how often during the last two weeks and how many months per year) and duration of engagement (time spent per session). For each physical activity, frequency and duration information were multiplied with an activity-specific intensity code indicating calorie expenditure (Taylor, et al., 1978). The activity-dependent scores were summed to obtain the overall intensity of physical activity (total kilocalories of energy expended) per person during the last 12 months.
For the 74 participants who had two physical activity measurements available (average time interval = 1.62 years [SD = 0.50]), the test-retest reliability was computed with r = 0.85 (95% CI: 0.76, 0.90), indicating good reliability. There was no statistical difference between the physical activity measures obtained at first and second administration (t[73] = 0.63, p = 0.53). Current physical activity was negatively correlated with Body Mass Index (BMI, r = -0.27, p < 0.01), indicating construct validity, similarly reported in earlier studies using the same questionnaire (Ho, et al., 2011,Siscovick, et al., 1997).
2.3 Acquisition and pre-processing of the neuroimaging data
2.3.1 MRI
Structural MRI scans were acquired at the Lawrence Berkeley National Laboratory (LBNL) on a 1.5T Magnetom Avanto system (Siemens Medical Systems, Iselin, NJ) using a 12 channel head-coil run in triple mode. High-resolution T1-weighted magnetization-prepared rapid gradient echo (MPRAGE) scans were collected axially with the following measurement parameters: TR = 2110 ms, TE = 3.58 ms, flip angle = 15°, field of view = 256 × 256 mm, number of slices = 160 with a 50% gap, voxel size = 1 × 1 × 1 mm3.
2.3.2 FDG-PET
Participants underwent FDG-PET scanning with 6-10 mCi tracer injection at LBNL using a Siemens ECAT EXACT HR PET scanner in a 3D acquisition mode about 2h following PIB injection. Starting 30 min post-injection, 6 × 5-minute frames of emission data were collected. Ten-minute transmission scans for attenuation correction were obtained. The FDG- and also PIB-PET data were reconstructed using an ordered subset expectation maximization algorithm with weighted attenuation. Images were smoothed applying a 4 mm Gaussian kernel with scatter correction.
FDG-PET image pre-processing, described in detail elsewhere (Wirth, et al., 2013a), included realignment and averaging of the individual frames and smoothing to 8 mm full-width at half maximum (FWHM) to bring the scans to the resolution of Alzheimer’s Disease Neuroimaging Initiative (ADNI, http://www.adni-info.org/) scans (Joshi, et al., 2009). The smoothed FDG-PET images were intensity normalized to the mean pontine glucose metabolism, using a region-of-interest edited manually from the subcortical FreeSurfer 5.1 segmentation (Fischl, et al., 2002).
2.3.3 PIB-PET
PIB-PET scans were collected at LBNL, with injection of approximately 15 mCi of the [11C] PIB tracer. Dynamic acquisition frames were obtained in the 3D acquisition mode over a 90 min measurement interval (4 ×15s frames, 8 × 30s frames, 9 × 60s frames, 2 × 180s frames, 8 × 300s frames, and 3 × 600s frames) after a 10 min transmission scan. The data processing, in detail described elsewhere (Wirth, et al., 2013a), used graphical analysis with a cerebellar gray reference region to construct distribution volume ratio (DVR) images (Logan, et al., 1996).
2.4 Assessment of white matter lesions
For each individual, WML volumes were estimated using the subcortical FreeSurfer 5.1 segmentation (Fischl, et al., 2002,Smith, et al., 2011), rank-transformed to address the skewed distribution (Conover and Iman, 1981,Conover and Iman, 1982), and residualized for total FreeSurfer 5.1-generated intracranial volume (ICV) via regression. The FreeSurfer 5.1-derived WML volumes were validated using Fluid attenuated inversion recovery (FLAIR) images (available in 77 out of 92 cases) with the application of a semi-automated WML segmentation algorithm (DeCarli, et al., 2005). There was good agreement between the two rank-transformed and ICV-adjusted WML volumes as indicated by an intra-class correlation coefficient of 0.83 (95% CI: 0.73, 0.89).
The FreeSurfer 5.1-derived WML volumes correlated with systolic blood pressure (age-adjusted partial correlation: r = 0.36, p < 0.01), as a major vascular risk factor, supporting construct validity. Systolic blood pressure was recorded from the brachial artery using a commercially available blood pressure monitor, in sitting position before the neuropsychological testing (available in 88 out of 92 individuals).
2.5 Assessment of Aβ burden
To estimate the participants’ brain Aβ burden, a global cortical PIB index was calculated. The native-space PIB-PET images were co-registered to the native-space MRI scans and a mean DVR value was derived from frontal, temporal, parietal and anterior/posterior cingulate ROIs using the automated Desikan-Killiany parcellation (Desikan, et al., 2006).
Mean cortical PIB retention was evaluated as a continuous variable by the PIB index, which was rank-transformed for the present analysis to correct for the skewed distribution. To confirm our previous findings in a smaller BAC sample (Wirth, et al., 2013a), PIB retention was also evaluated as a dichotomous variable to compare individuals with lowest (PIB-) and highest (PIB+) PIB retention levels. Using established procedures for cutoff threshold derivation, the PIB- cutoff threshold was set to two standard deviations above the mean of the global cortical PIB index estimated in an independent group of healthy young adults (Mormino, et al., 2012), yielding a value of 1.08. Participants with cortical PIB retention below this threshold were classified as PIB- (n = 62). The PIB+ cutoff threshold, as determined using the iterative outlier approach (Aizenstein, et al., 2008), yielded a value of 1.12. Participants with cortical PIB retention above this threshold were classified as PIB+ (n = 21).
2.6 Assessment of neural integrity within AD regions
Neural integrity within regions most affected by AD was measured using a previously established AD-sensitive multi-modality biomarker (Wirth, et al., 2013a). The measure combined cortical thickness, FDG-PET, and hippocampal volume (HV) as a discriminant function generated using cognitively normal participants and AD patients from ADNI. The neuroimage processing pipeline is described in detail elsewhere (Wirth, et al., 2013a).
In brief, first, each biomarker was measured within each participant using the FreeSurfer 5.1 software package (http://surfer.nmr.mgh.harvard.edu/) (Dale, et al., 1999,Fischl and Dale, 2000,Fischl, et al., 1999). For cortical thickness and FDG-PET, surface maps were created from the native-space MRI and FDG-PET images (Park, et al., 2006). To extract glucose metabolism and cortical thickness within common AD-vulnerable cortical regions, a previously established AD template (Wirth, et al., 2013a,Wirth, et al., 2013c) was used (Figure1). The template was mapped onto the native-space surface maps of all participants in this study to extract mean cortical thickness and FDG-PET uptake across these AD regions for each participant. HV was measured in the native-space MRI scans using the automated subcortical FreeSurfer 5.1 segmentation (Fischl, et al., 2002). The hemisphere-specific HV estimates were averaged and adjusted for head size via regression with the FreeSurfer 5.1 generated total intracranial volume (ICV).
Figure 1.
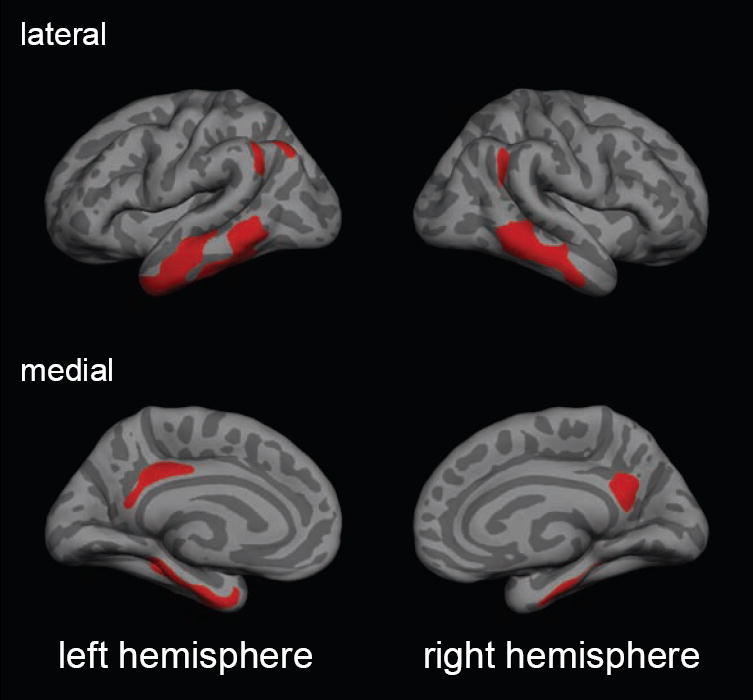
The template of cortical AD-vulnerable regions (color coded in red) projected onto a standard surface map. Cortical regions included bilateral middle and medial temporal areas, the angular gyrus, the posterior cingulate region and the precuneus.
These measures, cortical thickness, FDG-PET and ICV-adjusted HV, were then combined using a discriminant function analysis (Wirth, et al., 2013a). Specifically, a linear function was determined in the separate groups of cognitively normal adults and AD patients that combined the three biomarkers to maximize AD sensitivity, that is, the ability to discriminate between AD patients and healthy controls. The linear function was applied to combine the three biomarkers of the present BAC sample, whereby lower values of the combined (multi-modality) biomarker indicate lower neural integrity (or higher neural injury) within regions most affected by AD, and thus resemble a more AD-typical neurodegenerative pattern.
2.7 Assessment of global cognitive functioning
We assessed cognitive functioning using a global composite measure, comparable to previous publications (Vemuri, et al., 2012,Wilson, et al., 2002b). Our measure combined eight cognitive tests of episodic memory and executive functions (Wirth, et al., 2013a), which are provided in the supplementary material. Test-specific scores were combined by converting each cognitive test to z scores using the mean and standard deviation of the BAC participants that had cognitive data available and averaging them.
2.8 Assessment of covariates
In follow-up analyses, we examined whether the associations in the path models remained stable when controlling for three potentially confounding variables: subjective memory functioning, depression, and socioeconomic status (SES). Subjective memory assessments, previously shown to be sensitive to Aβ pathology (Perrotin, et al., 2012), were assessed using two rating scales: one which asked the participants to rate their memory functioning in comparison with other people of their age, and one that compared a subject’s memory to memory 20 years ago, using a 4-point scale ranging from 1(better) to 4 (much worse). Based on a significant positive correlation (r = 0.38, p < 0.001), the two rating scales were averaged. Depression was measured using the Geriatric Depression Scale score (Yesavage, et al., 1982). SES was measured by classifying participants’ self-reported professional backgrounds using the 1990 occupation classification systems of the U.S. Bureau of the Census (Hauser and Warren, 1997).
2.9 Statistical Analysis
We first conducted preliminary correlation analyses including cognitive and physical activity, the biomarkers (WML, PIB retention and the neural integrity biomarker), and global cognitive functioning. Subsequently, serial multiple-mediation path models were tested (Hayes, 2013). All statistical models were adjusted for age, gender and years of education, by including the covariates as predictors of each variable under investigation and using the residuals for statistical analyses.
2.9.1 Correlation analysis
Pearson partial correlation coefficients (partial r’s) estimated direct effects between cognitive and physical activity, the biomarker of interest and global cognitive functioning. The correlation analysis was conducted using SPSS, version 20.0.0.
2.9.2 Path analysis
Serial multiple-mediation path models (each adjusted for age, gender and years of education) assessed indirect (mediation) and direct effects across multiple variables using the Amos statistical software package (version 20.0.0). A mediation was present when an independent variable affected a dependent variable through one or more mediator variables and was examined by significant indirect effects (i.e., the product of paths coefficients approach) and was In our mediation analysis, we followed current recommendations, which do not require direct effects to be significant, if indirect effects are significant (Rucker, et al., 2011,Shrout and Bolger, 2002). Indirect as well as direct effects were evaluated for significance at p < 0.05 using 95% bias-corrected confidence intervals established via bootstrapping techniques implemented in Amos, using 5000 bootstrap samples (Hayes and Scharkow, 2013,Preacher and Hayes, 2004,Preacher and Hayes, 2008). We also tested moderating effects in AMOS using multi-group path modeling, in accordance with recommended procedures (Byrne, 1998).
A goodness-of-fit analysis was conducted for each path model (Bollen and Long, 1993). Good model fit to the observed data was indicated by non-significant χ2 values (p > 0.05), the ratio between chi-square and degrees of freedom (χ2/df ratio < 2), the comparative fit index (CFI ≥ 0.95), and the root mean square error of approximation (RMSEA ≤ 0.05). The ratio of sample size to the number of estimated parameters was above 5:1 for each path model as recommended (Bentler and Chou, 1987). Mahalanobis Distance (p < 0.001) was used to detect influential cases, which were excluded in follow-up models. Unless reported otherwise, results remained unchanged when influential cases were removed.
We started with confirmatory path models (step 1) that corroborated relationships between the biomarkers and global cognitive functioning. Two separate pathways were analyzed, one indicative of cerebrovascular disease and one reflecting Aβ. For the cerebrovascular pathway, we examined whether WMLs predicted variability in the neural integrity biomarker, which itself was anticipated to predict global cognitive functioning, as reported earlier (Raji, et al., 2012). For the Aβ pathway, we did not test for a direct association between PIB retention and neural integrity because we failed to find such a relationship in a previous report (Wirth, et al., 2013a). Rather we conducted a moderation analysis to confirm our previous results. Using a multi-group analysis (Byrne, 1998), we compared relationships of neural integrity and global cognitive functioning between individuals with high PIB retention level (PIB+) and low (PIB-) PIB retention level. In case of a moderation effect of PIB uptake, β values were expected to differ significantly between PIB+ and PIB- individuals.
In the overall path model (step 2), cognitive and physical activity measures were both added as predictors to examine their effects in the biomarker model of step 1 (which integrated the biomarkers of WML, PIB retention and neural integrity). PIB retention was included as a continuous variable (the moderation effect was examined separately in a multi-group model and was therefore excluded from this path models). Lifetime cognitive activity was modeled as a latent (construct) variable, estimated from the shared variance of early, middle and current life cognitive activity. This procedure is part of the structural equation-modeling framework and accounts for the unreliability of each cognitive activity measure.
Subsequently, we examined the feasibility of the overall path model and the stability of our results. First, to examine reverse causality (Hultsch, et al., 1999), we explored an alternative path model where cognitive and physical activities were conceptualized as a consequence, rather than a predictor of brain pathology. In this alternative model, biomarkers (WML, PIB retention and neural integrity) predicted lifetime cognitive and current physical activity, which in turn predicted global cognitive functioning. Then, we controlled for additional covariates of subjective memory functioning, depression, and SES.
In follow-up path models, we assessed relationships of early life, middle life and current cognitive activity to investigate contributions of certain age epochs. Each cognitive activity measure was added as a predictor to the biomarker model. To determine whether the relationships of cognitive activity and WML as well as cognitive activity and PIB retention differed significantly across age epoch χ2 difference tests were used to compare respective β values.
3 Results
3.1 Sample characteristics
Descriptive information of demographic variables, biomarkers and lifestyle activity measures are provided in Table 1. All neuroimaging (MRI, FDG-PET and PIB-PET) measurements and the neuropsychological test session were obtained in close proximity.
3.2 Correlation analysis
The preliminary correlation analysis (Table 2), adjusted for age, gender and years of education, indicated significant direct associations across the age-epoch related cognitive activity measures (all p’s < 0.01). There were significant negative correlations between cognitive activity (middle and current life) and WMLs as well as current physical activity and WMLs (p’s < 0.05). Cognitive activity (early and middle life) was significantly negative related to PIB retention (p’s < 0.05), which was not true for current physical activity (p > 0.05). WML volumes were significantly negatively correlated with the neural integrity biomarker, which itself was significantly positively related to global cognitive functioning (p < 0.01). As previously shown, there were no significant relationships between PIB retention and WML (p = 0.95) (Hedden, et al., 2012b,Marchant, et al., 2012) or between PIB retention and the neural integrity biomarker (p = 0.33) (Wirth, et al., 2013a).
Table 2. Result of the partial correlation analysis.
Age-, gender- and years of education-adjusted partial correlations between cognitive and physical activity, biomarkers (WML, PIB retention and neural integrity) and global cognitive functioning
| [1] | [2] | [3] | [4] | [5] | [6] | [7[ | [8] | |
|---|---|---|---|---|---|---|---|---|
| [1] Cognitive Activity, early life | 1.00 | 0.43** | 0.33** | 0.19 | 0.03 | -0.22* | 0.09 | 0.21* |
| [2] Cognitive Activity, middle life | 1.00 | 0.66** | 0.18 | -0.24* | -0.36** | -0.01 | 0.09 | |
| [3] Cognitive Activity, current | 1.00 | 0.18 | -0.25* | -0.15 | 0.07 | 0.18 | ||
| [4] Physical Activity, current | 1.00 | -0.24* | -0.12 | -0.05 | 0.08 | |||
| [5] WML volume | 1.00 | 0.01 | -0.27* | -0.07 | ||||
| [6] PIB index | 1.00 | 0.10 | 0.08 | |||||
| [7] Neural integrity | 1.00 | 0.36** | ||||||
| [8] Global Cognitive Functioning | 1.00 |
Abbreviations: WML, White matter lesion; PIB, Pittsburgh-Compound-B
Bold: Correlation is significant at
p < 0.01,
p < 0.05
Our results were not fully explainable by any of the covariates (Supplementary Table e1A-C). Adjusting for subjective memory functioning, significant correlations were generally maintained; the relationship between early life cognitive activity and PIB retention was reduced to trend level (p = 0.06). The main results also remained stable when adjusting for depression and SES.
3.3 Path analysis
3.3.1 Relationships between biomarkers and cognition
Building on earlier work (Raji, et al., 2012,Wirth, et al., 2013a), the path model (adjusted for age, gender, and years of education) confirmed relationships between biomarkers and global cognitive functioning (Figure 2). For the cerebrovascular pathway (model fit: χ2 [1] = 0.07, p = 0.79, χ2/df = 0.07, RMSEA: 0.00, CFI: 1.00) increased WML volumes directly predicted lower neural integrity (β = -0.27, 95% CI: -0.45, -0.08, p < 0.01), which in turn predicted lower global cognitive functioning (β = 0.36, 95% CI: 0.17, 0.54, p < 0.01). There was a significant indirect effect of WMLs on global cognitive functioning (β = -0.10, 95% CI: -0.19, -0.03, p < 0.01), mediated by neural integrity. For the Aβ pathway (model fit: χ2 [2] = 0.02, p = 0.99, χ2/df = 0.01, RMSEA: 0.00, CFI: 1.00), the expected moderation effect of the PIB retention groups was confirmed. That is, the association of neural integrity on global cognitive functioning was exacerbated (significant contrast of the β values, p < 0.05) in individuals with high (PIB+: β = 0.66, 95% CI: 0.33, 0.88, p < 0.01) compared to lowest (PIB-: β = 0.37, 95% CI: 0.12, 0.57, p < 0.05) PIB retention levels.
Figure 2.
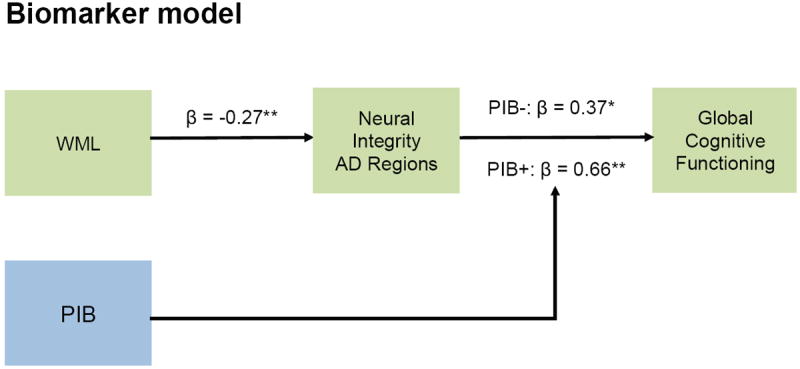
Age-, gender, and years of education-adjusted path diagrams for biomarkers and global cognitive functioning. For the cerebrovascular pathway (green), increased WML volumes were confirmed to have a significant negative effect on global cognitive functioning, which was mediated by lower neural integrity within AD regions. For the Aβ pathway (blue), the moderation effect of PIB retention was confirmed by significantly different path coefficients between PIB- and PIB+ groups. Standardized beta coefficients are provided; asterisks specify that beta coefficient is significant at ** p < 0.01, * p < 0.05. Solid black lines indicate significant relationships. Standardized beta coefficients are provided. Abbreviations: WML, White matter lesion; PIB, Pittsburgh-Compound-B
3.3.2 Relationships between cognitive activity, physical activity, biomarkers and cognition
The path model (adjusted for age, gender, and years of education) examined relationships between lifelong cognitive activity, physical activity, biomarkers and global cognitive functioning (Figure 3). Model fit was good (χ2 [18] = 20.94, p = 0.28, χ2/df = 1.16, RMSEA: 0.04, CFI: 0.97). Higher lifetime cognitive activity (indexed by early, middle and current life cognitive activity) predicted lower WML volumes (β = -0.21, 95% CI: -0.42, -0.01, p < 0.05). Lower WML volumes in turn mediated beneficial effects of lifetime cognitive activity on neural integrity (indirect effect: β = 0.06, 95% CI: 0.01, 0.15, p < 0.05) and global cognitive functioning (indirect effect: β = 0.02, 95% CI: 0.003, 0.06, p < 0.05). Higher lifetime cognitive activity also predicted lower PIB retention (β = -0.36, 95% CI: -0.57, -0.11, p < 0.01), which was confirmed to moderate the effect of neural integrity on cognition in the biomarker models (see 3.3.1.)
Figure 3.
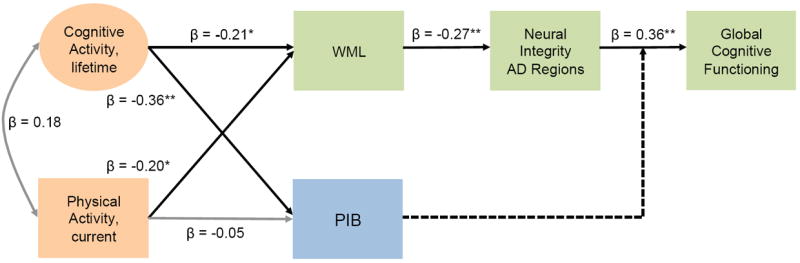
Age-, gender, and years of education-adjusted path diagrams for lifetime cognitive activity and current physical activity, biomarkers and global cognitive functioning. Higher lifetime cognitive activity was confirmed to lower PIB retention and had a beneficial effect on global cognitive functioning, which was mediated by lower WML volumes and greater neural integrity. Likewise current physical activity had a beneficial effect on global cognitive functioning via the mediation of WMLs and neural integrity. Standardized beta coefficients are provided; asterisks specify that beta coefficient is significant at ** p < 0.01, * p < 0.05. Solid black lines indicate significant direct effects, grey lines indicate non-significant relations, and broken lines indicate moderations (examined separately in a multi-group model). Circles denote latent variables; squares represent observed variables. Abbreviations: CA, cognitive activity; PA, physical activity; WML, White matter lesion; PIB, Pittsburgh-Compound-B
Higher current physical activity was significantly related to lower WML volumes (β = -0.20, 95% CI: -0.38, -0.002, p < 0.05), which in turn mediated beneficial effects of current physical activity on neural integrity (indirect effect: β = 0.05, 95% CI: 0.01, 0.15, p < 0.05) and global cognitive functioning (indirect effect: β = 0.02, 95% CI: 0.01, 0.05, p < 0.05). Current physical activity did not have a significant effect on PIB retention (β = -0.05, 95% CI: -0.25, 0.15, p = 0.62). When one influential case was excluded, the negative relationship between physical activity and WMLs was reduced to trend level (β = -0.20, 95% CI: -0.37, 0.01, p = 0.05); the other effects were maintained.
There was no evidence for a reverse causation effect. The path model, assessing whether lifestyle activities mediated the effects of biomarkers (PIB retention and WMLs on neural integrity) on global cognitive functioning, had bad model fit (χ2 [17] = 41.20, p < 0.001, χ2/df = 2.42, RMSEA: 0.13, CFI: 0.78).
Controlling the path model for additional covariates of subjective memory functioning, depression, and SES all direct and all indirect (i.e., mediation) effects of lifetime cognitive and current physical activity were preserved with one exception. The effect of physical activity on WML was reduced to trend level, when adjusting for subjective memory functioning (β = -0.20, 95% CI: -0.37, 0.01, p = 0.06) or depression (β = -0.20, 95% CI: -0.38, 0.003, p = 0.05).
In a series of follow-up path models potential contributions of cognitive activity at particular age epochs were elaborated. The path models (all of which had excellent model fit) are explained in the supplementary material and will be summarized in brief. Higher middle life and current cognitive activity predicted lower WML volumes (all p’s < 0.05); the respective path coefficients (β values) were significantly different from early life cognitive activity (all p’s < 0.05). Lower WML volumes in turn mediated beneficial effects of middle life and current cognitive activity on neural integrity (indirect effects: all p’s < 0.05) and global cognitive functioning (indirect effects: all p’s < 0.01). Higher early life and middle life cognitive activity predicted lower cortical PIB retention, but only the path coefficient (β value) of middle life cognitive activity differed significantly from current cognitive activity (p < 0.05). The relationship between early life cognitive activity and PIB retention was reduced to trend level (p = 0.07), when controlling for subjective memory functioning.
4 Discussion
The National Institutes of Health (NIH) has identified behavioral change as a priority research field, since behavior and its underlying mechanisms have immense effects on health outcomes and promise savings in healthcare costs. The present study confirmed and extended previous findings (Landau, et al., 2012,Raji, et al., 2012,Wirth, et al., 2013a,Wirth, et al., 2013c) by constructing an integrated model of relationships between lifestyle factors, multiple brain pathologies, and cognition in cognitively normal older individuals. We document that lifestyle activities indicative of greater cognitive and physical engagement may benefit cognitive health by protecting against cerebrovascular brain injury and/or Aβ burden, thought to be relevant to AD development.
4.1 Relationships between pathological pathways and cognitive aging
Our integrative model corroborated that pathways of Aβ pathology and cerebrovascular pathology converged on AD-vulnerable regions to affect cognitive functions in older adults. For the cerebrovascular pathway, we confirmed that larger WML volumes were associated with decreased cognitive functions mediated by lower neural integrity within AD regions (Raji, et al., 2012). The findings further converge with an earlier path modeling study, where hippocampal volume and glucose metabolism within AD regions predicted lower cognitive functioning in a mixed sample of cognitively normal adults and mild cognitive impairment patients (Vemuri, et al., 2012). For the Aβ pathway, the presence of brain Aβ burden moderated (aggravated) effects of neural injury within AD regions on cognitive functioning in older adults, as previously shown (Desikan, et al., 2012,Wirth, et al., 2013a,Wirth, et al., 2013b). There was no direct effect of Aβ pathology on cognitive functioning, which can be explained by the fact that such relationships are small and inconsistently found in cognitively normal older individuals (Aizenstein, et al., 2008,Mormino, et al., 2009,Pike, et al., 2007) and, if present, more selectively affect memory functions (Hedden, et al., 2012a,2013). Overall, the present model suggests that brain injury resulting from non-Aβ pathways could heighten the brains’ vulnerability to Aβ burden in older age, thereby diminishing cognitive health.
4.2 Relationship between lifestyle activity and cerebrovascular pathology
Lifestyle factors could help to maintain cognitive health through effects on cerebrovascular disease. Both, greater lifetime cognitive activity as well as current physical activity (albeit somewhat less robust) independently predicted lower WML volumes. Fewer WMLs in turn mediated beneficial effects of an active lifestyle on neural integrity within AD regions and cognitive functioning. The findings are in agreement with a body of research, describing advantageous effects of cognitive and physical engagement on white matter structure. Specifically, physical activity and exercise previously predicted increased white matter integrity (Gons, et al., 2013,Voss, et al., 2012), normal-appearing white matter volume as well as fewer WMLs (Gow, et al., 2012). Likewise, there is evidence suggesting that greater cognitive activity or training can improve white matter microstructure in younger people (Takeuchi, et al., 2010), as well as older adults (Lovden, et al., 2010), though the latter association was previously not detected using self-reports (Gow, et al., 2012).
Two potential biological mechanisms might underlie the observed beneficial effects of lifestyle activities on white matter integrity (Rovio, et al., 2010). Physical activity, in particular, could decrease vascular risk factors, such as hypertension (Kivipelto, et al., 2001,Launer, 2002). At the same time, cognitive and physical activity could both encourage cellular and molecular mechanisms that help to maintain brain health. One could therefore assume that an active lifestyle might protect against subtle alterations of normal-appearing white matter microstructure that emerge during mid-life (Maillard, et al., 2012b) and likely constitute a precursor of WMLs in later life (de Groot, et al., 2013).
Congruent with a previous study, we did not find direct effects of physical and cognitive activity on biomarkers of brain injury (Vemuri, et al., 2012). Although there is evidence that greater cognitive attainment, such as better education, increases brain reserve (larger brain structures, more efficient neural functions) (Arenaza-Urquijo, et al., 2013,Sole-Padulles, et al., 2009), our data suggest that lifestyle factors work through their effects on white matter injury and Aβ burden. In addition, other pathological factors such as tau pathology (Braak, et al., 2011) may affect neural structure as well as function and could attenuate lifestyle effects on the brain.
4.3 Relationship between lifestyle activity and Aβ pathology
Greater lifetime cognitive activity mitigated Aβ deposition, and thereby benefited cognitive aging. The finding of lower Aβ burden in cognitively active older adults is convergent with previous observations in a subset of the individuals in this study (Landau, et al., 2012), but inconsistent with other reports (Vemuri, et al., 2012). Participants with different characteristics and different cognitive activity measures could explain this variation across studies. Our study examined cognitively normal individuals and used a measure extracting the frequency of cognitively demanding activities over the life course. By contrast, Vemuri and colleagues (2012) included individuals with mild cognitive impairment and used a cognitive activity measure that combined education, occupation and current cognitive activity.
One biological mechanism that might mediate beneficial effects of lifetime cognitive activity on brain Aβ deposition is the positive relationship between neural activity and Aβ found in animal and human studies (Bero, et al., 2011,Brody, et al., 2008,Kang, et al., 2009). Greater lifetime cognitive engagement could result in “training” effects that produce more efficient neural activity throughout life (Gold, et al., 2013), thereby protecting against Aβ release in brain regions most susceptible to Aβ burden (Jagust and Mormino, 2011).
One could hypothesize that less cognitive activity may result from prodromal symptoms such as apathy, which was previously associated with Aβ deposition in AD (Mori, et al., 2013) and MCI (Marshall, et al., 2013) patients. Indeed, there is evidence that Aβ deposition may emerge in middle life as early as age 50 (Kok, et al., 2009). However, this only occurs in less than 10% of the population (Braak, et al., 2011) and is therefore unlikely to significantly influence our results. In addition, we did not find evidence for reverse causation in our path model, that is, brain pathology did not significantly predict cognitive functioning via modifications of lifestyle activities.
4.4 Relationships between cognitive activity across age epochs and brain pathology
Our results hint that middle life might be a crucial period to moderate brain pathological burden. In the present study, a cognitively active lifestyle in middle life was related to both lower WMLs and Aβ deposition in older age. Research suggests that white matter pathology is a continuously evolving process starting during the middle life (Maillard, et al., 2012a) and could be potentially “kept at bay” with a physically and cognitively enriched lifestyle. Neural processes driving Aβ burden may evolve over the life-span and might be modulated by lifestyle activities during a life stage that is typically free of Aβ deposition. Consistent with this idea, studies with transgenic Aβ-expressing mice have demonstrated that preventative exposure to environmental enrichment could protect against Aβ burden in experimental compared with control animals (Costa, et al., 2007,Herring, et al., 2011,Lazarov, et al., 2005). Likewise, epidemiologic studies demonstrate beneficial effects of middle-life lifestyle factors on cognition and dementia incidence in later life (Carlson, et al., 2008,Friedland, et al., 2001,Rovio, et al., 2010), supporting an important role of midlife lifestyle behaviors in healthy aging.
One could argue that variations in reliability of our cognitive activity measure might have contributed to the results. Indeed, somewhat lower reliability was obtained for late-life cognitive activity, potentially indicating that current cognitive activity is more variable compared to retrospective reports of earlier life events.
4.5 Limitations
Our study has limitations. First, the path models suggest a sequence where lifestyle activities act as risk factors of brain pathological events, which themselves are associated with cognitive functioning. Although we did not obtain indications supporting reverse causality effects, the finding is based on cross-sectional data, which provides limited ability to infer causal relationships. In addition, subtle effects of lifestyle activity on brain integrity and cognitive ability could be obscured in cross-sectional data, due to the impact of other factors (e.g. age) on the inter-individual variance (Hertzog, et al., 2008). The proposed relationships thus need to be tested in suitable longitudinal observational or intervention studies (Salthouse, 2006). Second, although our measures of physical and cognitive activity are reliable and valid, they are based on self-reports that are partially retrospective and could be biased. It is unknown whether the responses to the questions accurately reflect cognitive activity measured independently and objectively. The current cognitive and health status of individuals could have influenced self-reports of past events; however, our results remained stable after adjusting for depression and subjective memory functioning. It might also be possible that the presence of WMLs or Aβ burden influences retrospective self-reports of cognitive activity, or that there is a more complex relationship in which mid-life cognitive activity acts as one potential protective factor against neural injury, whereas the actual incidence of WMLs or Aβ burden in late-life begins to reduce cognitive activity. Finally, physical and cognitive activity might reflect proxies for a variety of other factors that are associated with better health outcomes. Notably though, the observed relationships do not appear to reflect the impact of higher socioeconomic status, which is an established associate of better health.
4.6 Conclusion
Cognitive and physical activity may help to maintain brain integrity and cognitive health in advanced age, by diminishing Aβ-dependent and Aβ-independent pathological pathways thought to be involved in AD development.
Supplementary Material
Acknowledgments
This research work was supported by NIH grant AG034570, and the Swiss National Science Foundation grant PA00P1-131515. We sincerely thank Grace Tang, Shawn Marks, Cindee M. Madison, Suzanne Baker, and Renaud La Joie (all UC Berkeley) for their support in neuroimage (MRI and PET) analysis as well as bevioral data processing or result discussion.
Footnotes
Publisher's Disclaimer: This is a PDF file of an unedited manuscript that has been accepted for publication. As a service to our customers we are providing this early version of the manuscript. The manuscript will undergo copyediting, typesetting, and review of the resulting proof before it is published in its final citable form. Please note that during the production process errors may be discovered which could affect the content, and all legal disclaimers that apply to the journal pertain.
References
- Aizenstein HJ, Nebes RD, Saxton JA, Price JC, Mathis CA, Tsopelas ND, Ziolko SK, James JA, Snitz BE, Houck PR, Bi W, Cohen AD, Lopresti BJ, DeKosky ST, Halligan EM, Klunk WE. Frequent amyloid deposition without significant cognitive impairment among the elderly. Arch Neurol. 2008;65(11):1509–17. doi: 10.1001/archneur.65.11.1509. [DOI] [PMC free article] [PubMed] [Google Scholar]
- Arenaza-Urquijo EM, Landeau B, La Joie R, Mevel K, Mezenge F, Perrotin A, Desgranges B, Bartres-Faz D, Eustache F, Chetelat G. Relationships between years of education and gray matter volume, metabolism and functional connectivity in healthy elders. Neuroimage. 2013;83C:450–7. doi: 10.1016/j.neuroimage.2013.06.053. [DOI] [PubMed] [Google Scholar]
- Barnes DE, Yaffe K. The projected effect of risk factor reduction on Alzheimer’s disease prevalence. Lancet Neurol. 2011;10(9):819–28. doi: 10.1016/S1474-4422(11)70072-2. [DOI] [PMC free article] [PubMed] [Google Scholar]
- Bentler PM, Chou CP. Practical Issues in Structural Modeling. Sociological Methods & Research. 1987;16(1):78–117. doi: 10.1177/0049124187016001004. [DOI] [Google Scholar]
- Bero AW, Yan P, Roh JH, Cirrito JR, Stewart FR, Raichle ME, Lee JM, Holtzman DM. Neuronal activity regulates the regional vulnerability to amyloid-beta deposition. Nature neuroscience. 2011;14(6):750–6. doi: 10.1038/nn.2801. [DOI] [PMC free article] [PubMed] [Google Scholar]
- Bollen KA, Long JS. Testing structural equation models. Sage Publications; Newbury Park: 1993. [Google Scholar]
- Braak H, Thal DR, Ghebremedhin E, Del Tredici K. Stages of the pathologic process in Alzheimer disease: age categories from 1 to 100 years. J Neuropathol Exp Neurol. 2011;70(11):960–9. doi: 10.1097/NEN.0b013e318232a379. [DOI] [PubMed] [Google Scholar]
- Brody DL, Magnoni S, Schwetye KE, Spinner ML, Esparza TJ, Stocchetti N, Zipfel GJ, Holtzman DM. Amyloid-beta dynamics correlate with neurological status in the injured human brain. Science. 2008;321(5893):1221–4. doi: 10.1126/science.1161591. [DOI] [PMC free article] [PubMed] [Google Scholar]
- Byrne BM. Structural equation modeling with LISREL, PRELIS, and SIMPLIS : basic concepts, applications, and programming. L. Erlbaum Associates; Mahwah, N.J: 1998. [Google Scholar]
- Cardenas VA, Reed B, Chao LL, Chui H, Sanossian N, Decarli CC, Mack W, Kramer J, Hodis HN, Yan M, Buonocore MH, Carmichael O, Jagust WJ, Weiner MW. Associations among vascular risk factors, carotid atherosclerosis, and cortical volume and thickness in older adults. Stroke. 2012;43(11):2865–70. doi: 10.1161/strokeaha.112.659722. [DOI] [PMC free article] [PubMed] [Google Scholar]
- Carlson MC, Helms MJ, Steffens DC, Burke JR, Potter GG, Plassman BL. Midlife activity predicts risk of dementia in older male twin pairs. Alzheimers Dement. 2008;4(5):324–31. doi: 10.1016/j.jalz.2008.07.002. [DOI] [PMC free article] [PubMed] [Google Scholar]
- Christensen H, Korten A, Jorm AF, Henderson AS, Scott R, Mackinnon AJ. Activity levels and cognitive functioning in an elderly community sample. Age and ageing. 1996;25(1):72–80. doi: 10.1093/ageing/25.1.72. [DOI] [PubMed] [Google Scholar]
- Conover WJ, Iman RL. Rank Transformations as a Bridge Between Parametric and Nonparametric Statistics. The American Statistician. 1981;35(3):124–9. doi: 10.2307/2683975. [DOI] [Google Scholar]
- Conover WJ, Iman RL. Analysis of Covariance Using the Rank Transformation. Biometrics. 1982;38(3):715–24. doi: 10.2307/2530051. [DOI] [PubMed] [Google Scholar]
- Costa DA, Cracchiolo JR, Bachstetter AD, Hughes TF, Bales KR, Paul SM, Mervis RF, Arendash GW, Potter H. Enrichment improves cognition in AD mice by amyloid-related and unrelated mechanisms. Neurobiol Aging. 2007;28(6):831–44. doi: 10.1016/j.neurobiolaging.2006.04.009. [DOI] [PubMed] [Google Scholar]
- Dale AM, Fischl B, Sereno MI. Cortical surface-based analysis. I. Segmentation and surface reconstruction. Neuroimage. 1999;9(2):179–94. doi: 10.1006/nimg.1998.0395. [DOI] [PubMed] [Google Scholar]
- de Groot M, Verhaaren BF, de Boer R, Klein S, Hofman A, van der Lugt A, Ikram MA, Niessen WJ, Vernooij MW. Changes in normal-appearing white matter precede development of white matter lesions. Stroke. 2013;44(4):1037–42. doi: 10.1161/STROKEAHA.112.680223. [DOI] [PubMed] [Google Scholar]
- DeCarli C, Fletcher E, Ramey V, Harvey D, Jagust WJ. Anatomical mapping of white matter hyperintensities (WMH): exploring the relationships between periventricular WMH, deep WMH, and total WMH burden. Stroke. 2005;36(1):50–5. doi: 10.1161/01.STR.0000150668.58689.f2. [DOI] [PMC free article] [PubMed] [Google Scholar]
- Desikan RS, McEvoy LK, Thompson WK, Holland D, Brewer JB, Aisen PS, Sperling RA, Dale AM Initi, A.s.D.N. Amyloid-beta-Associated Clinical Decline Occurs Only in the Presence of Elevated P-tau. Arch Neurol. 2012;69(6):709–13. doi: 10.1001/Archneurol.2011.3354. [DOI] [PMC free article] [PubMed] [Google Scholar]
- Desikan RS, Segonne F, Fischl B, Quinn BT, Dickerson BC, Blacker D, Buckner RL, Dale AM, Maguire RP, Hyman BT, Albert MS, Killiany RJ. An automated labeling system for subdividing the human cerebral cortex on MRI scans into gyral based regions of interest. Neuroimage. 2006;31(3):968–80. doi: 10.1016/j.neuroimage.2006.01.021. [DOI] [PubMed] [Google Scholar]
- Dickerson BC, Bakkour A, Salat DH, Feczko E, Pacheco J, Greve DN, Grodstein F, Wright CI, Blacker D, Rosas HD, Sperling RA, Atri A, Growdon JH, Hyman BT, Morris JC, Fischl B, Buckner RL. The cortical signature of Alzheimer’s disease: regionally specific cortical thinning relates to symptom severity in very mild to mild AD dementia and is detectable in asymptomatic amyloid-positive individuals. Cereb Cortex. 2009;19(3):497–510. doi: 10.1093/cercor/bhn113. [DOI] [PMC free article] [PubMed] [Google Scholar]
- Erickson KI, Raji CA, Lopez OL, Becker JT, Rosano C, Newman AB, Gach HM, Thompson PM, Ho AJ, Kuller LH. Physical activity predicts gray matter volume in late adulthood: the Cardiovascular Health Study. Neurology. 2010;75(16):1415–22. doi: 10.1212/WNL.0b013e3181f88359. [DOI] [PMC free article] [PubMed] [Google Scholar]
- Erickson KI, Voss MW, Prakash RS, Basak C, Szabo A, Chaddock L, Kim JS, Heo S, Alves H, White SM, Wojcicki TR, Mailey E, Vieira VJ, Martin SA, Pence BD, Woods JA, McAuley E, Kramer AF. Exercise training increases size of hippocampus and improves memory. Proc Natl Acad Sci U S A. 2011;108(7):3017–22. doi: 10.1073/pnas.1015950108. [DOI] [PMC free article] [PubMed] [Google Scholar]
- Ewers M, Sperling RA, Klunk WE, Weiner MW, Hampel H. Neuroimaging markers for the prediction and early diagnosis of Alzheimer’s disease dementia. Trends Neurosci. 2011;34(8):430–42. doi: 10.1016/j.tins.2011.05.005. [DOI] [PMC free article] [PubMed] [Google Scholar]
- Fischl B, Dale AM. Measuring the thickness of the human cerebral cortex from magnetic resonance images. Proc Natl Acad Sci U S A. 2000;97(20):11050–5. doi: 10.1073/pnas.200033797. [DOI] [PMC free article] [PubMed] [Google Scholar]
- Fischl B, Salat DH, Busa E, Albert M, Dieterich M, Haselgrove C, van der Kouwe A, Killiany R, Kennedy D, Klaveness S, Montillo A, Makris N, Rosen B, Dale AM. Whole brain segmentation: automated labeling of neuroanatomical structures in the human brain. Neuron. 2002;33(3):341–55. doi: 10.1016/s0896-6273(02)00569-x. [DOI] [PubMed] [Google Scholar]
- Fischl B, Sereno MI, Dale AM. Cortical surface-based analysis. II: Inflation, flattening, and a surface-based coordinate system. Neuroimage. 1999;9(2):195–207. doi: 10.1006/nimg.1998.0396. [DOI] [PubMed] [Google Scholar]
- Floel A, Ruscheweyh R, Kruger K, Willemer C, Winter B, Volker K, Lohmann H, Zitzmann M, Mooren F, Breitenstein C, Knecht S. Physical activity and memory functions: are neurotrophins and cerebral gray matter volume the missing link? Neuroimage. 2010;49(3):2756–63. doi: 10.1016/j.neuroimage.2009.10.043. [DOI] [PubMed] [Google Scholar]
- Folstein M, Folstein S, McHugh P. “Mini-mental state”: a practical method for grading the cognitive state of patients for the clinicians. Journal of Psychiatric Research. 1975;12(3):189–98. doi: 10.1016/0022-3956(75)90026-6. [DOI] [PubMed] [Google Scholar]
- Friedland RP, Fritsch T, Smyth KA, Koss E, Lerner AJ, Chen CH, Petot GJ, Debanne SM. Patients with Alzheimer’s disease have reduced activities in midlife compared with healthy control-group members. Proc Natl Acad Sci U S A. 2001;98(6):3440–5. doi: 10.1073/pnas.061002998. [DOI] [PMC free article] [PubMed] [Google Scholar]
- Geffken DF, Cushman M, Burke GL, Polak JF, Sakkinen PA, Tracy RP. Association between physical activity and markers of inflammation in a healthy elderly population. American journal of epidemiology. 2001;153(3):242–50. doi: 10.1093/aje/153.3.242. [DOI] [PubMed] [Google Scholar]
- Gold BT, Kim C, Johnson NF, Kryscio RJ, Smith CD. Lifelong bilingualism maintains neural efficiency for cognitive control in aging. J Neurosci. 2013;33(2):387–96. doi: 10.1523/JNEUROSCI.3837-12.2013. [DOI] [PMC free article] [PubMed] [Google Scholar]
- Gons RA, Tuladhar AM, de Laat KF, van Norden AG, van Dijk EJ, Norris DG, Zwiers MP, de Leeuw FE. Physical activity is related to the structural integrity of cerebral white matter. Neurology. 2013;81(11):971–6. doi: 10.1212/WNL.0b013e3182a43e33. [DOI] [PubMed] [Google Scholar]
- Gow AJ, Bastin ME, Munoz Maniega S, Valdes Hernandez MC, Morris Z, Murray C, Royle NA, Starr JM, Deary IJ, Wardlaw JM. Neuroprotective lifestyles and the aging brain: activity, atrophy, and white matter integrity. Neurology. 2012;79(17):1802–8. doi: 10.1212/WNL.0b013e3182703fd2. [DOI] [PubMed] [Google Scholar]
- Hauser RM, Warren JR. Socioeconomic Indexes for Occupations: A Review, Update, and Critique. Sociological Methodology. 1997;27(1):177–298. doi: 10.1111/1467-9531.271028. [DOI] [Google Scholar]
- Hayes AF. Introduction to mediation, moderation, and conditional process analysis : a regression-based approach 2013 [Google Scholar]
- Hayes AF, Scharkow M. The Relative Trustworthiness of Inferential Tests of the Indirect Effect in Statistical Mediation Analysis: Does Method Really Matter? Psychol Sci. 2013;24(10):1918–27. doi: 10.1177/0956797613480187. [DOI] [PubMed] [Google Scholar]
- Hedden T, Mormino EC, Amariglio RE, Younger AP, Schultz AP, Becker JA, Buckner RL, Johnson KA, Sperling RA, Rentz DM. Cognitive profile of amyloid burden and white matter hyperintensities in cognitively normal older adults. J Neurosci. 2012a;32(46):16233–42. doi: 10.1523/JNEUROSCI.2462-12.2012. [DOI] [PMC free article] [PubMed] [Google Scholar]
- Hedden T, Oh H, Younger AP, Patel TA. Meta-analysis of amyloid-cognition relations in cognitively normal older adults. Neurology. 2013;80(14):1341–8. doi: 10.1212/WNL.0b013e31828ab35d. [DOI] [PMC free article] [PubMed] [Google Scholar]
- Hedden T, Van Dijk KRA, Shire EH, Sperling RA, Johnson KA, Buckner RL. Failure to Modulate Attentional Control in Advanced Aging Linked to White Matter Pathology. Cereb Cortex. 2012b;22(5):1038–51. doi: 10.1093/Cercor/Bhr172. [DOI] [PMC free article] [PubMed] [Google Scholar]
- Herring A, Lewejohann L, Panzer AL, Donath A, Kroll O, Sachser N, Paulus W, Keyvani K. Preventive and therapeutic types of environmental enrichment counteract beta amyloid pathology by different molecular mechanisms. Neurobiol Dis. 2011;42(3):530–8. doi: 10.1016/J.Nbd.2011.03.007. [DOI] [PubMed] [Google Scholar]
- Hertzog C, Kramer AF, Wilson RS, Lindenberger U. Enrichment Effects on Adult Cognitive Development: Can the Functional Capacity of Older Adults Be Preserved and Enhanced? Psychological Science in the Public Interest. 2008;9(1):1–65. doi: 10.1111/j.1539-6053.2009.01034.x. [DOI] [PubMed] [Google Scholar]
- Ho AJ, Raji CA, Becker JT, Lopez OL, Kuller LH, Hua X, Dinov ID, Stein JL, Rosano C, Toga AW, Thompson PM. The Effects of Physical Activity, Education, and Body Mass Index on the Aging Brain. Hum Brain Mapp. 2011;32(9):1371–82. doi: 10.1002/Hbm.21113. [DOI] [PMC free article] [PubMed] [Google Scholar]
- Hultsch DF, Hammer M, Small BJ. Age differences in cognitive performance in later life: relationships to self-reported health and activity life style. Journal of gerontology. 1993;48(1):P1–11. doi: 10.1093/geronj/48.1.p1. [DOI] [PubMed] [Google Scholar]
- Hultsch DF, Hertzog C, Small BJ, Dixon RA. Use it or lose it: engaged lifestyle as a buffer of cognitive decline in aging? Psychol Aging. 1999;14(2):245–63. doi: 10.1037//0882-7974.14.2.245. [DOI] [PubMed] [Google Scholar]
- Jack CR, Jr, Knopman DS, Jagust WJ, Shaw LM, Aisen PS, Weiner MW, Petersen RC, Trojanowski JQ. Hypothetical model of dynamic biomarkers of the Alzheimer’s pathological cascade. Lancet Neurol. 2010;9(1):119–28. doi: 10.1016/S1474-4422(09)70299-6. [DOI] [PMC free article] [PubMed] [Google Scholar]
- Jack CR, Knopman DS, Weigand SD, Wiste HJ, Vemuri P, Lowe V, Kantarci K, Gunter JL, Senjem ML, Ivnik RJ, Roberts RO, Rocca WA, Boeve BF, Petersen RC. An operational approach to National Institute on Aging-Alzheimer’s Association criteria for preclinical Alzheimer disease. Ann Neurol. 2012;71(6):765–75. doi: 10.1002/Ana.22628. [DOI] [PMC free article] [PubMed] [Google Scholar]
- Jagust WJ, Mormino EC. Lifespan brain activity, beta-amyloid, and Alzheimer’s disease. Trends Cogn Sci. 2011;15(11):520–6. doi: 10.1016/j.tics.2011.09.004. [DOI] [PMC free article] [PubMed] [Google Scholar]
- Joshi A, Koeppe RA, Fessler JA. Reducing between scanner differences in multi-center PET studies. Neuroimage. 2009;46(1):154–9. doi: 10.1016/j.neuroimage.2009.01.057. [DOI] [PMC free article] [PubMed] [Google Scholar]
- Kang JE, Lim MM, Bateman RJ, Lee JJ, Smyth LP, Cirrito JR, Fujiki N, Nishino S, Holtzman DM. Amyloid-beta dynamics are regulated by orexin and the sleep-wake cycle. Science. 2009;326(5955):1005–7. doi: 10.1126/science.1180962. [DOI] [PMC free article] [PubMed] [Google Scholar]
- Kivipelto M, Helkala EL, Hanninen T, Laakso MP, Hallikainen M, Alhainen K, Soininen H, Tuomilehto J, Nissinen A. Midlife vascular risk factors and late-life mild cognitive impairment: A population-based study. Neurology. 2001;56(12):1683–9. doi: 10.1212/wnl.56.12.1683. [DOI] [PubMed] [Google Scholar]
- Klunk WE, Engler H, Nordberg A, Wang Y, Blomqvist G, Holt DP, Bergstrom M, Savitcheva I, Huang GF, Estrada S, Ausen B, Debnath ML, Barletta J, Price JC, Sandell J, Lopresti BJ, Wall A, Koivisto P, Antoni G, Mathis CA, Langstrom B. Imaging brain amyloid in Alzheimer’s disease with Pittsburgh Compound-B. Ann Neurol. 2004;55(3):306–19. doi: 10.1002/ana.20009. [DOI] [PubMed] [Google Scholar]
- Knopman DS, Jack CR, Jr, Wiste HJ, Weigand SD, Vemuri P, Lowe VJ, Kantarci K, Gunter JL, Senjem ML, Mielke MM, Roberts RO, Boeve BF, Petersen RC. Brain injury biomarkers are not dependent on beta-amyloid in normal elderly. Ann Neurol. 2012 doi: 10.1002/ana.23816. [DOI] [PMC free article] [PubMed] [Google Scholar]
- Kok E, Haikonen S, Luoto T, Huhtala H, Goebeler S, Haapasalo H, Karhunen PJ. Apolipoprotein E-dependent accumulation of Alzheimer disease-related lesions begins in middle age. Ann Neurol. 2009;65(6):650–7. doi: 10.1002/ana.21696. [DOI] [PubMed] [Google Scholar]
- Kramer AF, Erickson KI, Colcombe SJ. Exercise, cognition, and the aging brain. Journal of applied physiology. 2006;101(4):1237–42. doi: 10.1152/japplphysiol.00500.2006. [DOI] [PubMed] [Google Scholar]
- Landau SM, Marks SM, Mormino EC, Rabinovici GD, Oh H, O’Neil JP, Wilson RS, Jagust WJ. Association of Lifetime Cognitive Engagement and Low beta-Amyloid Deposition. Arch Neurol. 2012 doi: 10.1001/archneurol.2011.2748. [DOI] [PMC free article] [PubMed] [Google Scholar]
- Launer LJ. Demonstrating the case that AD is a vascular disease: epidemiologic evidence. Ageing Res Rev. 2002;1(1):61–77. doi: 10.1016/s0047-6374(01)00364-5. [DOI] [PubMed] [Google Scholar]
- Lazarov O, Robinson J, Tang YP, Hairston IS, Korade-Mirnics Z, Lee VM, Hersh LB, Sapolsky RM, Mirnics K, Sisodia SS. Environmental enrichment reduces Abeta levels and amyloid deposition in transgenic mice. Cell. 2005;120(5):701–13. doi: 10.1016/j.cell.2005.01.015. [DOI] [PubMed] [Google Scholar]
- Liang KY, Mintun MA, Fagan AM, Goate AM, Bugg JM, Holtzman DM, Morris JC, Head D. Exercise and Alzheimer’s disease biomarkers in cognitively normal older adults. Ann Neurol. 2010;68(3):311–8. doi: 10.1002/ana.22096. [DOI] [PMC free article] [PubMed] [Google Scholar]
- Logan J, Fowler JS, Volkow ND, Wang GJ, Ding YS, Alexoff DL. Distribution volume ratios without blood sampling from graphical analysis of PET data. J Cereb Blood Flow Metab. 1996;16(5):834–40. doi: 10.1097/00004647-199609000-00008. [DOI] [PubMed] [Google Scholar]
- Lovden M, Bodammer NC, Kuhn S, Kaufmann J, Schutze H, Tempelmann C, Heinze HJ, Duzel E, Schmiedek F, Lindenberger U. Experience-dependent plasticity of white-matter microstructure extends into old age. Neuropsychologia. 2010;48(13):3878–83. doi: 10.1016/j.neuropsychologia.2010.08.026. [DOI] [PubMed] [Google Scholar]
- Maillard P, Carmichael O, Fletcher E, Reed B, Mungas D, DeCarli C. Coevolution of white matter hyperintensities and cognition in the elderly. Neurology. 2012a;79(5):442–8. doi: 10.1212/WNL.0b013e3182617136. [DOI] [PMC free article] [PubMed] [Google Scholar]
- Maillard P, Seshadri S, Beiser A, Himali JJ, Au R, Fletcher E, Carmichael O, Wolf PA, DeCarli C. Effects of systolic blood pressure on white-matter integrity in young adults in the Framingham Heart Study: a cross-sectional study. Lancet Neurol. 2012b;11(12):1039–47. doi: 10.1016/S1474-4422(12)70241-7. [DOI] [PMC free article] [PubMed] [Google Scholar]
- Marchant NL, Reed BR, DeCarli CS, Madison CM, Weiner MW, Chui HC, Jagust WJ. Cerebrovascular disease, beta-amyloid, and cognition in aging. Neurobiol Aging. 2012;33(5):1006 e25–36. doi: 10.1016/j.neurobiolaging.2011.10.001. [DOI] [PMC free article] [PubMed] [Google Scholar]
- Marshall GA, Donovan NJ, Lorius N, Gidicsin CM, Maye J, Pepin LC, Becker JA, Amariglio RE, Rentz DM, Sperling RA, Johnson KA. Apathy is associated with increased amyloid burden in mild cognitive impairment. The Journal of neuropsychiatry and clinical neurosciences. 2013;25(4):302–7. doi: 10.1176/appi.neuropsych.12060156. [DOI] [PMC free article] [PubMed] [Google Scholar]
- Mintun MA, Larossa GN, Sheline YI, Dence CS, Lee SY, Mach RH, Klunk WE, Mathis CA, DeKosky ST, Morris JC. [11C]PIB in a nondemented population: potential antecedent marker of Alzheimer disease. Neurology. 2006;67(3):446–52. doi: 10.1212/01.wnl.0000228230.26044.a4. [DOI] [PubMed] [Google Scholar]
- Mori T, Shimada H, Shinotoh H, Hirano S, Eguchi Y, Yamada M, Fukuhara R, Tanimukai S, Zhang MR, Kuwabara S, Ueno SI, Suhara T. Apathy correlates with prefrontal amyloid beta deposition in Alzheimer’s disease. Journal of neurology, neurosurgery, and psychiatry. 2013 doi: 10.1136/jnnp-2013-306110. [DOI] [PubMed] [Google Scholar]
- Mormino EC, Brandel MG, Madison CM, Rabinovici GD, Marks S, Baker SL, Jagust WJ. Not quite PIB-positive, not quite PIB-negative: slight PIB elevations in elderly normal control subjects are biologically relevant. Neuroimage. 2012;59(2):1152–60. doi: 10.1016/j.neuroimage.2011.07.098. [DOI] [PMC free article] [PubMed] [Google Scholar]
- Mormino EC, Kluth JT, Madison CM, Rabinovici GD, Baker SL, Miller BL, Koeppe RA, Mathis CA, Weiner MW, Jagust WJ. Episodic memory loss is related to hippocampal-mediated beta-amyloid deposition in elderly subjects. Brain. 2009;132(Pt 5):1310–23. doi: 10.1093/brain/awn320. [DOI] [PMC free article] [PubMed] [Google Scholar]
- Newson RS, Kemps EB. General lifestyle activities as a predictor of current cognition and cognitive change in older adults: a cross-sectional and longitudinal examination. The journals of gerontology Series B, Psychological sciences and social sciences. 2005;60(3):P113–20. doi: 10.1093/geronb/60.3.p113. [DOI] [PubMed] [Google Scholar]
- Park HJ, Lee JD, Chun JW, Seok JH, Yun M, Oh MK, Kim JJ. Cortical surface-based analysis of 18F-FDG PET: measured metabolic abnormalities in schizophrenia are affected by cortical structural abnormalities. Neuroimage. 2006;31(4):1434–44. doi: 10.1016/j.neuroimage.2006.02.001. [DOI] [PubMed] [Google Scholar]
- Perrotin A, Mormino EC, Madison CM, Hayenga AO, Jagust WJ. Subjective cognition and amyloid deposition imaging: a Pittsburgh Compound B positron emission tomography study in normal elderly individuals. Arch Neurol. 2012;69(2):223–9. doi: 10.1001/archneurol.2011.666. [DOI] [PMC free article] [PubMed] [Google Scholar]
- Pike KE, Savage G, Villemagne VL, Ng S, Moss SA, Maruff P, Mathis CA, Klunk WE, Masters CL, Rowe CC. Beta-amyloid imaging and memory in non-demented individuals: evidence for preclinical Alzheimer’s disease. Brain. 2007;130(Pt 11):2837–44. doi: 10.1093/brain/awm238. [DOI] [PubMed] [Google Scholar]
- Preacher KJ, Hayes AF. SPSS and SAS procedures for estimating indirect effects in simple mediation models. Behavior research methods, instruments, & computers : a journal of the Psychonomic Society, Inc. 2004;36(4):717–31. doi: 10.3758/bf03206553. [DOI] [PubMed] [Google Scholar]
- Preacher KJ, Hayes AF. Asymptotic and resampling strategies for assessing and comparing indirect effects in multiple mediator models. Behavior research methods. 2008;40(3):879–91. doi: 10.3758/brm.40.3.879. [DOI] [PubMed] [Google Scholar]
- Raji CA, Lopez OL, Kuller LH, Carmichael OT, Longstreth WT, Jr, Gach HM, Boardman J, Bernick CB, Thompson PM, Becker JT. White matter lesions and brain gray matter volume in cognitively normal elders. Neurobiol Aging. 2012;33(4):834 e7–16. doi: 10.1016/j.neurobiolaging.2011.08.010. [DOI] [PMC free article] [PubMed] [Google Scholar]
- Rovio S, Spulber G, Nieminen LJ, Niskanen E, Winblad B, Tuomilehto J, Nissinen A, Soininen H, Kivipelto M. The effect of midlife physical activity on structural brain changes in the elderly. Neurobiol Aging. 2010;31(11):1927–36. doi: 10.1016/j.neurobiolaging.2008.10.007. [DOI] [PubMed] [Google Scholar]
- Rucker DD, Preacher KJ, Tormala ZL, Petty RE. Mediation Analysis in Social Psychology: Current Practices and New Recommendations. Social and Personality Psychology Compass. 2011;5(6):359–71. doi: 10.1111/j.1751-9004.2011.00355.x. [DOI] [Google Scholar]
- Salthouse TA. Mental Exercise and Mental Aging: Evaluating the Validity of the “Use It or Lose It” Hypothesis. Perspectives on Psychological Science. 2006;1(1):68–87. doi: 10.1111/j.1745-6916.2006.00005.x. [DOI] [PubMed] [Google Scholar]
- Scarmeas N, Luchsinger JA, Schupf N, Brickman AM, Cosentino S, Tang MX, Stern Y. Physical activity, diet, and risk of Alzheimer disease. Jama. 2009;302(6):627–37. doi: 10.1001/jama.2009.1144. [DOI] [PMC free article] [PubMed] [Google Scholar]
- Schneider JA, Bennett DA. Where vascular meets neurodegenerative disease. Stroke. 2010;41(10 Suppl):S144–6. doi: 10.1161/STROKEAHA.110.598326. [DOI] [PMC free article] [PubMed] [Google Scholar]
- Shrout PE, Bolger N. Mediation in experimental and nonexperimental studies: new procedures and recommendations. Psychological methods. 2002;7(4):422–45. [PubMed] [Google Scholar]
- Siscovick DS, Fried L, Mittelmark M, Rutan G, Bild D, O’Leary DH. Exercise intensity and subclinical cardiovascular disease in the elderly. The Cardiovascular Health Study. American journal of epidemiology. 1997;145(11):977–86. doi: 10.1093/oxfordjournals.aje.a009066. [DOI] [PubMed] [Google Scholar]
- Smith EE, Salat DH, Jeng J, McCreary CR, Fischl B, Schmahmann JD, Dickerson BC, Viswanathan A, Albert MS, Blacker D, Greenberg SM. Correlations between MRI white matter lesion location and executive function and episodic memory. Neurology. 2011;76(17):1492–9. doi: 10.1212/WNL.0b013e318217e7c8. [DOI] [PMC free article] [PubMed] [Google Scholar]
- Sole-Padulles C, Bartres-Faz D, Junque C, Vendrell P, Rami L, Clemente IC, Bosch B, Villar A, Bargallo N, Jurado MA, Barrios M, Molinuevo JL. Brain structure and function related to cognitive reserve variables in normal aging, mild cognitive impairment and Alzheimer’s disease. Neurobiol Aging. 2009;30(7):1114–24. doi: 10.1016/j.neurobiolaging.2007.10.008. [DOI] [PubMed] [Google Scholar]
- Sperling RA, Aisen PS, Beckett LA, Bennett DA, Craft S, Fagan AM, Iwatsubo T, Jack CR, Jr, Kaye J, Montine TJ, Park DC, Reiman EM, Rowe CC, Siemers E, Stern Y, Yaffe K, Carrillo MC, Thies B, Morrison-Bogorad M, Wagster MV, Phelps CH. Toward defining the preclinical stages of Alzheimer’s disease: recommendations from the National Institute on Aging-Alzheimer’s Association workgroups on diagnostic guidelines for Alzheimer’s disease. Alzheimers Dement. 2011;7(3):280–92. doi: 10.1016/j.jalz.2011.03.003. [DOI] [PMC free article] [PubMed] [Google Scholar]
- Takeuchi H, Sekiguchi A, Taki Y, Yokoyama S, Yomogida Y, Komuro N, Yamanouchi T, Suzuki S, Kawashima R. Training of working memory impacts structural connectivity. J Neurosci. 2010;30(9):3297–303. doi: 10.1523/JNEUROSCI.4611-09.2010. [DOI] [PMC free article] [PubMed] [Google Scholar]
- Taylor HL, Jacobs DR, Jr, Schucker B, Knudsen J, Leon AS, Debacker G. A questionnaire for the assessment of leisure time physical activities. Journal of chronic diseases. 1978;31(12):741–55. doi: 10.1016/0021-9681(78)90058-9. [DOI] [PubMed] [Google Scholar]
- Thies W, Bleiler L, Alzheimer’s A. 2013 Alzheimer’s disease facts and figures. Alzheimers Dement. 2013;9(2):208–45. doi: 10.1016/j.jalz.2013.02.003. [DOI] [PubMed] [Google Scholar]
- Tucker AM, Stern Y. Cognitive reserve in aging. Current Alzheimer research. 2011;8(4):354–60. doi: 10.2174/156720511795745320. [DOI] [PMC free article] [PubMed] [Google Scholar]
- Vemuri P, Lesnick TG, Przybelski SA, Knopman DS, Roberts RO, Lowe VJ, Kantarci K, Senjem ML, Gunter JL, Boeve BF, Petersen RC, Jack CR., Jr Effect of lifestyle activities on Alzheimer disease biomarkers and cognition. Ann Neurol. 2012;72(5):730–8. doi: 10.1002/ana.23665. [DOI] [PMC free article] [PubMed] [Google Scholar]
- Voss MW, Heo S, Prakash RS, Erickson KI, Alves H, Chaddock L, Szabo AN, Mailey EL, Wojcicki TR, White SM, Gothe N, McAuley E, Sutton BP, Kramer AF. The influence of aerobic fitness on cerebral white matter integrity and cognitive function in older adults: Results of a one-year exercise intervention. Hum Brain Mapp. 2012 doi: 10.1002/hbm.22119. [DOI] [PMC free article] [PubMed] [Google Scholar]
- Wilson R, Barnes L, Bennett D. Assessment of lifetime participation in cognitively stimulating activities. Journal of clinical and experimental neuropsychology. 2003;25(5):634–42. doi: 10.1076/jcen.25.5.634.14572. [DOI] [PubMed] [Google Scholar]
- Wilson RS, Bennett DA, Bienias JL, Aggarwal NT, Mendes De Leon CF, Morris MC, Schneider JA, Evans DA. Cognitive activity and incident AD in a population-based sample of older persons. Neurology. 2002a;59(12):1910–4. doi: 10.1212/01.wnl.0000036905.59156.a1. [DOI] [PubMed] [Google Scholar]
- Wilson RS, Mendes De Leon CF, Barnes LL, Schneider JA, Bienias JL, Evans DA, Bennett DA. Participation in cognitively stimulating activities and risk of incident Alzheimer disease. Jama. 2002b;287(6):742–8. doi: 10.1001/jama.287.6.742. [DOI] [PubMed] [Google Scholar]
- Wirth M, Madison CM, Rabinovici GD, Oh H, Landau SM, Jagust WJ. Alzheimer’s Disease Neurodegenerative Biomarkers Are Associated with Decreased Cognitive Function but Not beta-Amyloid in Cognitively Normal Older Individuals. J Neurosci. 2013a;33(13):5553–63. doi: 10.1523/JNEUROSCI.4409-12.2013. [DOI] [PMC free article] [PubMed] [Google Scholar]
- Wirth M, Oh H, Mormino EC, Markley C, Landau SM, Jagust WJ. The effect of amyloid beta on cognitive decline is modulated by neural integrity in cognitively normal elderly. Alzheimers Dement. 2013b doi: 10.1016/j.jalz.2012.10.012. [DOI] [PMC free article] [PubMed] [Google Scholar]
- Wirth M, Villeneuve S, Haase CM, Madison CM, Oh H, Landau SM, Rabinovici GD, Jagust WJ. Associations Between Alzheimer Disease Biomarkers, Neurodegeneration, and Cognition in Cognitively Normal Older People. JAMA neurology. 2013c doi: 10.1001/jamaneurol.2013.4013. [DOI] [PMC free article] [PubMed] [Google Scholar]
- Yesavage JA, Brink TL, Rose TL, Lum O, Huang V, Adey M, Leirer VO. Development and validation of a geriatric depression screening scale: a preliminary report. Journal of psychiatric research. 1982;17(1):37–49. doi: 10.1016/0022-3956(82)90033-4. [DOI] [PubMed] [Google Scholar]
Associated Data
This section collects any data citations, data availability statements, or supplementary materials included in this article.