

Abstract
Thalamus is a potent driver of cortical activity even though cortical synapses onto excitatory layer 4 neurons outnumber thalamic synapses 10 to 1. Previous in vitro studies have proposed that thalamocortical (TC) synapses are stronger than corticocortical (CC) synapses. Here, we investigated possible anatomical and physiological differences between these inputs in the rat in vivo. We developed a high-throughput light microscopy method, validated by electron microscopy, to completely map the locations of synapses across an entire dendritic tree. This demonstrated that TC synapses are slightly more proximal to the soma than CC synapses, but detailed compartmental modeling predicted that dendritic filtering does not appreciably favor one synaptic class over another. Measurements of synaptic strength in intact animals confirmed that both TC and CC synapses are weak and approximately equivalent. We conclude that thalamic effectiveness does not rely on enhanced TC strength, but rather on coincident activation of converging inputs.
Keywords: compartmental, confocal, dendrite, in vivo, optogenetics, synapse
Introduction
An individual brain area typically accounts for only a small fraction of synapses onto neurons in an area downstream, yet that projection can wield outsized influence over its target. This apparent contradiction has been perhaps most intensely studied in the thalamocortical system. Thalamus strongly excites primary sensory neocortex even though thalamic terminals comprise only a small minority of synapses onto cortical neurons (Benshalom and White, 1986; Peters and Payne, 1993; Gil et al., 1999). A long-standing hypothesis holds that thalamocortical (TC) synapses are significantly more efficacious than corticocortical (CC) synapses, allowing thalamus to drive cortex.
When measured in acute neocortical slices, unitary TC synaptic connections onto neurons in thalamorecipient layers of primary sensory cortical areas are several-fold stronger than unitary CC connections, a phenomenon observed across multiple species and sensory modalities (Stratford et al., 1996; Gil et al., 1999; Richardson et al., 2009). Several factors have been proposed to explain the relative strength of TC synapses, including a higher number of release sites and superior reliability (Gil et al., 1999). Recent physiological studies have suggested that TC synapses may be located more proximally to the soma than CC synapses and therefore are less filtered by the passive membrane properties of the dendrites (Richardson et al., 2009), but electron microscopy studies have not reported biased spatial distributions (White and Rock, 1980; Benshalom and White, 1986; da Costa and Martin, 2011). With the exception of a detailed EM reconstruction of a single spiny stellate neuron (White and Rock, 1980), prior physiological and anatomical studies have been limited to sampling small areas of the neuron's dendritic arbor and few of its total synapses.
An alternative explanation is that TC and CC synapses are equally efficacious, but thalamic synapses are sufficiently convergent and coincidently active to drive cortex (Alonso et al., 1996; Roy and Alloway, 2001; Temereanca and Simons, 2003; Bruno and Sakmann, 2006; Wang et al., 2010; Bruno, 2011). A direct, side-by-side comparison of TC and CC input strengths has never been performed in vivo. Therefore, the relative synaptic strength of each class of inputs in the intact brain is unknown and it remains an open question whether the thalamus drives cortical activity via relatively stronger inputs or via convergent, synchronous inputs.
We set out to resolve this issue in vivo, where presynaptic and postsynaptic structures are intact, by testing whether thalamic synapses differ from cortical synapses either in their detailed anatomical configuration or their physiological strength. We developed a fast, reliable, high-throughput light microscopy method to construct complete maps of the TC synapses onto the dendritic arbors of individual cortical neurons. This comprehensive mapping approach revealed a slight but significant proximal bias of TC synapses relative to CC synapses onto excitatory layer 4 (L4) barrel neurons. Compartmental modeling predicted, however, that this bias is insufficient to significantly enhance TC strength. By adapting a minimal stimulation protocol for use in the living animal, we showed that TC and CC synapses are both weak and similar in strength, which is in contrast to prior studies performed in acute slice preparations. Given that these two classes of synapses are functionally indistinguishable, our data are most consistent with a model in which thalamus employs synchronous, convergent inputs to drive neocortex.
Materials and Methods
Animals.
All procedures were approved by the Columbia University Institutional Animal Care and Use Committee. We used 6 juvenile (P16–P21) and 14 adult (weight 167–408 g) Wistar rats (Hilltop Laboratories, Charles River Laboratories) for experiments. All reconstructed cells were filled in adult rats.
Virus injections.
Thalamic boutons were labeled with virus as described previously (Wimmer et al., 2010). Briefly, animals were injected with adeno-associated virus (AAV1/2) encoding a synaptophysin-EGFP fusion protein under control of a hybrid CMV enhancer/chicken β-actin promoter (titer: ∼107 particles/ml). Rats were anesthetized with isoflurane and rectal body temperature was maintained at 37°C with a heating pad. Injections were stereotaxically targeted to 2.85 mm posterior of bregma, 3.2 mm lateral of the midline, and 5.05 mm deep from the pia. Calibrated micropipettes (5 μl, intraMARK; Blaubrand) were used to measure the injected volume (250 nl). After injections, rats were left to recover and virus was allowed to express for up to 5 months before cell filling. Injections infected 85–95% of thalamic neurons. No cortical neurons were found to be infected. Rats continued to explore their environments with their whiskers normally and showed no behavioral abnormalities, including in a separate group of control animals expressing the protein for ∼1.5 years in which no cells were filled.
Cell filling.
Rats were anesthetized with isoflurane and rectal body temperature was maintained at 37°C by a heating pad. The parietal and occipital bones were exposed, and a metal post for positioning the head was attached to the skull using dental acrylic. The parietal bone overlying left barrel cortex was thinned with a dental drill until transparent and a craniotomy was made over a thin region of skull (0.5 × 0.5 mm; centered 2.5 mm posterior to bregma and 5.5 mm lateral of the midline). The barrel field was mapped using glass pipettes with tips of ∼5 μm inside diameter (ID) filled with artificial CSF (aCSF) containing the following (in mm): 135 NaCl, 5.4 KCl, 1.8 CaCl2, 1.0 MgCl2, and 5.0 HEPES, pH 7.2, and inserted vertically to a microdrive depth of ∼700 μm. Signals were amplified, band-pass filtered at 0.3–9 kHz and played over an audio monitor. Whiskers were deflected manually using hand-held probes to determine the principal whisker corresponding to any given penetration.
Juxtasomal pipettes with tip ID of ∼0.5 μm were pulled from 2 mm filamented borosilicate glass. Pipettes were tip filled with aCSF containing 2% biocytin and inserted perpendicular to the pia. After a single-cell recording was established, square current pulses (1–3 nA, 250 ms on, 250 ms off) were passed for several minutes. One to 2 h were usually allowed to elapse before perfusion.
Electrophysiology.
Rats were prepared as in Cell filling above. Patch pipettes were pulled from 2 mm filamented borosilicate glass. Tip ID was ∼0.75 μm. Pipettes were tip filled with the following (in mm): 135 K-gluconate, 10 HEPES, 10 phosphocreatine-Na2, 4 KCl, 4 ATP-Mg, and 0.3 GTP, along with 0.2% biocytin, pH 7.2. Cells were searched for in voltage-clamp mode. Whole-cell recordings were made under current clamp using a MultiClamp 700B (Molecular Devices) for 20–60 min and digitized at 32 kHz. Pipette capacitance was neutralized immediately after break-in. Seal resistance was >1 GΩ, series resistance 11–60 MΩ, and spike height and overall Vm were stable throughout the recording. Series resistance was monitored after every trial and the bridge balance was adjusted accordingly. No holding current was applied. Mean input resistance was 96.4 MΩ ± 49.6 SD and individual recordings exhibited constant input resistance even when the anesthetic level was varied between very light (persistent “up state”) and very deep (persistent “down state”).
Custom LabVIEW software was used to acquire data and to inject current waveforms. We electrically stimulated fibers in the intact preparation by positioning our recording and stimulating electrodes as in acute slice experiments. A bipolar concentric platinum/iridium electrode (∼500 kΩ impedance, 125 and 12.5 μm outer and inner pole diameters, 45° bevel FHC) was inserted vertically into the brain. Stimulus pulses (100 μs, 2–9 V) were delivered using an A395 linear stimulus isolator (World Precision Instruments) in constant voltage mode (Rshunt = 10 KΩ). Stimulus intensity was randomized across trials to minimize effects due to potential changes in recording conditions or animal state.
The placement of the stimulation electrode relative to the center of the barrel column was determined using trigonometry. Cortical fibers were activated antidromically by stimulating in L2/3, 300–350 μm below the pia and slightly (100–150 μm) caudal or rostral relative to the recording electrode to minimize the risk of collision. Thalamic fibers were stimulated by placing the bipolar electrode in the white matter ∼2000 μm below the pia along the radial axis. Although white matter stimulation is not guaranteed to activate thalamic fibers exclusively, our protocol is subject to this confound in equal measure as the in vitro protocol that it replicates. Placement was optimized by advancing the stimulation electrode while simultaneously applying electrical pulses and recording the resulting field EPSPs (fEPSPs) in the barrel. Electrolytic lesions were produced using 10 μA of DC current for 10 s after completion of all recordings.
During minimal stimulation, anesthesia was maintained at deep levels to minimize thalamic firing, cortical “up states,” and other spontaneous synaptic inputs. The criteria for minimal stimulation were as described previously (Gil et al., 1999): (1) all-or-none synaptic events, (2) little or no variation in EPSP latencies, (3) a small change in the stimulus intensity did not change the mean size or shape of the EPSP, and (4) lowering stimulus intensities by 10–20% resulted in complete failure to evoke EPSPs. We excluded from analysis any EPSPs with time courses that were not monophasic (presumably a mixture of monosynaptic and polysynaptic EPSPs) and/or with latencies that exceeded 4.2 ms. The membrane potential of the recorded cells just prior (5 ms before stimulation) to the measurement of minimal stimulation EPSPs was −72.4 ± 3.8 mV (mean ± SD).
Most analyzed cells were confirmed histologically as L4 excitatory barrel neurons. Three unrecovered cells were classified as L4 excitatory barrel neurons based on the microdrive reading (between 786 and 818 μm below the pia), their intrinsic membrane properties (regular spiking and the absence of “sag” during hyperpolarizing current injection), and receptive field properties (strong depolarization response to stimulating one whisker and negligible depolarization to neighboring whiskers). Physiological data were analyzed using custom-written routines in MATLAB (MathWorks).
Optogenetics.
To photoactivate VPM fibers, we injected VPM (as in Virus injections above) with a virus to express of a ChR2-mCherry fusion protein driven by the CAG promoter [AAV1.CAG.hChR2(H134R)-mCherry.WPRE.SV40; Penn Vector]. VPM was physiologically mapped, and volumes of 60–80 nl were injected over ∼20 min using a Nanoject II auto-nanoliter injector (Drummond). The craniotomies were covered with bone wax after injection and the incision closed with absorbable sutures. Animals were allowed to recover from surgery in a clean cage with softened food pellets and water overnight before returning to their home cage.
These injections were performed in female ∼70–100 g rats. After housing the animals for ∼3 weeks, surgeries for physiology experiments were performed as in Electrophysiology above (140–226 g). Light activation of infected fibers was achieved by placing a 200 μm fiber optic immediately above the craniotomy and delivering 2 ms pulses of 473 nm light using a DPSS laser (OEM; 1.25–3.22 mW output from fiber) controlled by a mechanical shutter. Trials including light pulses were interleaved with control trials.
Immunohistochemistry for light microscopy.
Vesicular glutamate transporter 2 (VGluT2) protein labels thalamic, but not cortical, terminals in L4. Lesioning thalamus depletes VGluT2 immunoreactivity in cortex (Fujiyama et al., 2001). In situ hybridization reveals dense VGluT2 expression in thalamus, but little or no VGluT2 mRNA in somatosensory cortex except in a subset of L3 cells (Graziano et al., 2008), which generally do not establish synapses in L4 (Bruno et al., 2009; Lefort et al., 2009).
All reagents were dissolved in 0.1 m phosphate buffer (PB) unless otherwise noted. The rat was perfused transcardially with cold 0.1 m PB followed by 4% paraformaldehyde (PFA). The brain was incubated overnight in 4% PFA at 4°C and then cryoprotected using 30% sucrose. Barrel cortex was cut tangentially in 50 μm sections on a freezing microtome (HM 450; Microm). Floating sections were incubated in 1 mg/ml NaBH4 for 7 min to reduce autofluorescence, and then blocked in 5% normal goat serum (NGS) and 1% Triton X-100, with rocking at room temperature. Rabbit anti-VGluT2 primary antibodies (1:2000 dilution; Synaptic Systems) and streptavidin-conjugated Alexa Fluor 488/594 (1:1000 dilution; Invitrogen) were incubated for 12–18 h in 1% NGS and 1% Triton X-100 with rocking at 4°C. Goat anti-rabbit secondary antibodies conjugated to Alexa Fluor 488 or Alexa Fluor 594 (1:200 dilution; Invitrogen) were incubated for 2–4 h in 1% NGS and 1% Triton X-100 with rocking at room temperature. Sections were then mounted onto glass slides under coverslip in SlowFade Gold (Invitrogen).
Fluorescence microscopy and reconstruction.
Epifluorescence images were obtained using an Olympus BX-51 upright microscope equipped with 4×, 10×, and 20× air objectives [0.13, 0.3, and 0.5 numerical aperture (NA), respectively]. High-resolution confocal image stacks were acquired using a Leica TCS SP2 or SP5 laser scanning microscope with 488 nm (EGFP/Alexa Fluor 488) and 543 nm (Alexa Fluor 594) excitation wavelengths, a 63× 1.3 NA glycerol objective with 5× digital zoom, a pinhole of 1 Airy unit, and significant oversampling (voxel dimensions: 48.1 nm length × 48.1 nm width × 136.4 nm depth; 16-bit per channel; image planes 512 × 128, 512 × 256, or 512 × 512 pixels depending on the region of interest). The objective correction collar was set by maximizing the reflection of the laser off the slide. Signal-to-noise ratio was improved by 4× line averaging. Neighboring stacks were set to overlap by ∼5 μm to facilitate registration. Stacks were deconvolved using Huygens (Scientific Volume Imaging).
Confocal microscopy can achieve spatial resolution of ∼1/4 of the excitation wavelength and, with deconvolution, ∼1/10 (Hell et al., 1997). Our system, albeit not configured to this degree, was highly optimized. After deconvolution, it was possible to resolve light microscopy (LM) structures on the order of 0.1 μm—as, for example, the thin portion of an axon terminal shown in Fig. 3C (green), the morphology of which was confirmed when subsequently visualized under EM (see Fig. 3D, green arrow). We checked our spatial resolution by imaging 0.175-μm-diameter fluorescent beads (PS-Speck 505/515; Invitrogen) and measuring their lateral profiles, which had a full width at half-maximum of 0.305 μm before deconvolution and 0.193 μm after.
Figure 3.
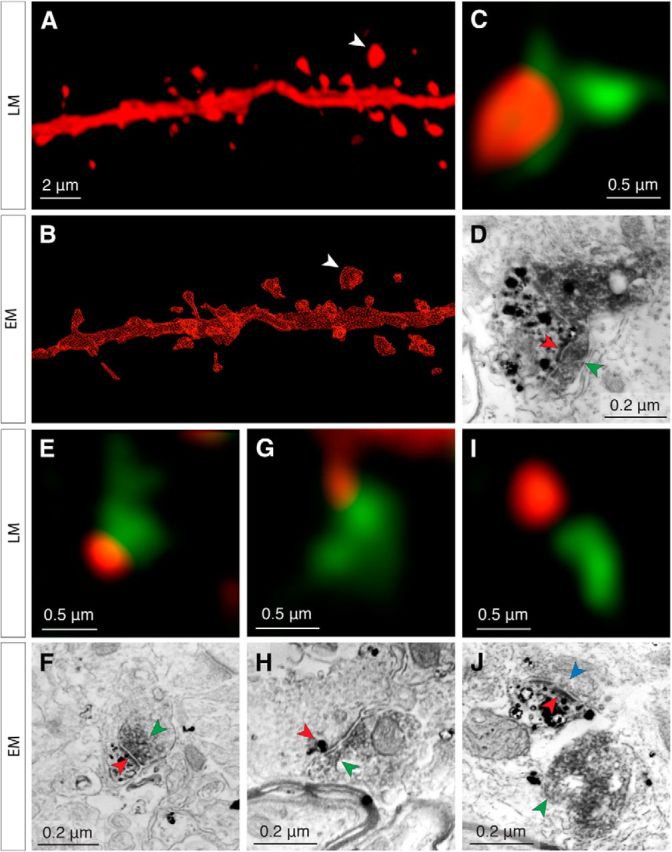
Reliable detection of putative TC contacts at the light level. The same spines are examined both in confocal microscopy stacks (A) and in subsequent reconstructions of 70 nm serial sections imaged by SEM (B). C–D, Example of a true positive (confirmed TC contact), the spine of which is indicated by the white arrowheads in A and B. Under confocal microscopy (C), the spine (red fluorescence) apposes a VGluT2+ vesicle pool (green fluorescence). The corresponding ultrastructure (D) reveals the spine (black punctate stain) with its PSD (red arrowheads) apposed to a VGluT2+ vesicle pool (dark gray diffuse stain, green arrowheads). E–J, Examples of a true positive, false positive and true negative from different areas of the same dendrite shown in A and B. E, F, True positive, legend same as for C and D. G, H, False positive. The 70 nm section (H) in which the labeled spine (black punctate stain, red arrowhead) is closest to the VGluT2+ vesicle pool (green arrowhead) does not contain a PSD and no synapse is formed between both labeled structures. The labeled spine's PSD is located in a different section and does not contact the VGluT2+ vesicle pool. Note that this ultrathin section contains only a small, terminal portion of the spine. I, J, True negative. Nearby, but nonapposed presynaptic and postsynaptic structures visualized under confocal microscopy (green, red fluorescence in I) are separated by ∼50 nm. This spine fails to satisfy the criteria for putative TC contacts; examination under SEM confirms that this is not a synapse (green arrowhead in J corresponds to the VGluT2+ vesicle pool in green fluorescence in I). The labeled spine head (black punctate stain, red arrowhead indicates PSD) forms a synapse with a separate terminal containing a VGluT2− vesicle pool (blue arrowhead).
Individual image stacks were imported into Neurolucida (MBF Biosciences) for reconstruction after optimizing the dynamic range of each channel. Somata and dendrites were traced in 3 dimensions through the stack (including dendrite thickness for the volumetric reconstruction of cell 6) and each spine was examined for apposition to a VGluT2 or synaptophysin-EGFP punctum. Dendritic spines that either partially overlapped or were in direct contact with a punctum were scored as TC. Spines that were not, including spines that were very near puncta but for which there was no signal between the borders of the spine and the VGluT2 punctum (see Fig. 3I), were scored as CC. Reconstructed segments were spliced together with care to prevent any double scoring of spines arising due to the overlap between neighboring image stacks. With lower-magnification images of the dendritic arbor as a reference, the spliced reconstructions of consecutive 50 μm sections were themselves spliced together, revealing the neuron's complete dendritic arbor. This final splicing step revealed that this method suffers negligible tissue loss due to sectioning, because the dendrite reconstructions across consecutive sections matched up with virtually no interruption.
Anatomy data were analyzed using Neurolucida and custom-written routines in MATLAB. Spatial biases of TC and CC synapse distributions were statistically tested by logistical (sigmoidal) regression. Specifically, the binary identity (TC or CC) of each synapse was regressed against its distance from the soma along the dendrite. Statistical significance of clustering was tested by Monte Carlo simulation: spines were randomly assigned to be TC or CC using the logistic fit, which gives the probability of a given spine being TC as a function of its distance from the soma. For each cell, 5000 simulations were run and its p-value was obtained by calculating the number of simulations with median spacings between TC synapses that were less than its measured median spacing.
Correlative LM-EM protocol.
All reagents were dissolved in 0.1 m sodium phosphate buffer unless otherwise noted. After a cell was filled, the rat was perfused transcardially with cold 0.1 m PB buffer followed by 2% PFA and 0.75% glutaraldehyde (Electron Microscopy Sciences) in PB. The brain was incubated overnight in 4% PFA at 4°C and cryoprotected using 30% sucrose. The brain was frozen in a −80°C freezer for 20 min to fracture membranes rather than permeabilizing sections. Cortex was cut tangentially in 25 μm sections on a freezing microtome. Floating sections were incubated in 1 mg/ml NaBH4 for 7 min to reduce autofluorescence, in 3% H2O2 for 30 min to quench endogenous peroxidases, and blocked in 5% NGS for 1–2 h at room temperature. Rabbit anti-VGluT2 primary antibodies (1:2000 dilution; Synaptic Systems) and a Nanogold-streptavidin-conjugated Alexa Fluor 488 (1:100 dilution; Nanoprobes) were incubated for 12–18 h in 1% NGS with rocking at 4°C. The primary antibodies were then reacted simultaneously with goat anti-rabbit secondary antibodies conjugated to Alexa Fluor 594 (1:200 dilution; Invitrogen) and horseradish peroxidase (HRP; 1:8.3 dilution; Invitrogen) for 12–18 h with rocking at 4°C. Sections were stored in 0.1 m buffer at 4°C during light imaging (1–3 d). For imaging, individual sections were trimmed (1 × 1 mm), mounted onto glass slides under coverslip in SlowFade Gold (Invitrogen), imaged under confocal microscopy as above, and then immediately unmounted and washed thoroughly. SlowFade Gold mounting medium slightly reduced HRP reactivity, so the amount of time that the sections were mounted was kept to a minimum (1–4 h).
Presynaptic and postsynaptic markers were labeled for scanning electron microscopy (SEM) by incubating sections in 50 mm glycine (3 × 10 min) and 1% bovine serum albumin (3 ×10 min), followed by washes in distilled H2O (3 × 10 min). The Nanogold particles (in the dendrite) were enhanced using an HQ Silver enhancement kit (Nanoprobes) for 6–13 min with rocking at room temperature covered in aluminum foil, and then washed thoroughly in distilled H2O. After transferring the sections back to buffer, HRP (at the VGluT2+ terminals) was reacted with a freshly made solution of 1.5 mg/ml diaminobenzidine (Dako) and 0.01% H2O2 for 20 min with rocking at room temperature covered in aluminum foil and then washed thoroughly.
To render cytoplasmic membranes electron dense, the 25 μm sections were reacted in PBS (0.1 m) buffer containing 0.5% osmium and 1.5% K3[Fe(CN)6] (EMS) for 20 min with rocking at room temperature. No uranyl acetate was used to prevent washout of the enhanced silver signal. Sections were dehydrated in ethanol grades of 50%, 70%, 95% (all 1 × 40 s), and 100% (2 × 40 s) in a microwave (3451 system, with cold spot; Pelco). Dehydrated tissue was immediately infiltrated in a 1:1 mix of epoxy embedding resin mixture (Epox 812; Fullam) and ethanol for 15 min in the microwave, then in 100% resin mixture (2 × 15 min fresh each time) in the microwave. Specimens were mounted between two plastic slides with resin mixture and polymerized overnight at 60°C.
The next day, the polymerized wafers were separated from the plastic slides and regions of interest were observed and photographed. They were then cut from the section and remounted on a small drop of resin mixture on a blank BEEM capsule block, placed in a spring tension apparatus, and placed in the oven at 60°C for 18–24 h. Once polymerized, the block face was trimmed down (∼2 mm side). Seven micrometer sections were cut with a diamond histo-knife on an ultramicrotome and ordered in water drops on a glass slide. Sections were transferred to 95% ethanol in a glass multiwell dish for 1–2 m to flatten and reduce wrinkles, ordered on a clean glass slide, and coverslipped in immersion oil.
Regions of interest on the 7 μm sections were photographed on a light microscope with phase optics to map orientation in the electron microscope. The coverslip was gently removed and sections chosen for ultrathin sectioning were individually washed in 95% ethanol 3× for ∼15 s to remove immersion oil. A section was positioned on a small drop of resin mixture on a faced-off blank BEEM capsule block and placed in the spring tension apparatus. A plastic slide was stacked with two glass slides (plastic slide on bottom) and secured in the apparatus. Each block was slowly raised up toward the plastic slide by releasing the spring so that the section was held perfectly flat to the plastic slide with slight tension. The apparatus was then placed in the oven at 60°C for 18–24 h.
Serial ultrathin 70 nm sections were cut using a UC6 Ultramicrotome (Leica) equipped with a 45° diamond knife (Diatome). The ultrathin sections were collected onto Kapton tape using ATUM (Hayworth et al., 2006) and placed on a silicon wafer (UniversityWafer). Sections were stained for 30 s with lead citrate (Leica) and coated with a thin layer of carbon (<10 nm).
A field emission microscope (Sigma, Zeiss) was used to acquire SEM images (10 kV, 60 μm aperture, 5.4 mm working distance). Volumetric reconstructions were traced in TrakEM2 (Cardona et al., 2012) from image stacks of several hundred planes (197 × 197 μm side, 12 nm pixel, “low magnification”). These were compared with the previously acquired confocal image stacks, visualized using FIJI software, allowing registration of individual spines across both imaging modalities. Although the tissue's ultrastructure was resolvable in low-magnification image planes, higher-magnification image stacks (4.1 × 4.1 μm side, 2 nm pixel, “high magnification”) were acquired around spines putatively identified in the light to be TC. 3D renderings of the volumetric tracings were produced using 3ds Max (Autodesk).
Compartmental model.
A compartmental model was built in NEURON from the volumetric reconstruction of the dendrites of cell 6; the soma was modeled as a cylinder with a volume equal to that of the cell. The average in vivo membrane potential response to 150 presentations of a pink noise (300 Hz cutoff) current was used to fit three biophysical parameters in the model: specific membrane resistance (Rm = 6357.8 Ωcm2), specific membrane capacitance (Cm = 2.967 μF/cm2), and specific axial resistance (Ri = 501 Ωcm). These Rm and Cm values reflect that spines were not explicitly modeled. The model cell's DC input resistance was 146.5 MΩ and its time constant was 13.8 ms. We also tested Ri = 105 Ωcm (Nevian et al., 2007).
An α synaptic conductance function was determined based on unitary CC synapse properties (EPSP peak, rise time, and decay time constant) measured from connected pairs in vitro (Feldmeyer et al., 1999): time to peak (tau = 0.7 ms), maximum conductance (gmax = 0.6 nS), reversal potential (e = 0 mV). That conductance was applied at each of the 743 TC and 4154 CC observed spine locations observed in the neuron's dendritic arbor, and the resulting simulated voltage change was recorded at the model's soma. The resulting simulated EPSP data were analyzed using custom-written routines in MATLAB.
Results
Identification of putative synapses by light microscopy
Excitatory L4 barrel neurons receive glutamatergic synapses from primary, but not secondary, thalamic nuclei (Wimmer et al., 2010); from other L4 cells; and from a very small number of L6 cells (Stratford et al., 1996; Feldmeyer, 2012). To map the distribution of cortical and thalamic synapses onto L4 neurons, we identified presynaptic and postsynaptic structures by selectively labeling the synaptic terminals of neurons residing in the ventral posteromedial nucleus of thalamus (VPM; Fig. 1A–C, green) and the dendrites of single excitatory neurons in L4 of somatosensory cortex (Fig. 1B,C, red). Cortical neurons were juxtasomally filled with biocytin; thalamic axon terminals were labeled by either expressing a synaptophysin-EGFP fusion protein encoded by an AAV injected into VPM (85–95% infection efficiency) or immunostaining VGluT2, which is located at thalamic, but not cortical, terminals in L4 (Fujiyama et al., 2001; Graziano et al., 2008; Coleman et al., 2010; and see Materials and Methods). Using either approach, the clustering of thalamic axons into discrete barrels was clear in tangential sections of somatosensory cortex (Fig. 1B,C, green) and synaptic staining was sparsely punctate under high magnification (synaptophysin-EGFP: Fig. 1G–I; VGluT2: Fig. 1J).
Figure 1.
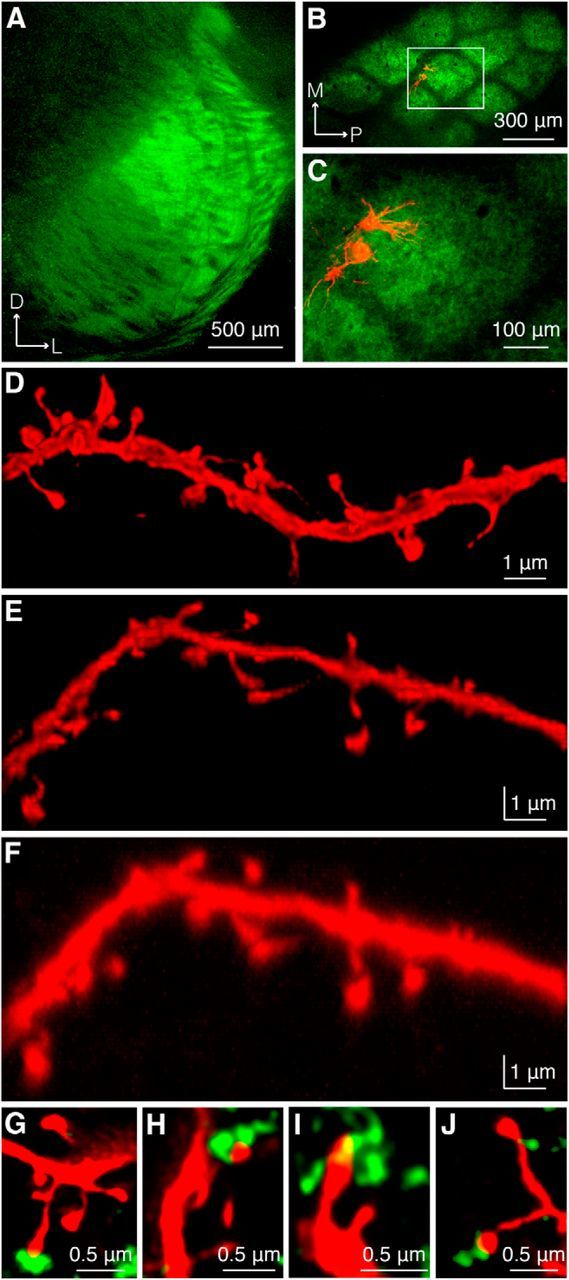
Confocal microscopy reveals putative TC contacts. A, Expression of synaptophysin-EGFP in VPM after AAV injection. B, C, Two excitatory neurons in L4 of somatosensory cortex juxtasomally filled with biocytin visualized under epifluorescence microscopy. Red, Biocytin-filled cells labeled with Alexa Fluor 594-conjugated streptavidin; green, synaptophysin-EGFP. C, Higher-magnification view of the region outlined in B. D, z projection of dendritic segment after confocal imaging and deconvolution demonstrates adequate x and y resolution to distinguish spine heads and spine necks. E, y projection of the same image stack illustrating z resolution. F, y projection of same image stack before deconvolution. G–J, Examples of a subset of spines apposed to markers for presynaptic vesicle pools in TC boutons. Green in G–I, synaptophysin-EGFP; in J, anti-VGluT2.
To comprehensively map synaptic contacts onto the cortical neuron, it was necessary to reconstruct the neuron's entire dendritic arbor. We used high-magnification confocal microscopy and deconvolution (see Materials and Methods) to acquire image stacks of dendritic arbors of filled neurons. Deconvolution of high-resolution, oversampled confocal stacks can partially mitigate the blurring due to the imaging system's point spread function (Hell et al., 1997; Conchello and Lichtman, 2005). Resolution in the x and y dimensions (Fig. 1D) and the z dimension (Fig. 1E) was sufficient to clearly identify dendritic spines, especially after deconvolution (deconvolved: Fig. 1E; raw: Fig. 1F). We established the following criteria to distinguish TC from CC synapses: those spines that directly apposed a VGluT2+ thalamic terminal were classified as TC (Fig. 1G–J) and those spines that did not appose a labeled terminal were classified as receiving CC inputs. This method allowed us to map putative excitatory synaptic inputs across the entire dendritic tree using light microscopy.
Most putative contacts are true synapses at EM level
To verify the reliability of our confocal method we developed a correlative LM and EM strategy to determine the fraction of TC contacts identified by LM that are true synapses at the ultrastructural level. To maximize the contrast of the electron-dense stain while still retaining sufficient ultrastructure to reveal postsynaptic densities (PSDs) and vesicle pools, we designed our staining protocol such that the intensities of the presynaptic and postsynaptic structures could be calibrated independently of one another. The biocytin-filled dendrite was visualized using an Alexa Fluor-Nanogold-streptavidin conjugate, ensuring that a fluorescent molecule detectable under LM would yield a corresponding EM signal after silver enhancement of its conjugated gold particle. To label VGluT2+ thalamic neuron terminals across both imaging modes, we simultaneously reacted two secondary antibodies against the anti-VGluT2 primary—one conjugated to a fluorophore and the other conjugated to HRP.
After imaging both dendrite and thalamic terminals under high-magnification confocal microscopy, we deconvolved the image stacks and scored spines as putative TC or CC. Those structures were then rendered electron dense by silver enhancement of Nanogold particles for dendrites (Fig. 2A) and DAB polymerization for VGluT2+ vesicle pools, resulting in a subset of intensified boutons (Fig. 2C, green arrow). EM visualization of the filled dendrites revealed a punctate staining pattern throughout the dendritic shaft, spine heads, and spine necks, but absent within mitochondria. Because of the punctate, rather than diffuse, nature of the dendrite staining method, PSDs were clearly visible (Fig. 2C).
Figure 2.

Dendrite labeling in LM and EM. A, SEM photomicrographs of three consecutive 70 nm ultrathin sections obtained at low magnification (12 nm/pixel) reveal punctate staining of the dendrite labeled with an Alexa Fluor-Nanogold-streptavidin triple-conjugate. The dendrite shaft, spine heads, and spine necks are clearly labeled, but a large mitochondrion remains unlabeled, implying that biotin did not penetrate this organelle during the neuron's filling. B, Single LM plane (equal in thickness to several consecutive ultrathin sections) that corresponds approximately to the same area of dendrite shown in A. Deconvolution permits distinction between the dendrite's biotin-filled cytoplasm and its unfilled mitochondrion. This photomicrograph is an x, y, z cropping of the dendrite shown in Figure 3A. C, High-magnification (2 nm/pixel) SEM photomicrograph showing a peroxidase-labeled VGluT2+ vesicle pool (green arrowhead, dark gray diffuse stain) apposed to a silver-enhanced Nanogold-labeled spine (black punctate stain) containing a PSD (red arrowhead); this contrasts with an unlabeled VGluT2− vesicle pool (blue arrowhead) apposed to an unlabeled spine containing a PSD (yellow arrowhead). This photomicrograph shows a larger field of view surrounding the spine/vesicle pool shown in Figure 3F.
Using anatomical landmarks, it was possible to register dendrites across both LM and EM imaging modalities (Fig. 2A,B). We examined dendritic segments chosen at random throughout the neuron's arbor, reconstructing them from ultrathin 70 nm serial sections and matching individual spines across both imaging modalities (Fig. 3A,B). We confirmed that high-resolution LM can reliably detect spines: in only one case of 219 registered spines, a spine that had been scored as unitary under LM was revealed to have two spine heads under EM.
To determine whether putative LM contacts possessed the requisite ultrastructural features of true synapses, VGluT2+ spines were reimaged at higher EM magnification. We defined true positives as putative TC spines in LM with PSDs that were apposed to a VGluT2+ vesicle pool when observed under EM (Fig. 3C–F). We defined false positives as putative TC spines in LM with PSDs that were not apposed to a nearby VGluT2+ vesicle pool when observed under EM (Fig. 3G,H). In addition, we examined three spines that did not meet the criteria for putative TC contacts in LM, but that were located near (<75 nm from) VGluT2+ puncta (Fig. 3I,J), none of which were found to be TC synapses under EM.
In total, we performed correlative microscopy on seven segments of dendrite, containing 219 spines, 23 of which were determined to be putative TC synapses in LM (10.5%). Subsequent imaging under EM permitted examination of 16 of those putative TC synapses, of which 14 (87.5%) were determined to be true positives and two false positives. We conclude that our LM strategy produces reliable maps of axospinous synapses.
Spatial pattern of TC synapses
We reconstructed the complete dendritic arbors, colabeled with synaptophysin-EGFP or VGluT2, of six spiny L4 neurons in somatosensory cortex (Fig. 4), scoring each spine as TC or CC (n = 17863 spines). Neurons were randomly sampled with regard to location within the barrel (Fig. 5). Our sample contains three spiny stellate neurons and three star pyramid neurons, including one in which the soma was located in the septum between neighboring barrels (cell 1). We included this septal neuron in our analyses because it had significant portions of its dendritic tree inside the barrel and exhibited several microanatomical properties similar to that of the five barrel neurons (see remaining paragraphs of this section).
Figure 4.

Complete synaptic distribution of an L4 spiny stellate neuron. Shown is a high-resolution 3D reconstruction of a spiny stellate neuron illustrating individual spines apposed to synaptophysin-EGFP signal, denoted as TC (filled green circles) and unapposed spines assumed to be CC (empty red circles). This cell corresponds to cell 3 in Figure 6A.
Figure 5.

Locations of somata and dendritic arbors relative to barrel borders. The six fully reconstructed cells are depicted relative to their barrel's borders. Black, barrel borders; red, somata; gray, dendritic arbors. Cell 1, the soma of which was located in the septum, is represented alongside its neighboring barrels. Note that cell 4 and cell 5 were located in the same barrel.
Of the 2056–4897 spines examined per cell (mean 2977), between 5.92% and 15.2% (mean 9.98 ± 3.64% SD; 10.5 ± 3.79% SD excluding the septal neuron) were scored as TC (Fig. 6A), which is consistent with previous EM estimates using short dendritic segments (Benshalom and White, 1986). The fraction of TC spines on the apical dendrites of star pyramids (cell 1: 5.9%; cell 2: 8.3%; cell 3: 11%) did not differ markedly from the fraction of TC spines in the complete dendritic arbors of those cells. Qualitatively, presynaptic and postsynaptic structures involving TC synapses appeared to vary widely in size (Fig. 3D,F), which is consistent with EM studies reporting that TC terminals have a larger range of sizes than CC synapses (Kharazia and Weinberg, 1994; Nahmani and Erisir, 2005).
Figure 6.

TC contacts are slightly more proximal to the soma than CC contacts. A, Between 6% and 15% of contacts are TC in fully reconstructed dendritic arbors (stacked histogram: green, TC; red, CC; number, fraction of total spines that are TC; star, star pyramid, all others are spiny stellate; S, septal neuron, all others are barrel). B, Top, TC (green) and CC (red) spine density for one cell (cell 3, shown in Fig. 4). Bottom, Ratio of TC to CC spines declines as a function of distance from the cell soma. C, Average of all fully reconstructed cells. Error bars indicate SE. D, Spines in cell 6 were classified as mushroom (left), stubby (middle), or filopodium (right); diagram is denoted on the x-axis. The fraction of TC contacts was approximately equal across all three classes of spines (legend same as in A).
Dendritic shaft contacts, which have substantially larger surface areas than spines and lack discrete anatomical features at the scale of the synapse (i.e., a spine head), are unlikely to be accurately identified by our LM method. Indeed, in one cell (cell 6) we quantified by LM the number of VGluT2+ puncta that overlapped or apposed dendritic shafts, finding that they formed 15.7% of all TC contacts (138 of 881 contacts), which is substantially higher than previous EM estimates of 3.8% (3 of 79) of TC-shaft contacts (Benshalom and White, 1986). This contrasts with the consistency of our LM estimate of axospinous synapses with previous EM studies. Putative shaft contacts were therefore excluded from analysis.
Do spines receive TC synapses more proximal to the soma than those receiving CC synapses? The number of both TC and CC spines varied considerably with distance from the soma (median of 218 TC spines = 81.6 μm; median of 1838 CC spines = 96.2 μm, or 17.9% more distal; p < 10−5, Wilcoxon signed-rank test; Fig. 6B, top). We did not observe a significant difference in the median distance of putative TC shaft contacts versus TC spine contacts (cell 6, median of 743 TC spines = 59.4 μm; median of 141 TC shaft contacts = 60.0 μm, or 1.01% more distal; p = 0.8, Wilcoxon signed-rank test).
The distribution of the total number of spines was factored out by quantifying the TC/CC ratio (Fig. 6B, bottom). In 5 of 6 cells, the probability of observing a TC spine decreased with distance from the soma; in 4 of 6 cells, this relationship was highly significant (p = 0.003, 0.33, 3 × 10⁻⁶, 0.80, 0.003, 2 × 10⁻⁹, n = 3490, 2132, 2056, 2955, 2333, 4897, logistic regression for cells 1–6, respectively). Considering the spine data from all six cells, TC spines were significantly more proximal to the soma on average (p < 10−29, n = 17863, logistic regression; Fig. 6C). For the five barrel neurons, we measured the horizontal distance of 14,373 spines to the barrel center, but found no significant relationship between distance from center and the probability of a spine receiving a TC synapse (logistic regression). Spines near the barrel center are therefore not more likely to be TC than spines near the barrel edge. We conclude that TC synapses exhibit a significant spatial bias toward the soma.
In a reconstruction comprised of 4897 spines (Fig. 6A, cell 6), we classified each spine morphology as mushroom, stubby, or filopodium (Peters and Kaiserman-Abramof, 1970). We found that TC contacts did not form preferentially onto any of the three spine classes (Fig. 6D; stacked histogram; green: TC, red: CC).
Visual inspection of our reconstructions suggested potential clustering of TC spines (Fig. 7A). Clustering of closely spaced synapses from a highly synchronous population of cells, such as thalamic neurons (Alonso et al., 1996; Roy and Alloway, 2001; Temereanca and Simons, 2003; Bruno and Sakmann, 2006; Wang et al., 2010), would be an effective means to trigger dendritic spikes (Nevian et al., 2007; Lavzin et al., 2012). To investigate this, we measured the distances between pairs of neighboring TC spines and compared this distribution with one obtained by Monte Carlo simulation. We randomly assigned actual spine locations as TC or CC while preserving the spatial distribution of TC spines with respect to the soma. In each L4 cell, actual TC spines were more closely spaced than in the simulations (Fig. 7B). We tested for significant clustering in each cell by comparing the median inter-TC synapse distance in the real cell against the distribution of medians predicted by chance (Fig. 7C). The two barrel star pyramid neurons showed highly significant clustering (p = 0.0002, 0.002 for cells 4 and 6, respectively) and clustering was trend level for the septal star pyramid neuron (p = 0.06 for cell 1). None of the three barrel spiny stellate neurons, however, exhibited significant clustering (p = 0.54, 0.16, 0.14 for cells 2, 3 and 5, respectively). Removing the star pyramids' apical dendrites, which spiny stellates lack, did not appreciably alter p-values. These results indicate that TC synapses tend to cluster along dendrites, perhaps particularly for dendrites of pyramidal cell types.
Figure 7.
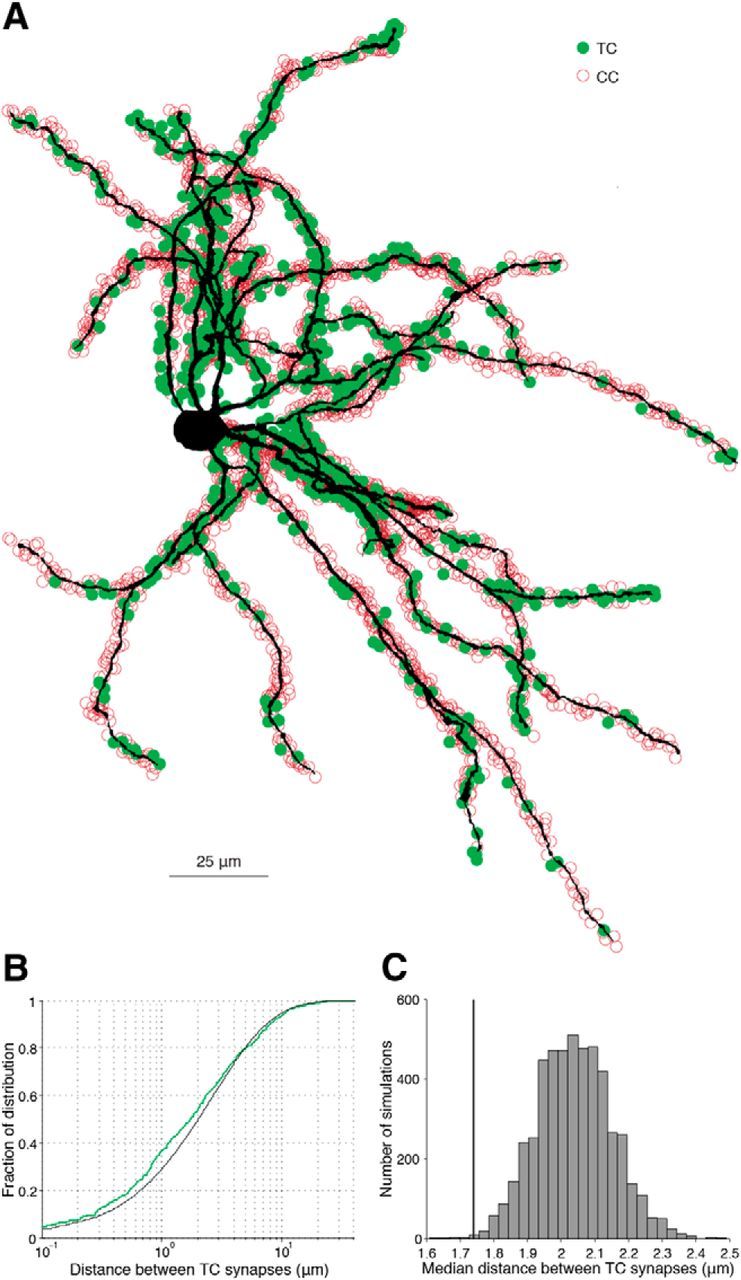
Clustering of TC synapses along the dendrites of an L4 star pyramid neuron. A, Volumetric reconstruction of a barrel neuron recorded and filled intracellularly (cell 6). B, Cumulative density of the distances between putative TC synapses in cell 6 (green) and mean of 5000 Monte Carlo simulations of TC synapses randomly placed along the dendrites using the measured somatic proximity function (black). C, Actual median spacing of TC synapses for this cell (line) compared with the distribution of the medians obtained by simulation (histogram).
Compartmental modeling predicts similar synaptic strengths
Our results indicate that, on average, TC synapses fall more proximally to the soma than CC synapses. The electrotonic compactness of these neurons will dictate whether this spatial configuration would cause TC inputs to depolarize the soma significantly more strongly than CC inputs. To investigate this, we constructed a detailed compartmental model using morphological and physiological parameters measured in vivo. A star pyramid was chosen because the dendritic arbor of this cell type is more extensive than that of a spiny stellate and should maximize any filtering effects. We reconstructed this cell's complete dendritic arbor, including its detailed volumetric characteristics, and scored its spines as TC or CC (Fig. 8A). Its TC spines were distributed more proximally than CC spines (median of 743 TC spines = 59.4 μm, median of 4154 CC spines = 65.8 μm or 10.8% more distal, p < 10−7, Wilcoxon signed-rank test).
Figure 8.
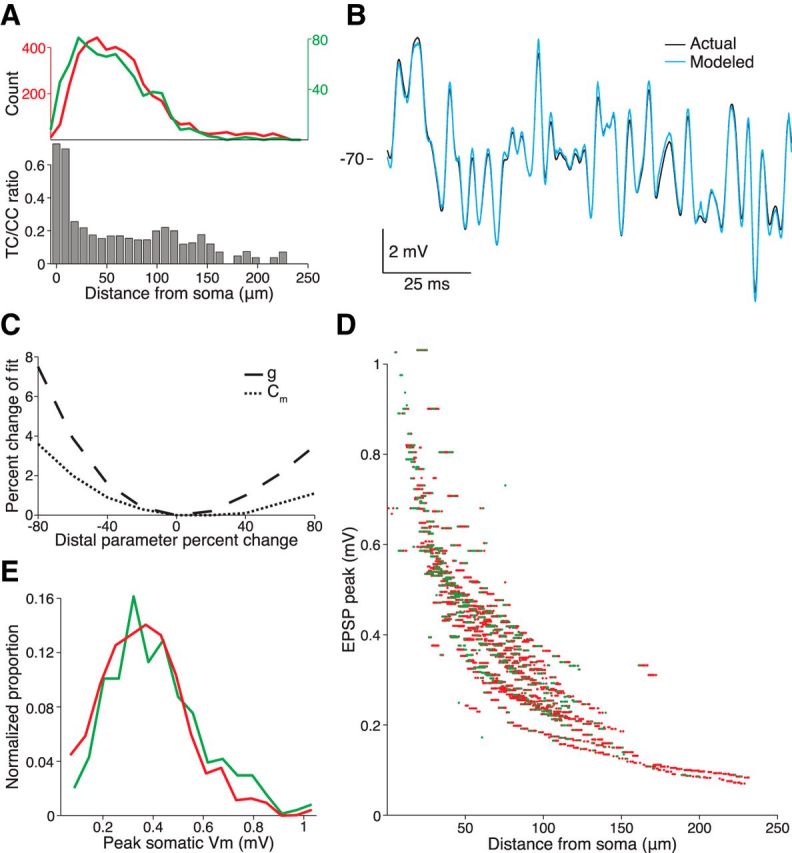
Compartmental model predicts that relative TC proximity to the soma does not render this class of inputs stronger. A, Top, TC (green) and CC (red) spine density for cell 6 (shown in Fig. 7A). Bottom, Ratio of TC to CC spines declines as a function of distance from the cell soma. B, Voltage responses of actual cell (black) to somatic injection of pink noise current and the fitted model (blue) to the same current injection. A compartmental model based on the volumetric morphology (shown in Fig. 7A) and the voltage response were used to constrain the fit of three biophysical parameters (axial resistance, specific conductance, and specific capacitance). C, Percent change in mean squared error (MSE) of the model's fit when varying the specific membrane conductance and capacitance (g and Cm, respectively) in four short, distal terminal dendrite segments of the cell's 48 segments. D, Individual EPSP peaks measured at the soma resulting from a synaptic conductance injected into the compartmental model at the 4154 CC and 743 TC spine locations (green and red, respectively). E, Distributions of simulated somatic EPSP peaks for the two classes of inputs shown in D.
Even with precise morphological measurements of the dendrites, the numerous possible combinations of biophysical parameter values (i.e., specific axial resistance, Ri, specific membrane resistance, Rm, and specific membrane capacitance, Cm) can yield models with drastically different passive filtering properties. We therefore fit the model by measuring the cell's impedance function—that is, the voltage response of the actual neuron in vivo recorded under the whole-cell configuration during an current injection of pink noise (300 Hz cutoff; Fig. 8B). The voltage response of the cell to the high-frequency components of the noise current is determined primarily by the soma and proximal dendrites, whereas a greater extent of the dendritic arbor contributes to the low-frequency components. The combined morphology and impedance measurements constrained the fit of Ri, Rm, and Cm to a narrow range. A five-parameter model with independent dendritic and somatic Rm and Cm variables did not fit the data appreciably better than the three-parameter model (data not shown). We verified that distal dendrites contribute to the model's impedance by varying specific membrane conductance or capacitance in four short, distal terminal dendrite segments of the model's 48 segments and measuring the resulting change in the mean squared error of the fit (Fig. 8C).
We then simulated a synaptic conductance at each spine location observed in the reconstruction, measuring the resulting voltage change at the soma (Fig. 8D). On average, the 743 simulated TC locations generated slightly higher amplitude EPSPs at the soma than the 4154 CC locations, but this difference was small (CC median 0.390 mV; TC median 0.418 mV or 7.3% stronger, p < 10−8, Wilcoxon signed-rank test; Fig. 8E). Simulations using a lower estimate of Ri obtained from dual dendritic recordings of L5 pyramidal basal dendrites (Nevian et al., 2007) resulted in an even smaller difference between TC and CC strength (CC median 0.422 mV; TC median 0.434 mV or 2.8% stronger, p < 10−8, Wilcoxon signed-rank test). Although active conductances could amplify these weak effects, the membranes of excitatory L4 neurons are largely passive (Stratford et al., 1996), in contrast to those of infragranular and supragranular pyramidal neurons.
We conclude that, despite the moderate relative proximity of TC synapses, L4 neurons are too electrotonically compact for the anatomical bias to explain the several-fold greater potency of TC inputs observed in vitro.
In vivo measurement of unitary TC and CC inputs
To test the model's prediction, we measured unitary TC and CC inputs in the living animal by adapting the “minimal stimulation” protocol developed for the acute slice preparation (Raastad et al., 1992; Stratford et al., 1996; Gil et al., 1999). To activate cortical axons originating from L4, we antidromically stimulated in L2/3 at a depth of 300–350 μm and 300–500 μm lateral of the barrel column. Electrical shock here activates L4 collaterals that arborize in this location (Egger et al., 2008), but not VPM axons, which typically do not arborize this superficially and horizontally distant to their target column (Oberlaender et al., 2012). Electrical shock in this location may activate axons originating from L2/3 and L5/6 cells, but these very rarely form synapses in L4 (Bruno et al., 2009; Lefort et al., 2009). To activate VPM fibers, we orthodromically stimulated in the white matter ∼2000 μm below the pia (Fig. 9A), centered on the barrel column, and finely adjusted the electrode depth to maximize the fEPSP response in L4. White matter shocks preferentially activate TC axons, which have lower stimulation thresholds than corticothalamic fibers. While additional types of infragranular neurons project through the white matter, their collaterals rarely synapse in L4 (Lefort et al., 2009).
Figure 9.

Electrical stimulation permits selective thalamic or cortical fiber activation. A, Thalamocortical sections of barrel cortex 3 weeks after injection of VPM with AAV expressing ChR2-mCherry. An electrolytic lesion (white cross) indicates the site of electrical stimulation. WM, White matter. B, Photoactivation of VPM terminals results in a pronounced negative field potential in L4. Black trace, Average of 50 trials without photoactivation; blue trace, average of 46 trials with photoactivation. Low-intensity electrical stimulation of the white matter (black arrowhead) follows 50 ms after a laser light pulse (blue arrowhead) and produces a comparatively weak fEPSP. Electrical stimulation artifacts are cropped for clarity. C, D, Average fEPSP (n = 40–48 trials per trace) in L4 evoked by electrical shock 50 ms after photoactivation of ChR2+ VPM presynaptic fibers (blue trace). Black trace, No prior photoactivation; black arrowhead, electrical shock onset. Insert, Configuration of the recording and stimulation electrodes in a coronal view of S1; ChR2+ fibers are indicated in blue. C, Electrical shock of white matter produces a fEPSP that is conditioned by prior (50 ms) photoactivation of VPM fibers (black vs blue traces). D, In the same animal, electrical shock of cortex L2/3 is not conditioned by prior photoactivation of VPM fibers. E, Percent change in fEPSP peak magnitude after photoactivation of VPM fibers. Left, Electrical shock in white matter; right, electrical shock in cortex L2/3 (magnitudes normalized to control amplitude); ctl, control condition (black traces in C, D); light, after photoactivation (blue traces in C, D). **p < 0.01, n.s. not significant; gray lines indicate individual animals; black lines indicate means.
To verify that electrical stimulation selectively activates thalamic or L4 axons, VPM was injected with a virus encoding Channelrhodopsin2 (Fig. 9A). We tested whether the L4 fEPSP produced by electrical shock of either white matter or L2/3 is conditioned by photoactivation of thalamic fibers 50 ms prior. Photoactivation resulted in pronounced negative field potentials one order of magnitude larger than the fEPSPs produced using low-intensity electrical stimulation (Fig. 9B). In all animals tested, prior photoactivation of VPM fibers strongly depressed the fEPSP elicited by shocking the white matter (n = 5, p = 0.0036, paired t test; Fig. 9C,E). We then sought to rule out the possibility that the observed conditioning is due to feedforward inhibition recruited by photoactivation and to confirm that electrical stimulation in L2/3 does not activate VPM axons. Photoactivating VPM axons just before L2/3 shocks had no effect on fEPSPs (n = 4, p = 0.47, paired t test; Fig. 9D,E). These results, together with the known anatomy, demonstrate that electrical stimulation of the white matter or L2/3 selectively activates TC axons or L4 axon collaterals, respectively.
We then measured unitary EPSPs during whole-cell current-clamp recordings from L4 excitatory neurons. Because of the small magnitude of unitary EPSPs, and to mitigate the effects of short-term depression due to spontaneous network activity, we maintained the preparation under deep anesthesia, thus abolishing “up states” and silencing thalamic activity (Friedberg et al., 1999; Bruno and Sakmann, 2006) and effectively maintaining the subthreshold potential of recorded neurons in a persistent “down state” exhibiting only rare spontaneous EPSPs. Under these conditions, action potentials were observed only during positive current injection. Occasional trials in which electrical stimulation coincided with spontaneous EPSPs were excluded from analysis.
Low-intensity stimulation resulted in all-or-none synaptic transmission in both TC inputs (Fig. 10A,B) and CC inputs (Fig. 10C,D). Failures in transmission were clearly differentiable from successes despite the somewhat noisy membrane potential in vivo (Fig. 10A,C). Slightly reducing stimulus intensity from the level that produced 50% successful transmission (2.55 V: Fig. 10B, arrow; 9.75 V: Fig. 10D, arrow) resulted in complete failure. Moreover, varying the stimulus intensity did not alter the size or shape of evoked EPSPs. We fit a double-Gaussian function to the bimodal distribution of EPSP amplitudes produced by all-or-none activity (Fig. 10B,D, right). Unitary EPSP size was calculated by subtracting the lower Gaussian's mean from the higher one, corresponding to those trials that resulted in successful synaptic transmission. The EPSP onset latency to stimulation, measured from the average of multiple trials, was 2.22 ± 0.63 ms SD for TC inputs (n = 11) and 3.21 ± 0.84 ms SD for CC inputs (n = 9), which is consistent with stimulation of monosynaptic inputs.
Figure 10.

Unitary TC and CC inputs are equally potent when measured in vivo. A, Somatic voltage recorded during 7 trials of a L4 spiny stellate neuron in response to a 2.55 V stimulus delivered to the white matter under the neuron's barrel column in an adult rat. The stimulus results in successful synaptic transmission 50% of the time. B, As the intensity of the stimulus is increased from 2 to 2.55 V (left), trials generated progressively more successes with relatively constant EPSP amplitude. Stimulus intensity was randomized during acquisition, but ordered in this plot for clarity. Zero (0) indicates no stimulus; arrowhead indicates the stimulus intensity used to obtain the traces shown in A. Histogram of the EPSP peak amplitude shows a bimodal distribution (right); black line indicates a fit using a double Gaussian function (μ1 = 0.004 mV, σ1 = 0.047 mV, μ2 = 1.00 mV, σ2 = 0.198 mV). C, D, Same as for A and B, but in a young animal, stimulating in L2/3. μ1 = 0.087 mV, σ1 = 0.102 mV, μ2 = 1.383 mV, σ2 = 0.091 mV. E, Paired pulses in white matter (20 Hz) reveal pronounced short-term depression (mean of 60 trials). F, Peak amplitudes of EPSPs evoked by paired pulses reveal dual successes of synaptic transmission (top right quadrant), dual failures (bottom left quadrant), a preponderance of successes on the first stimulus only (top left quadrant), or a minority of successes on the second stimulus only (top right quadrant). Black line indicates identity. G, EPSP2/EPSP1 ratio for paired pulses at 20 Hz (large circles: 10 Hz) recorded in adult (black) and juvenile (gray) rats. H, Summary of the unitary EPSP amplitudes recorded in adult (black) and juvenile (gray) rats. Lines indicate the means.
We tested short-term plasticity at these synapses using a paired-pulse protocol (Fig. 10E). EPSP strengths measured on individual trials revealed that the second pulse fails to result in synaptic transmission more often than the first, giving rise to a smaller average EPSP (Fig. 10F). When stimulating twice at either 10 or 20 Hz, 100% of TC inputs exhibited short-term depression on average (mean EPSP2 to EPSP1 ratio = 0.67 ± 0.23 SD, n = 11). In contrast, CC inputs showed a mix of short-term depression (56%) and facilitation (mean EPSP2 to EPSP1 ratio = 0.98, ± 0.31 SD, n = 9; Fig. 10G). Importantly, the strengths of unitary TC and CC inputs in vivo were approximately equivalent (TC EPSPs mean = 0.63 ± 0.10 mV SEM, n = 11; CC EPSPs mean = 0.66 ± 0.16 mV SEM, n = 9; p = 0.85, t test; Fig. 10H). Measurements in juvenile and adult animals did not differ significantly (Fig. 10H). Therefore, as predicted by the model and notwithstanding their difference in dendritic distribution, we conclude that TC synapses have no functional advantage over CC synapses.
Discussion
We performed a comparative study of the anatomy and physiology of TC and CC synapses to address how activity in the thalamus transmits signals to cortex despite controlling only one of 10 excitatory synaptic inputs. We found that, despite a subtle anatomical bias in their spatial distributions, TC and CC inputs influence the membrane potential of L4 barrel cortical neurons in approximately equal measure. This finding differs from prior comparative measurements performed in acute slices of cortex. We conclude that, because these two classes of synapses are equivalent in strength, a relatively high TC efficacy cannot account for the thalamus' strong influence exerted by the thalamus.
Constructing detailed, reliable synaptic input maps
To our knowledge, this is the first study to produce input maps of complete dendritic arbors at a single-synapse scale. The fraction of total spines on barrel neurons that received TC synapses (mean 10.5%) is consistent with transmission electron microscopy estimates from small segments of dendrites (16.6%; Benshalom and White, 1986). Ultrastructural examination of our putative light-level synaptic contacts indicates that 87% are true synapses. A false-positive rate of 13% is tolerable for a number of purposes, such as estimating a synapse type's total numbers or proximity along the dendrites to the soma. False positives could likely be further reduced by immunolabeling of additional proteins in PSDs and active zones (Chen et al., 2012). This might also allow extension of our approach to reliably identifying synapses onto dendritic shafts, such as the majority of synapses onto inhibitory neurons. Further improvement might be possible if super-resolution LM techniques such as stochastic optical reconstruction microscopy (Rust et al., 2006) could be adapted to permit large-volume (>300 × 300 × 300 μm) imaging at reasonable timescales. One promising avenue would be to apply deconvolution techniques to enhance the x–y spatial resolution of array tomography imaging (Wang and Smith, 2012), which already achieves high axial resolution by physical sectioning.
Previous correlative LM-EM studies have revealed that bright-field microscopy suffers from high (∼68%) false-positive rates (da Costa and Martin, 2011). The substantially lower false positive rate of our confocal method is likely due to: (1) selective labeling of only synaptic markers rather than the entire cytosolic volume of thalamic axons, dramatically reducing chance nonsynaptic contacts; (2) imaging by confocal microscopy, which has inherently higher spatial resolution than bright field; and (3) the use of linear deconvolution to reduce blurring caused by the point spread function of the imaging system.
Other methods to construct synapse-scale maps identify synapses functionally, rather than anatomically, such as by combining electrophysiology with two-photon calcium imaging in vitro (Richardson et al., 2009; Little and Carter, 2012). Although calcium imaging ensures the detection of functional synaptic contacts, it cannot map entire dendritic arbors due to the timescale of the protocol. Indeed, only a few synapses may be examined on a given dendritic arbor, thus limiting statistical power. In addition, the inferior resolution of two-photon microscopy compared with deconvolved confocal microscopy renders it more difficult to distinguish between spine types such as stubby and mushroom. Subcellular channelrhodopsin-assisted circuit mapping (sCRACM) has an ∼60 μm resolution (Petreanu et al., 2009), preventing detailed mapping at the level of individual spines. Clustering of synapses and subtle spatial biasing would be difficult to detect by sCRACM.
We used two strategies to label presynaptic structures of thalamic axon terminals: virus-mediated expression of a synaptophysin-EGFP fusion protein and immunolabeling of thalamic terminals in L4 by VGluT2 (Fujiyama et al., 2001; Nahmani and Erisir, 2005; Graziano et al., 2008; Coleman et al., 2010; and see Materials and Methods). With a transduction efficiency of 85–95% of thalamic neurons, slight underestimations of the actual number of contacts are expected with the viral strategy. Accounting for incomplete transduction would raise our estimate of TC synapses, for example, from 10.5% to 11.5% of the total number axospinous contacts. However, spatial distributions would be undistorted.
Our light-based method is a scalable, generalizable, and reliable strategy for mapping a neuron's complete dendritic arbor at the resolution of the synapse. The correlative LM-EM approach is also widely generalizable. The technology for these methods is within immediate reach of most neuroscience laboratories.
Distribution of thalamocortical inputs onto L4 neurons
On average, TC synapses were more proximal to the somata of excitatory L4 neurons than CC synapses. TC synapses were most prevalent within the first ∼30 μm along the dendrites, after which their relative density dropped rapidly. This subtle bias is independent of the distribution of spine density along the dendritic arbor, which varies with regard to somatic proximity. The spatial bias observed in both spiny stellate cells and star pyramids was independent of somatic location within the barrel and could not be predicted by the known anatomical distribution of TC axons.
One study in primary auditory cortex found that TC contacts are more prevalent on basal than apical dendrites and synapse more proximally on the apical trunk (Richardson et al., 2009), as predicted by the laminar distribution of TC axons (Cruikshank et al., 2002; Smith et al., 2012). No prominent spatial bias of TC synapses was reported within the basal compartments of auditory cortex neurons (Richardson et al., 2009), but synapse detection by calcium imaging severely limits sample size. L4 of auditory cortex consists of true pyramidal neurons with extensive apical tufts (Smith and Populin, 2001). In contrast, the entire dendritic extent of the smaller spiny stellates found in L4 of somatosensory and visual cortex reside almost entirely in the dense arborization zone of TC axons, not just the area proximal to the soma. Our results therefore cannot be explained simply by gross axonal anatomy and may instead reflect the earlier development of thalamic than cortical axons.
The auditory cortex study found a preponderance of TC synapses onto stubby spines. This discrepancy with our data may reflect: (1) differences in cortical areas and cell types; (2) the relative difficulty in distinguishing stubby and mushroom spines under two-photon, rather than deconvolved confocal, imaging; (3) the large spine sample size obtainable by our method; and/or (4) changes in spine morphology induced by slicing (Kirov et al., 1999).
Relative strength of TC and CC inputs
Decreased filtering expected from proximal TC locations along the dendrites has previously been proposed as a mechanism for the pronounced TC efficacy encountered in vitro. However, our compartmental model predicts that the average strength of TC versus CC synapses is only marginally augmented by location, even though our model is less electrotonically compact than a previous biophysical model of this cell type (Segev et al., 1995). Thus, L4 cells are too electrotonically compact for the anatomical bias to explain the marked difference in the strength of these two classes of synapses.
Our in vivo minimal stimulation experiments confirm the model's prediction, revealing that TC and CC synapses are similar in strength, in contrast to prior characterizations performed in vitro, in which TC synapses were found to be significantly stronger than CC synapses (Stratford et al., 1996; Gil et al., 1999; Richardson et al., 2009). It is unlikely that the difference between the slice and the intact preparations is due to elevated overall background activity in vivo. Indeed, we recorded no spontaneous L4 action potentials under deep anesthesia and, at this anesthetic depth, thalamus lacks spontaneous activity (Friedberg et al., 1999), mitigating possible effects due to short-term plasticity. More likely, the lower external calcium concentration in vivo relative to traditional in vitro preparations (Borst, 2010), as well as the presence of neuromodulators, could skew the measurement of synaptic properties. The different release probabilities, synaptic dynamics, and VGluT isoforms of TC and CC synapses observed in vitro may therefore reflect the need for TC synapses to support relatively higher firing rates of thalamic neurons (Bruno and Sakmann, 2006; Voigt et al., 2008) rather than a difference in synaptic efficacy.
To our knowledge, this is the first comparison of TC and CC synaptic strengths side by side in vivo. Although TC inputs are weaker when measured in vivo than in vitro (Bruno and Sakmann, 2006), the relative strength of TC and CC synapses in the living animal has remained unknown. Moreover, prior in vivo estimates of TC synapse strength required averaging postsynaptic membrane potential during sensory stimulation, potentially limiting measurement to partially depressed TC synapses. The minimal stimulation technique used here requires no sensory stimulus and measures EPSPs on a single-spike basis, eliminating the potential confound of synaptic depression due to sustained thalamic activity during whisker stimulation.
TC synapses are no stronger than CC synapses, which outnumber them 10 to 1, yet sensory stimuli depolarize L4 substantially. Sensory stimuli synchronize thalamic neurons to varying degrees on millisecond timescales (Alonso et al., 1996; Temereanca and Simons, 2003; Bruno and Sakmann, 2006; Wang et al., 2010; Oberlaender et al., 2012) and TC convergence is high for excitatory L4 neurons, which each receive connections from as many as ∼90 thalamic neurons (Reid and Alonso, 1995; Bruno and Sakmann, 2006; Bruno, 2011). Therefore, TC synapses are both sufficiently convergent and synchronously active to powerfully influence cortical activity. Concurrently, potent short-latency feedforward inhibition in the cortex (Bruno and Simons, 2002) dampens recurrent excitation arising from the numerous excitatory CC synapses.
Experimentally evoked bursts of action potentials in single cortical neurons can have substantial circuit- or behavior-level consequences (Brecht et al., 2004; Houweling and Brecht, 2008; London et al., 2010), but it remains unclear when, if ever, cortical neurons switch from a sparse firing regime to a highly active one (Barth and Poulet, 2012). Faced with sparse, single action potentials, weak connections will only be able to bring a cortical neuron to threshold by the coordinated activity among many of them (Rossant et al., 2011). The weakness of both TC and CC synapses suggests that cortex may encode and transmit information via synchronous population activity, as has been demonstrated for visual and somatosensory thalamus (Temereanca and Simons, 2003; Wang et al., 2010; Stanley et al., 2012). Future experiments independently manipulating the synchrony versus rate among presynaptic populations are needed to further address this issue of coding. A similar synchrony mechanism, by which a single brain region can wield outsized influence over an area downstream using a small number synapses, may be exploited by other long-range projections, such as from primary to higher-order cortex, dentate gyrus to CA3, and between cortical layers.
Footnotes
This work was supported by the National Institute of Neurological Disorders and Stroke–National Institutes of Health (Grant RO1 NS069679 to R.M.B., Grant T32 NS064928 to C.E.S.), the Rita Allen Foundation, the Gatsby Foundation (R.M.B.), the National Science Foundation (Graduate Research Fellowship to C.E.S.), ALS Therapy Alliance (J.-C.T.), the New York Stem Cell Foundation (J.-C.T.), and the National Health and Medical Research Council Australia (Grant 1030016 to V.W.). We thank Attila Losonczy, Kevin Franks, Andrew Fink, and members of the Bruno laboratory for substantive comments on the manuscript and Drew Baughman for technical support.
The authors declare no competing financial interests.
References
- Alonso JM, Usrey WM, Reid RC. Precisely correlated firing in cells of the lateral geniculate nucleus. Nature. 1996;383:815–819. doi: 10.1038/383815a0. [DOI] [PubMed] [Google Scholar]
- Barth AL, Poulet JF. Experimental evidence for sparse firing in the neocortex. Trends Neurosci. 2012;35:345–355. doi: 10.1016/j.tins.2012.03.008. [DOI] [PubMed] [Google Scholar]
- Benshalom G, White EL. Quantification of thalamocortical synapses with spiny stellate neurons in layer IV of mouse somatosensory cortex. J Comp Neurol. 1986;253:303–314. doi: 10.1002/cne.902530303. [DOI] [PubMed] [Google Scholar]
- Borst JG. The low synaptic release probability in vivo. Trends Neurosci. 2010;33:259–266. doi: 10.1016/j.tins.2010.03.003. [DOI] [PubMed] [Google Scholar]
- Brecht M, Schneider M, Sakmann B, Margrie TW. Whisker movements evoked by stimulation of single pyramidal cells in rat motor cortex. Nature. 2004;427:704–710. doi: 10.1038/nature02266. [DOI] [PubMed] [Google Scholar]
- Bruno RM. Synchrony in sensation. Curr Opin Neurobiol. 2011;21:701–708. doi: 10.1016/j.conb.2011.06.003. [DOI] [PMC free article] [PubMed] [Google Scholar]
- Bruno RM, Sakmann B. Cortex is driven by weak but synchronously active thalamocortical synapses. Science. 2006;312:1622–1627. doi: 10.1126/science.1124593. [DOI] [PubMed] [Google Scholar]
- Bruno RM, Simons DJ. Feedforward mechanisms of excitatory and inhibitory cortical receptive fields. J Neurosci. 2002;22:10966–10975. doi: 10.1523/JNEUROSCI.22-24-10966.2002. [DOI] [PMC free article] [PubMed] [Google Scholar]
- Bruno RM, Hahn TT, Wallace DJ, de Kock CP, Sakmann B. Sensory experience alters specific branches of individual corticocortical axons during development. J Neurosci. 2009;29:3172–3181. doi: 10.1523/JNEUROSCI.5911-08.2009. [DOI] [PMC free article] [PubMed] [Google Scholar]
- Cardona A, Saalfeld S, Schindelin J, Arganda-Carreras I, Preibisch S, Longair M, Tomancak P, Hartenstein V, Douglas RJ. TrakEM2 software for neural circuit reconstruction. PLoS One. 2012;7:e38011. doi: 10.1371/journal.pone.0038011. [DOI] [PMC free article] [PubMed] [Google Scholar]
- Chen JL, Villa KL, Cha JW, So PT, Kubota Y, Nedivi E. Clustered dynamics of inhibitory synapses and dendritic spines in the adult neocortex. Neuron. 2012;74:361–373. doi: 10.1016/j.neuron.2012.02.030. [DOI] [PMC free article] [PubMed] [Google Scholar]
- Coleman JE, Nahmani M, Gavornik JP, Haslinger R, Heynen AJ, Erisir A, Bear MF. Rapid structural remodeling of thalamocortical synapses parallels experience-dependent functional plasticity in mouse primary visual cortex. J Neurosci. 2010;30:9670–9682. doi: 10.1523/JNEUROSCI.1248-10.2010. [DOI] [PMC free article] [PubMed] [Google Scholar]
- Conchello JA, Lichtman JW. Optical sectioning microscopy. Nat Methods. 2005;2:920–931. doi: 10.1038/nmeth815. [DOI] [PubMed] [Google Scholar]
- Cruikshank SJ, Rose HJ, Metherate R. Auditory thalamocortical synaptic transmission in vitro. J Neurophysiol. 2002;87:361–384. doi: 10.1152/jn.00549.2001. [DOI] [PubMed] [Google Scholar]
- da Costa NM, Martin KA. How thalamus connects to spiny stellate cells in the cat's visual cortex. J Neurosci. 2011;31:2925–2937. doi: 10.1523/JNEUROSCI.5961-10.2011. [DOI] [PMC free article] [PubMed] [Google Scholar]
- Egger V, Nevian T, Bruno RM. Subcolumnar dendritic and axonal organization of spiny stellate and star pyramid neurons within a barrel in rat somatosensory cortex. Cereb Cortex. 2008;18:876–889. doi: 10.1093/cercor/bhm126. [DOI] [PubMed] [Google Scholar]
- Feldmeyer D. Excitatory neuronal connectivity in the barrel cortex. Front Neuroanat. 2012;6:24. doi: 10.3389/fnana.2012.00024. [DOI] [PMC free article] [PubMed] [Google Scholar]
- Feldmeyer D, Egger V, Lubke J, Sakmann B. Reliable synaptic connections between pairs of excitatory layer 4 neurones within a single ‘barrel’ of developing rat somatosensory cortex. J Physiol. 1999;521:169–190. doi: 10.1111/j.1469-7793.1999.00169.x. [DOI] [PMC free article] [PubMed] [Google Scholar]
- Friedberg MH, Lee SM, Ebner FF. Modulation of receptive field properties of thalamic somatosensory neurons by the depth of anesthesia. J Neurophysiol. 1999;81:2243–2252. doi: 10.1152/jn.1999.81.5.2243. [DOI] [PubMed] [Google Scholar]
- Fujiyama F, Furuta T, Kaneko T. Immunocytochemical localization of candidates for vesicular glutamate transporters in the rat cerebral cortex. J Comp Neurol. 2001;435:379–387. doi: 10.1002/cne.1037. [DOI] [PubMed] [Google Scholar]
- Gil Z, Connors BW, Amitai Y. Efficacy of thalamocortical and intracortical synaptic connections: quanta, innervation, and reliability. Neuron. 1999;23:385–397. doi: 10.1016/S0896-6273(00)80788-6. [DOI] [PubMed] [Google Scholar]
- Graziano A, Liu XB, Murray KD, Jones EG. Vesicular glutamate transporters define two sets of glutamatergic afferents to the somatosensory thalamus and two thalamocortical projections in the mouse. J Comp Neurol. 2008;507:1258–1276. doi: 10.1002/cne.21592. [DOI] [PubMed] [Google Scholar]
- Hayworth KJ, Kasthuri N, Schalek R, Lichtman JW. Automating the collection of ultrathin serial sections for large volume TEM reconstructions. Microscopy and Microanalysis. 2006;12:86–87. doi: 10.1017/S1431927606066268. [DOI] [Google Scholar]
- Hell SW, Schrader M, van der Voort HT. Far-field fluorescence microscopy with three-dimensional resolution in the 100-nm range. J Microsc. 1997;187:1–7. doi: 10.1046/j.1365-2818.1997.2410797.x. [DOI] [PubMed] [Google Scholar]
- Houweling AR, Brecht M. Behavioural report of single neuron stimulation in somatosensory cortex. Nature. 2008;451:65–68. doi: 10.1038/nature06447. [DOI] [PubMed] [Google Scholar]
- Kharazia VN, Weinberg RJ. Glutamate in thalamic fibers terminating in layer IV of primary sensory cortex. J Neurosci. 1994;14:6021–6032. doi: 10.1523/JNEUROSCI.14-10-06021.1994. [DOI] [PMC free article] [PubMed] [Google Scholar]
- Kirov SA, Sorra KE, Harris KM. Slices have more synapses than perfusion-fixed hippocampus from both young and mature rats. J Neurosci. 1999;19:2876–2886. doi: 10.1523/JNEUROSCI.19-08-02876.1999. [DOI] [PMC free article] [PubMed] [Google Scholar]
- Lavzin M, Rapoport S, Polsky A, Garion L, Schiller J. Nonlinear dendritic processing determines angular tuning of barrel cortex neurons in vivo. Nature. 2012;490:397–401. doi: 10.1038/nature11451. [DOI] [PubMed] [Google Scholar]
- Lefort S, Tomm C, Floyd Sarria JC, Petersen CC. The excitatory neuronal network of the C2 barrel column in mouse primary somatosensory cortex. Neuron. 2009;61:301–316. doi: 10.1016/j.neuron.2008.12.020. [DOI] [PubMed] [Google Scholar]
- Little JP, Carter AG. Subcellular synaptic connectivity of layer 2 pyramidal neurons in the medial prefrontal cortex. J Neurosci. 2012;32:12808–12819. doi: 10.1523/JNEUROSCI.1616-12.2012. [DOI] [PMC free article] [PubMed] [Google Scholar]
- London M, Roth A, Beeren L, Häusser M, Latham PE. Sensitivity to perturbations in vivo implies high noise and suggests rate coding in cortex. Nature. 2010;466:123–127. doi: 10.1038/nature09086. [DOI] [PMC free article] [PubMed] [Google Scholar]
- Nahmani M, Erisir A. VGluT2 immunochemistry identifies thalamocortical terminals in layer 4 of adult and developing visual cortex. J Comp Neurol. 2005;484:458–473. doi: 10.1002/cne.20505. [DOI] [PubMed] [Google Scholar]
- Nevian T, Larkum ME, Polsky A, Schiller J. Properties of basal dendrites of layer 5 pyramidal neurons: a direct patch-clamp recording study. Nat Neurosci. 2007;10:206–214. doi: 10.1038/nn1826. [DOI] [PubMed] [Google Scholar]
- Oberlaender M, Ramirez A, Bruno RM. Sensory experience restructures thalamocortical axons during adulthood. Neuron. 2012;74:648–655. doi: 10.1016/j.neuron.2012.03.022. [DOI] [PMC free article] [PubMed] [Google Scholar]
- Peters A, Kaiserman-Abramof IR. The small pyramidal neuron of the rat cerebral cortex: the perikaryon, dendrites and spines. Am J Anat. 1970;127:321–355. doi: 10.1002/aja.1001270402. [DOI] [PubMed] [Google Scholar]
- Peters A, Payne BR. Numerical relationships between geniculocortical afferents and pyramidal cell modules in cat primary visual cortex. Cereb Cortex. 1993;3:69–78. doi: 10.1093/cercor/3.1.69. [DOI] [PubMed] [Google Scholar]
- Petreanu L, Mao T, Sternson SM, Svoboda K. The subcellular organization of neocortical excitatory connections. Nature. 2009;457:1142–1145. doi: 10.1038/nature07709. [DOI] [PMC free article] [PubMed] [Google Scholar]
- Raastad M, Storm JF, Andersen P. Putative single quantum and single fibre excitatory postsynaptic currents show similar amplitude range and variability in rat hippocampal slices. Eur J Neurosci. 1992;4:113–117. doi: 10.1111/j.1460-9568.1992.tb00114.x. [DOI] [PubMed] [Google Scholar]
- Reid RC, Alonso JM. Specificity of monosynaptic connections from thalamus to visual cortex. Nature. 1995;378:281–284. doi: 10.1038/378281a0. [DOI] [PubMed] [Google Scholar]
- Richardson RJ, Blundon JA, Bayazitov IT, Zakharenko SS. Connectivity patterns revealed by mapping of active inputs on dendrites of thalamorecipient neurons in the auditory cortex. J Neurosci. 2009;29:6406–6417. doi: 10.1523/JNEUROSCI.0258-09.2009. [DOI] [PMC free article] [PubMed] [Google Scholar]
- Rossant C, Leijon S, Magnusson AK, Brette R. Sensitivity of noisy neurons to coincident inputs. J Neurosci. 2011;31:17193–17206. doi: 10.1523/JNEUROSCI.2482-11.2011. [DOI] [PMC free article] [PubMed] [Google Scholar]
- Roy SA, Alloway KD. Coincidence detection or temporal integration? What the neurons in somatosensory cortex are doing. J Neurosci. 2001;21:2462–2473. doi: 10.1523/JNEUROSCI.21-07-02462.2001. [DOI] [PMC free article] [PubMed] [Google Scholar]
- Rust MJ, Bates M, Zhuang X. Sub-diffraction-limit imaging by stochastic optical reconstruction microscopy (STORM) Nat Methods. 2006;3:793–795. doi: 10.1038/nmeth929. [DOI] [PMC free article] [PubMed] [Google Scholar]
- Segev I, Friedman A, White EL, Gutnick MJ. Electrical consequences of spine dimensions in a model of a cortical spiny stellate cell completely reconstructed from serial thin sections. J Comput Neurosci. 1995;2:117–130. doi: 10.1007/BF00961883. [DOI] [PubMed] [Google Scholar]
- Smith PH, Populin LC. Fundamental differences between the thalamocortical recipient layers of the cat auditory and visual cortices. J Comp Neurol. 2001;436:508–519. doi: 10.1002/cne.1084. [DOI] [PubMed] [Google Scholar]
- Smith PH, Uhlrich DJ, Manning KA, Banks MI. Thalamocortical projections to rat auditory cortex from the ventral and dorsal divisions of the medial geniculate nucleus. J Comp Neurol. 2012;520:34–51. doi: 10.1002/cne.22682. [DOI] [PMC free article] [PubMed] [Google Scholar]
- Stanley GB, Jin J, Wang Y, Desbordes G, Wang Q, Black MJ, Alonso JM. Visual orientation and directional selectivity through thalamic synchrony. J Neurosci. 2012;32:9073–9088. doi: 10.1523/JNEUROSCI.4968-11.2012. [DOI] [PMC free article] [PubMed] [Google Scholar]
- Stratford KJ, Tarczy-Hornoch K, Martin KA, Bannister NJ, Jack JJ. Excitatory synaptic inputs to spiny stellate cells in cat visual cortex. Nature. 1996;382:258–261. doi: 10.1038/382258a0. [DOI] [PubMed] [Google Scholar]
- Temereanca S, Simons DJ. Local field potentials and the encoding of whisker deflections by population firing synchrony in thalamic barreloids. J Neurophysiol. 2003;89:2137–2145. doi: 10.1152/jn.00582.2002. [DOI] [PubMed] [Google Scholar]
- Voigt BC, Brecht M, Houweling AR. Behavioral detectability of single-cell stimulation in the ventral posterior medial nucleus of the thalamus. J Neurosci. 2008;28:12362–12367. doi: 10.1523/JNEUROSCI.3046-08.2008. [DOI] [PMC free article] [PubMed] [Google Scholar]
- Wang G, Smith SJ. Sub-diffraction limit localization of proteins in volumetric space using Bayesian restoration of fluorescence images from ultrathin specimens. PLoS Comput Biol. 2012;8:e1002671. doi: 10.1371/journal.pcbi.1002671. [DOI] [PMC free article] [PubMed] [Google Scholar]
- Wang Q, Webber RM, Stanley GB. Thalamic synchrony and the adaptive gating of information flow to cortex. Nat Neurosci. 2010;13:1534–1541. doi: 10.1038/nn.2670. [DOI] [PMC free article] [PubMed] [Google Scholar]
- White EL, Rock MP. Three-dimensional aspects and synaptic relationships of a Golgi-impregnated spiny stellate cell reconstructed from serial thin sections. J Neurocytol. 1980;9:615–636. doi: 10.1007/BF01205029. [DOI] [PubMed] [Google Scholar]
- Wimmer VC, Bruno RM, de Kock CP, Kuner T, Sakmann B. Dimensions of a projection column and architecture of VPM and POm axons in rat vibrissal cortex. Cereb Cortex. 2010;20:2265–2276. doi: 10.1093/cercor/bhq068. [DOI] [PMC free article] [PubMed] [Google Scholar]