

Abstract
Theta burst stimulation (TBS), a specific protocol of repetitive transcranial magnetic stimulation (rTMS), induces changes in cortical excitability that last beyond stimulation. TBS-induced aftereffects, however, vary between subjects, and the mechanisms underlying these aftereffects to date remain poorly understood. Therefore, the purpose of this study was to investigate whether increasing the number of pulses of intermittent TBS (iTBS) (1) increases cortical excitability as measured by motor-evoked potentials (MEPs) and (2) alters functional connectivity measured using resting-state fMRI, in a dose-dependent manner. Sixteen healthy, human subjects received three serially applied iTBS blocks of 600 pulses over the primary motor cortex (M1 stimulation) and the parieto-occipital vertex (sham stimulation) to test for dose-dependent iTBS effects on cortical excitability and functional connectivity (four sessions in total). iTBS over M1 increased MEP amplitudes compared with sham stimulation after each stimulation block. Although the increase in MEP amplitudes did not differ between the first and second block of M1 stimulation, we observed a significant increase after three blocks (1800 pulses). Furthermore, iTBS enhanced resting-state functional connectivity between the stimulated M1 and premotor regions in both hemispheres. Functional connectivity between M1 and ipsilateral dorsal premotor cortex further increased dose-dependently after 1800 pulses of iTBS over M1. However, no correlation between changes in MEP amplitudes and functional connectivity was detected. In summary, our data show that increasing the number of iTBS stimulation blocks results in dose-dependent effects at the local level (cortical excitability) as well as at a systems level (functional connectivity) with a dose-dependent enhancement of dorsal premotor cortex-M1 connectivity.
Keywords: functional connectivity, iTBS, neural plasticity, premotor cortex, resting-state fMRI, supplementary motor area
Introduction
Neural plasticity describes the fundamental property of the brain to undergo structural and functional modifications after patterns of activity or stimulation (Pascual-Leone et al., 2005). Repetitive transcranial magnetic stimulation (rTMS) can be used to alter electrophysiological properties of cortical areas (Wassermann, 1998). Depending on stimulation frequency and pattern, rTMS may enhance or suppress cortical excitability with effects extending beyond the stimulation period (Pascual-Leone et al., 1998). However, responses to rTMS vary considerably between subjects, and the mechanisms underlying excitability changes remain poorly understood (Ridding and Ziemann, 2010; Hamada et al., 2013).
Intermittent theta burst stimulation (iTBS) is a specific rTMS protocol that effectively increases cortical excitability of the targeted brain region after a relatively short stimulation period (Huang et al., 2005; Di Lazzaro et al., 2008; Gamboa et al., 2010, 2011; Cárdenas-Morales et al., 2013). Neuropharmacological studies suggest that the response to iTBS, at least in part, depends on NMDA-receptor activity (Huang et al., 2007; Teo et al., 2007). Data obtained in rats imply that iTBS interferes with the cellular expression of various neuronal proteins reflecting the activity level of the GABAergic inhibitory system (Benali et al., 2011; Funke and Benali, 2011). Moreover, the application of multiple iTBS blocks has a dose-dependent effect on the expression of these proteins in rodents (Volz et al., 2013). In contrast, studies in humans thus far failed to demonstrate additive aftereffects of multiple iTBS blocks on motor–cortical excitability (Gamboa et al., 2010, 2011).
Importantly, rTMS not only influences neuronal properties of the stimulated region but may also impact on the activity levels of remote but interconnected areas (Bestmann et al., 2003, 2004, 2005). Studies using different kinds of rTMS protocols provide converging evidence that rTMS can be used to modulate connectivity of a given region within a network of brain areas (Grefkes et al., 2010; Vercammen et al., 2010; Eldaief et al., 2011; van der Werf et al., 2010; Watanabe et al., 2014). The wealth of studies using rTMS to modulate human cortical excitability is contrasted by the dearth of data regarding dose-dependent effects of rTMS or iTBS on both local neural activity under the stimulated area and on remote effects.
In the current study, we thus addressed the question whether a repeated iTBS application in humans exerts dose-dependent effects on (1) regional, cortical excitability in the primary motor cortex (M1) and/or (2) motor–network connectivity of the stimulated site (here, M1). To this end, we used a multimodal approach, where each of three serially applied iTBS blocks was followed by the assessment of (1) motor-evoked potentials (MEPs, corticospinal excitability) or (2) resting-state fMRI (functional connectivity) on separate days. Based on previous findings (Gamboa et al., 2010, 2011; Volz et al., 2013), we hypothesized that iTBS increases cortical excitability in a dose-dependent way. Moreover, we hypothesized that iTBS induces changes in resting-state functional connectivity (rsFC) between the stimulated M1 and other regions of the (cortical) motor network (Vercammen et al., 2010; Eldaief et al., 2011; van der Werf et al., 2010).
Materials and Methods
Subjects
We included 16 healthy, right-handed subjects (7 males, mean ± SD age: 27 ± 3 years) with no history of neurological or psychiatric diseases. All subjects provided informed written consent. Right-handedness was verified using the Edinburgh Handedness Inventory (Oldfield, 1971). The study was performed according to the Declaration of Helsinki (1969, last revision 2008) and approved by the local ethics committee.
Experimental design
Main experiment.
We used a single-blind, vertex stimulation controlled crossover within-subject design to test for the effects of multiple serially applied iTBS blocks on (1) cortical excitability and (2) functional connectivity. The experimental design is illustrated in Figure 1. Each subject participated in two MEP sessions (to assess cortical excitability) and two fMRI sessions (to assess cortical connectivity) on different days (main experiment, Fig. 1A). Sessions were separated by at least 1 week to avoid carryover effects. To test for dose-dependent effects, subjects received three iTBS applications with 600 pulses per application (see below) interrupted by a stimulation break of 15 min (compare Volz et al., 2013) in each session. In two of the four sessions, subjects were stimulated over M1 of the dominant (left) hemisphere (M1 stimulation). In the other two sessions, stimulation was applied over the parieto-occipital vertex (sham stimulation). Thus, each subject underwent the following four sessions: M1-iTBS_MEPs, sham-iTBS_MEPs, M1-iTBS_rs-fMRI, and sham-iTBS_rs-fMRI. In the MEP sessions, MEPs were measured at baseline and after each iTBS block. Likewise, in the fMRI sessions, resting-state fMRI time series were acquired at baseline and after each iTBS block. Importantly, MEP and resting-state fMRI measurements were performed within a similar time frame: both recordings were started ∼3 min after the end of iTBS applications, and lasted ∼8 min (controlled by a stopwatch). The order of M1 and sham stimulation was randomized between subjects.
Figure 1.
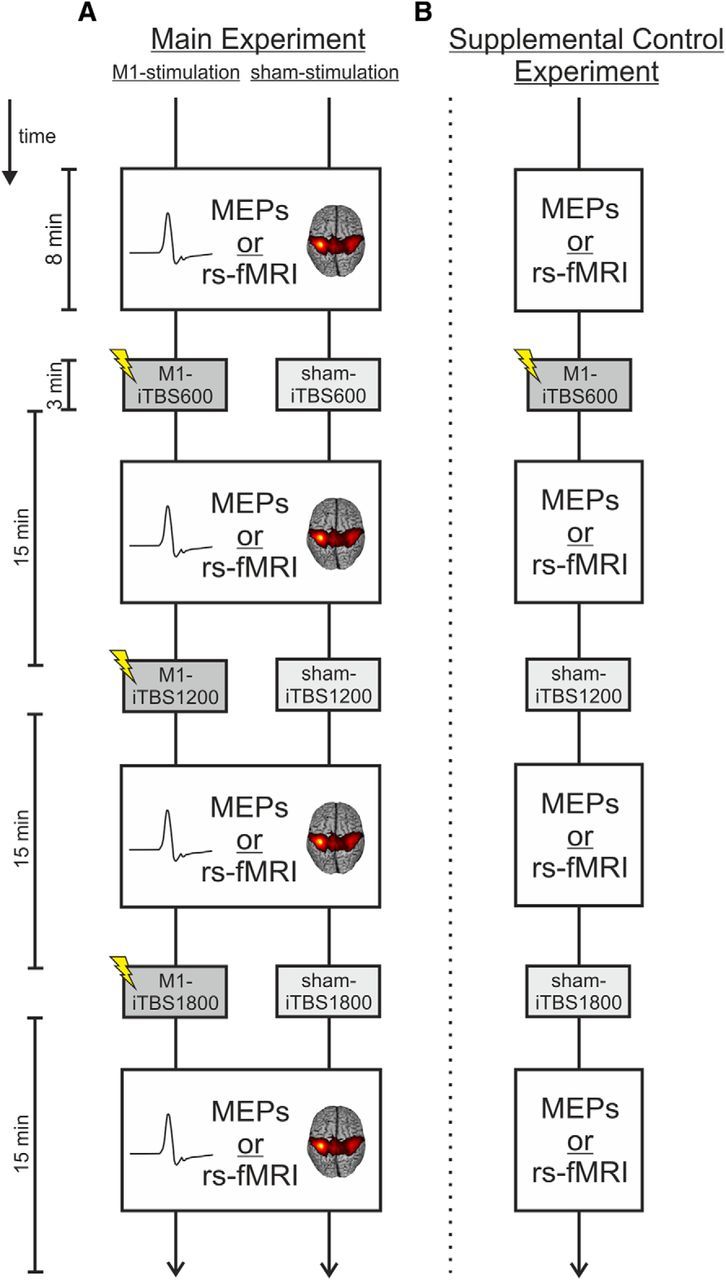
Experimental design. A, Main experiment. Subjects took part in two MEP sessions (M1-iTBS_MEPs, sham-iTBS_MEPs) and two resting-state fMRI sessions (M1-iTBS_rs-fMRI, sham-iTBS_rs-fMRI) on four separate days. Using a within-subject design, each subject received three serially applied iTBS blocks over M1 (M1 stimulation) and over the parieto-occipital vertex (sham stimulation), each followed by the assessment of MEPs or resting-state fMRI. B, Supplemental control experiment. In a second experiment, a subgroup of 6 subjects additionally received one stimulation over M1 followed by two stimulations over the parieto-occipital vertex (supplemental control stimulation) to test for the specificity of additive aftereffects after serial iTBS over M1.
Supplemental control experiment.
Six participants from the main experiment were tested in a control experiment to test for the specificity of putative aftereffects after serial iTBS over M1 (Fig. 1B). Stimulation aftereffects were again tested with MEPs and resting-state fMRI on separate days. In contrast to the main experiment, subjects now received only one iTBS block over M1 followed by two sham stimulation blocks over the vertex (supplemental control experiment, Fig. 1B). Data from the main experiment (3 × M1 stimulation) were replotted for this subgroup of subjects (n = 6). This allowed us to differentiate dose-dependent changes in MEP amplitudes and rsFC after three consecutive M1-iTBS blocks from stimulation effects resulting from the first M1-iTBS block and consecutive changes over time.
Neuronavigated transcranial magnetic stimulation
The position of the TMS coil was tracked and recorded using the neuronavigation system “BrainSight2” (Rogue Research). For neuronavigation, the head of the subject was coregistered with an individual high-resolution anatomical MR image (voxel size: 1.0 × 1.0 × 1.0 mm3, FOV = 256 mm, 176 sagittal slices, TR = 2250 ms, TE = 3.93 ms) via anatomical landmarks (e.g., nasion and crus helicis) before the hotspot search.
MEP amplitudes of the abductor pollicis brevis (APB) muscle were measured using Ag/AgCl surface electrodes (Tyco Healthcare) in a belly-tendon montage. The EMG signal was amplified, filtered (0.5 Hz high pass and 30–300 Hz bandpass), and digitized with a Powerlab 26T device and the LabChart software package version 5 (AD Instruments).
For the initial positioning of the TMS coil, the M1 “hand knob” formation was used as an anatomical landmark (Yousry et al., 1997). The coil was positioned tangentially to the scalp with the handle pointing posterolaterally. The stimulation “hotspot” for iTBS and MEP acquisition was defined as the location where MEPs with highest amplitude and lowest latency could be evoked. Then, the resting motor threshold (RMT) was defined using an algorithm provided by the TMS Motor Threshold Assessment Tool 2.0 (http://www.clinicalresearcher.org/software.htm). The software defines the RMT in 12 steps using maximum likelihood calculations based on positive (peak-to-peak amplitude of at least 50 μV) or negative MEP responses as marked by the investigator via button press. The RMT was assessed at baseline and after the third iTBS application on each of the four sessions.
Theta burst stimulation
We used the iTBS protocol described by Huang et al. (2005). Accordingly, iTBS consisted of three pulses delivered at a frequency of 50 Hz (1 burst) applied every 200 ms for 2 s (10 bursts), repeated every 10 s for a total duration of 191 s (600 pulses). As previously described and evaluated, iTBS was delivered at 70% of the RMT (Gentner et al., 2008; Sarfeld et al., 2012; Cárdenas-Morales et al., 2013). This is a slight modification to the original iTBS protocol according to which iTBS has been applied at 80% of the individual active motor threshold (AMT) (Huang et al., 2005). Our intention was to prevent voluntary preactivation of the target muscle, which may impact on TBS aftereffects (Gentner et al., 2008; Huang et al., 2008) but is necessary to assess the AMT. Evidence suggests that 70% RMT reflects a comparable range of absolute stimulator output intensities compared with 80% AMT (Chen et al., 1998; Sarfeld et al., 2012). Furthermore, previous studies already applied TBS with 70% of the RMT and reported aftereffects that are in perfect accordance to results using a stimulation intensity of 80% AMT (Gentner et al., 2008; Cárdenas-Morales et al., 2013).
We applied iTBS either over the left, dominant M1 (i.e., the “hotspot”) or over the parieto-occipital vertex as sham stimulation (Herwig et al., 2007, 2010). For sham stimulation, the same stimulator output intensity was used as for M1 stimulation. To reduce possible cortical stimulation effects in the sham condition, the coil was held at 45°, touching the skull not with the center but with the rim opposite the handle. In this position, the coil–cortex distance is substantially larger such that the electromagnetic field, if at all reaching the cortex, is substantially weaker and far outside the target range (Herwig et al., 2007, 2010).
On each of the 4 d, iTBS was repeated three times (either 3 × M1 stimulation or 3 × sham stimulation over the vertex) separated by 15 min, leading to a total of 1800 pulses (i.e., iTBS600, iTBS1200, iTBS1800; Figure 1A). This protocol was previously shown to evoke additive iTBS aftereffects at the cellular level in rats (Volz et al., 2013). Use of the neuronavigation system warranted a reliable positioning of the TMS stimulation site across all sessions and subjects. iTBS was delivered using a Magstim SuperRapid 2 with a figure-of-eight coil (70 mm standard coil, Magstim).
MEPs
Motor cortex excitability was assessed via MEPs recorded from the APB. Neuronavigated single-pulse TMS was applied over the same location as used for iTBS (motor–cortical representation of the APB at the M1 “hand knob” formation) using a monophasic Magstim 2002 stimulator (Magstim). In line with other groups (Huang et al., 2005; Hamada et al., 2013), we used different stimulators for MEP acquisition and delivery of iTBS for the following reason: The SuperRapid2 stimulator, which we used for high-frequency (burst) stimulation (i.e., iTBS), induces MEPs with biphasic waveforms exciting different neuronal populations during the different phases of the pulse. In contrast, the monophasic waveform of the Magstim 2002 stimulator, which we used for MEP acquisition, results in more homogeneous MEPs and hence represents the standard way of assessing electrophysiological properties of M1 (Terao and Ugawa, 2002; Di Lazzaro et al., 2004). iTBS-induced changes in cortical excitability are comparable, regardless of the waveform (mono/bisphasic) used to evoke MEPs via single-pulse TMS (Zafar et al., 2008).
At baseline and after each iTBS application (three blocks separated by 15 min), a stimulus–response curve of MEPs evoked with 90%–150% of the RMT was assessed in steps of 10%. TMS pulses were applied at ∼0.1–0.2 Hz (acquisition time, ∼8 min). Two blocks of five pulses were recorded in a randomized order for each intensity, except for 120%, which was assessed in six blocks at five pulses (because 120% represents the commonly used stimulation intensity, see e.g., Kobayashi et al., 2004; Cárdenas-Morales et al., 2013), adding up to a total number of 90 MEPs. Ten MEPs per intensity have been shown to result in reliable stimulus–response curves (Carroll et al., 2001).
Data analysis (MEPs)
For each subject and session (M1 stimulation, sham stimulation), MEP amplitudes acquired after iTBS were normalized to baseline values (i.e., MEPs acquired before the first iTBS application in the respective session) of the respective intensity. This means that after normalization all MEPs for a given intensity of the stimulus–response curve were close to 1.0 (i.e., 100%) in case that there was no difference in MEP amplitudes after iTBS. We used normalized MEP amplitudes to assess changes in cortical excitability rather than absolute MEP amplitudes to account for variance in RMTs at different stimulation days (i.e., M1 and sham stimulation). Normalized MEP amplitudes were then entered into a three-way repeated-measures ANOVA with the factors intervention (2 levels: M1-iTBS, sham-iTBS), dose (3 levels: iTBS600, iTBS1200, iTBS1800), and intensity (7 levels: 90–150% of the RMT) using SPSS version 21 (Statistical Package for the Social Sciences, IBM). In case of significant main or interaction effects, post hoc Student′s t tests were performed to compare the aftereffects of the two types of stimulation and the different doses applied. Given the clear directional hypothesis that iTBS would increase MEP amplitudes (Huang et al., 2005, 2007; Di Lazzaro et al., 2008; Cárdenas-Morales et al., 2013), we used one-tailed post hoc t tests (p ≤ 0.05).
Finally, stimulus–response curves were plotted for each subject using the absolute MEP amplitudes. The steepness of the curves was computed by means of linear regression analyses, and R2 values were calculated to assess the quality of fit using SPSS. Stimulation-induced changes were again tested by a repeated-measures ANOVA.
MRI
The experimental procedures (iTBS applications) of the fMRI sessions were equivalent to those of the MEP sessions (Fig. 1A). Instead of MEP acquisition, however, resting-state fMRI time series were acquired at baseline and after each block of iTBS. Before the baseline fMRI measurements, the “hotspot” and RMT were assessed using the neuronavigation setup described above. Subjects were transported in an MR-compatible wheelchair into the scanner room between each resting-state fMRI and iTBS block to avoid any further movement and to obtain comparable conditions for the resting-state scans.
The fMRI sessions started with a baseline resting-state scan (duration ∼8 min) where subjects were instructed to lie motionless in the scanner with open eyes fixating a red cross, which was presented on a TFT screen visible through a mirror attached to the MR head coil. After completion of the resting-state time-series, subjects were asked to perform an active motor task, which served as a functional localizer for determining coordinates of M1 and other motor related regions for subsequent analyses (see below). This “activity” condition was acquired after the resting state scan (i.e., resting-state connectivity estimates were not systematically influenced by prior motor activity).
After completion of the baseline fMRI session, subjects were transported from the scanner to the anteroom of the MR console (again sitting in the MR wheelchair without moving their right arm). After coregistration with the neuronavigation system (lasting 1–2 min), three blocks of iTBS were applied separated by 15 min (controlled by a stopwatch). Each of the three iTBS blocks was followed by another 8 min resting-state fMRI. Hence, the time protocol in the fMRI sessions was identical to the one used in the MEP sessions (Fig. 1).
Localizer task.
We used a simple motor task as a functional localizer to identify the location of core motor regions for the subsequent resting-state analysis. The localizer task consisted of rhythmic thumb abductions and adductions with the right or left hand activating the same muscle as used for TMS recordings (APB). Left hand movements were necessary to also localize motor regions of the hemisphere contralateral to stimulation. Written instructions displayed for 2 s indicated movements of the left or right thumb for the following block of trials. Abduction–adduction movements were triggered by a blinking circle at the frequency of 1.0 Hz for 15 s until a black screen indicated to rest for 15 s. Six blocks for each hand resulted in an acquisition time of ∼7 min. Motor performance was visually controlled during the whole assessment by the experimenter.
Image acquisition and preprocessing (task and resting-state fMRI)
fMRI images were aquired on a Siemens Trio 3.0 T scanner (Siemens Medical Solutions) using a gradient echo planar imaging (EPI) sequence with following parameters: TR = 2070 ms, TE = 30 ms, FOV = 200 mm, 31 slices, voxel size: 3.1 × 3.1 × 3.1 mm3, 20% distance factor, flip angle = 90°, resting-state: 225 volumes (3 dummy images), localizer task: 202 volumes (3 dummy images). Acquisition planes and slice orientation were identical for the four fMRI assessments (i.e., 1 × baseline, 3 × post iTBS sessions) in both the M1 and sham stimulation condition. The slices covered the whole brain extending from the vertex to the lower parts of the cerebellum.
fMRI data were analyzed using Statistical Parametric Mapping (SPM8, http://www.fil.ion.ucl.ac.uk/spm/). The first three volumes (“dummy” images) of each session were discarded from further analyses to allow for magnetic field saturation. All remaining EPI volumes were realigned to the mean image of each time series and coregistered with the structural T1-weighted image. In a next step, all images were spatially normalized to the standard template of the MNI using the unified segmentation approach (Ashburner and Friston, 2005) and smoothed using an isotropic Gaussian kernel of 8 mm full-width at half-maximum.
Statistical analysis: functional localizer task
In the functional localizer task, the two experimental conditions (movements of the left or right thumb) were modeled using boxcar stimulus functions convolved with a canonical hemodynamic response function. The time series of each voxel were high-pass filtered at 1/128 Hz. The six head motion parameters, as assessed by the realignment algorithm, were treated as covariates to remove movement-related variance from the image time series. Simple main effects for each experimental condition were calculated for each subject by applying appropriate baseline contrasts. Voxels were identified as significant on the single-subject level if their T-values passed a height threshold of p ≤ 0.001 (T = 3.14). The individual M1 coordinates of the stimulated hemisphere were then used as seed regions for the resting-state whole-brain analysis (see below). For the group analysis, the parameter estimates of all conditions (main effect right thumb movements, main effect left thumb movements) were subsequently entered into a full factorial ANOVA. Voxels were considered significant when passing a height threshold of p ≤ 0.05, family-wise error (FWE)-corrected (T = 5.72).
Statistical analysis: resting-state fMRI
For the statistical analysis of the resting-state data, variance that could be explained by known confounds was removed from the smoothed fMRI time-series. Confound regressors included the tissue-class-specific global signal intensities and their squared values, the six head motion parameters, their squared values, and their first-order derivatives (Jakobs et al., 2012; Reetz et al., 2012; Satterthwaite et al., 2013). A bandpass filter was used to preserve only frequencies between 0.01 and 0.08 Hz in the time-series data.
First, a seed-based whole-brain group analysis was computed: the time course within a sphere of 10 mm-diameter centered on the seed voxel (here, left M1, single-subject coordinates derived from localizer task; Table 1) was correlated with the time course of every other voxel in the brain by means of linear Pearson's correlation (Eickhoff and Grefkes, 2011; zu Eulenburg et al., 2012). Correlation coefficients were converted to Fisher's z-scores using the formula z = (1/2) × ln(1 + r)/(1 − r) = atanh(r) to yield approximately normally distributed data.
Table 1.
Single-subject coordinates of left primary motor cortex (M1) derived from the respective motor task baseline conjunction of both assessment daysa
| Subject | MNI coordinates |
||
|---|---|---|---|
| x | y | z | |
| 1 | −34.5 | −25.5 | 57 |
| 2 | −40.5 | −24 | 61.5 |
| 3 | −40.5 | −22.5 | 64.5 |
| 4 | −37.5 | −16.5 | 54 |
| 5 | −30 | −31.5 | 70.5 |
| 6 | −40.5 | −19.5 | 63 |
| 7 | −42 | −16.5 | 58.5 |
| 8 | −31.5 | −24 | 70.5 |
| 9 | −33 | −27 | 49.5 |
| 10 | −40.5 | −22.5 | 48 |
| 11 | −42 | −21 | 48 |
| 12 | −39 | −24 | 54 |
| 13 | −43.5 | −21 | 60 |
| 14 | −43.5 | −21 | 63 |
| 15 | −36 | −30 | 57 |
| 16 | −34.5 | −28.5 | 60 |
| Mean | −37 | −24 | 56.4 |
| SD | 4.9 | 3.2 | 5.4 |
aSingle-subject coordinates were used as seed regions for the resting-state whole-brain analysis.
To determine changes in functional connectivity after iTBS, individual baseline functional connectivity maps were subtracted from the respective maps after iTBS for each subject. For group level analysis, the individual subtraction maps were subsequently entered into a “flexible factorial” general linear model analysis in SPM8 with the factors subject and intervention (2 levels: M1-iTBS and sham-iTBS) and dose (3 levels: iTBS600, iTBS1200, and iTBS1800). Then, differential contrast were computed between (1) M1 and sham stimulation for iTBS600, iTBS1200, and iTBS1800, as well as (2) between the different doses applied (i.e., iTBS1800/iTBS1200, iTBS1800/iTBS600, and iTBS1200/iTBS600) for both stimulation conditions. The resting-state maps were masked by cytoarchitectonic probability maps of frontoparietal sensorimotor areas (Brodmann areas 6, 4 a/b, 3 a/b, 2, and 1) to focus inference on rsFC within the cortical sensorimotor network as provided by the SPM Anatomy Toolbox (Eickhoff et al., 2005). The statistical threshold was set to p ≤ 0.05, family-wise error (FWE)-corrected at the cluster level.
Finally, to test whether iTBS applied over M1 also had influences on functional connectivity of nonmotor networks, an additional group analysis was performed for the visual network using an equivalent procedure as for the M1 maps. Accordingly, seed-based whole-brain connectivity maps were computed using the left primary visual cortex (V1) as seed region (Table 2; individual coordinates were derived from the localizer task). Like the M1 maps, visual resting-state connectivity maps were subsequently masked by the respective cytoarchitectonic probability maps as provided by the SPM Anatomy Toolbox (Eickhoff et al., 2005).
Table 2.
Single-subject coordinates of left primary visual cortex (V1)
| Subjects | MNI coordinates |
||
|---|---|---|---|
| x | y | z | |
| 1 | −10.5 | −94.5 | −9 |
| 2 | 0 | −94.5 | −16.5 |
| 3 | −16.5 | −103.5 | −4.5 |
| 4 | −9 | −100.5 | −12 |
| 5 | −18 | −88.5 | −9 |
| 6 | −19.5 | −99 | −15 |
| 7 | −16.5 | −105 | −9 |
| 8 | −16.5 | −99 | −12 |
| 9 | −16.5 | −100.5 | −6 |
| 10 | −15 | −102 | 1.5 |
| 11 | −13.5 | −102 | −6 |
| 12 | −18 | −102 | −9 |
| 13 | −18 | −102 | −9 |
| 14 | −16.5 | −102 | −10.5 |
| 15 | −15 | −96 | −3 |
| 16 | −12 | −105 | −12 |
| Mean | −18.6 | −101.3 | −10 |
| SD | 6.8 | 3.1 | 3.9 |
ROI analysis
As we hypothesized that rsFC would increase dose-dependently between M1 and distinct motor regions, we performed small-volume corrections in different ROIs for following contrasts: iTBS1800 versus iTBS600, iTBS1800 versus iTBS1200, and iTBS1200 versus iTBS600. Based on previous studies, reporting altered neural activity or rsFC after rTMS in distinct motor regions (Bestmann et al., 2004; Watanabe et al., 2014), we chose the following ROIs (group MNI coordinates, x y z): bilateral supplementary motor area (SMA, left: −4.5, −9, 64.5, right: 6, −3, 69), bilateral dorsal premotor cortex (dPMC, left: −31.5, −9, 60, right: 36, −9, 60), and right contralateral M1 (30, −28, 57). Connectivity estimates in these regions were FWE-corrected on the voxel level (p < 0.05) using 10 mm spheres centered around the respective ROI coordinate.
Correlation between MEP amplitudes and rsFC
Finally, we tested for correlations between dose-dependent changes observed at the electrophysiological level (i.e., MEPs) and changes at the systems level (i.e., rsFC). Therefore, contrast images (iTBS1800 vs iTBS1200; iTBS1800 vs iTBS600) were entered into SPM multiple regression analyses, including differences in normalized MEP amplitudes (iTBS1800 vs iTBS1200; iTBS1800 vs iTBS600) as covariates.
Results
iTBS aftereffects on electrophysiological parameters
Main experiment
Resting motor thresholds did not differ between M1 (32.3 ± 6.3% maximal stimulator output [MSO]) and sham stimulation (33.4 ± 7.3% MSO) (p = 0.164). Furthermore, iTBS had no effect on the RMT after the third iTBS block compared with baseline (M1 stimulation: 32.5 ± 6.8% MSO, p = 0.78; sham stimulation: 33.7 ± 6.2% MSO, p = 0.74). MEP amplitudes acquired at baseline were also not significantly different for M1 compared with sham stimulation (p > 0.3 for each comparison).
A three-way repeated-measures ANOVA testing for iTBS aftereffects on normalized MEP amplitudes revealed a significant main effect of the factor intervention (two levels: M1-iTBS, sham-iTBS; F(1,15) = 8.78, p = 0.010) and an interaction effect for intervention (two levels: M1-iTBS, sham-iTBS) × dose (three levels: iTBS600, iTBS1200, iTBS1800) (F(2,30) = 5.61, p = 0.009). The interaction effect indicated that there was a dose-dependent effect on MEP amplitudes depending on whether subjects received M1-iTBS or sham-iTBS. In contrast, there were no significant effects of the factor intensity (seven levels: 90%–150% RMT, p ≥ 0.05 for each comparison). However, the interaction effect of the factors intervention × dose × intensity showed a statistical trend (F(12,180) = 1.60, p = 0.095). When plotting the normalized MEP amplitudes for the different intensities (Fig. 2), dose-dependent iTBS aftereffects tended to be more pronounced at low-stimulation intensities (90%–110% RMT) compared with higher-stimulation intensities (120%–150% RMT).
Figure 2.
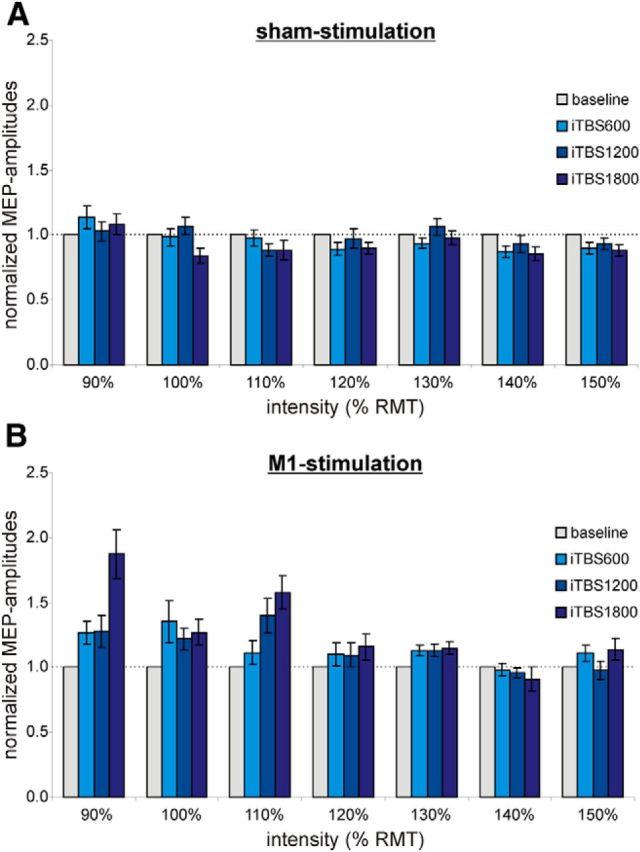
Main experiment: MEP amplitudes normalized to baseline (gray) at different stimulation intensities relative to the RMT. A, sham stimulation. B, M1 stimulation. Dose-dependent iTBS aftereffects seem to be more pronounced at near-threshold stimulation intensities (90%–110% of the RMT) compared with higher stimulation intensities (120%–150% of the RMT).
To further explore what drives the significant interaction effect intervention × dose, we performed post hoc t tests on MEPs averaged across intensities for a given block of iTBS. This analysis showed that averaged MEP amplitudes were significantly higher after M1-iTBS compared with sham-iTBS for all doses: iTBS600 (p = 0.019), iTBS1200 (p = 0.040), and iTBS1800 (p = 0.002) (Fig. 3). Furthermore, aftereffects of M1-iTBS were significantly enhanced for iTBS1800 compared with iTBS1200 (p = 0.042) and iTBS600 (p = 0.024), whereas there was no significant difference between iTBS600 and iTBS1200 (p = 0.390). In the sham condition, MEPs decreased after iTBS1800 compared with iTBS1200 (p = 0.023) (Fig. 3). There was no significant difference between iTBS600 and iTBS1200 as well as iTBS1800 after sham stimulation.
Figure 3.

Main experiment: M1 versus sham stimulation. Changes in MEP amplitudes after M1 (squares) and sham stimulation (diamonds), normalized to baseline MEP amplitudes. Significant aftereffects after M1-iTBS compared with sham-iTBS or within stimulation conditions: *p ≤ 0.05 (Student's t test); **p ≤ 0.001 (Student's t test). M1-iTBS led to a significant increase in MEP amplitudes after iTBS600, iTBS1200, and iTBS1800 compared with sham stimulation and baseline. The increase after M1-iTBS1800 was significantly higher than that after M1-iTBS600 and M1-iTBS1200, whereas after sham-iTBS MEP amplitudes significantly decreased between iTBS1200 and iTBS1800.
In addition, to test whether increases in MEP amplitudes after M1 stimulation were significantly different from baseline, we computed one-sample t tests on the respective differences for each stimulation session. We found that normalized MEP amplitudes after 600 (p = 0.047) and 1800 (p = 0.013) pulses of iTBS over M1 were significantly higher compared with baseline and that a strong statistical trend was evident after 1200 pulses of M1-iTBS (p = 0.052). When computing t tests on absolute MEP amplitudes, significant differences were also observed between baseline MEPs and iTBS1800 (p < 0.01), whereas differences between baseline and iTBS600 and iTBS1200 did not pass the statistical thresholds. This result can be explained by the large amount of between-subject variance in absolute MEP amplitudes at baseline (range: 0.2–2.2 mV), highlighting the importance of normalization for detecting stimulation aftereffects (Huang et al., 2005, 2008; Gentner et al., 2008).
Averaged R2 values indicated a good fit of the stimulus–response curves to the linear regression models (M1 stimulation: R2 = 0.86 ± 0.02, sham stimulation: R2 = 0.87 ± 0.03). To test whether stimulation over M1 altered the steepness of the stimulus–response curves, the slopes of the individual stimulus–response curves were entered into a repeated-measures ANOVA. However, this analysis did not show a significant effect of the factor dose (4 levels: baseline, iTBS600, iTBS1200, and iTBS1800), indicating that increasing the number of iTBS pulses had no effect on the slope of the stimulus–response curves.
Supplemental control experiment
Six subjects, who also participated in the main experiment, were invited to a second experiment in which they received only one iTBS block over M1 followed by two sham stimulations over the parieto-occipital vertex (supplemental control experiment; Fig. 1B). Here, we found a significant increase in MEP amplitudes compared with baseline after the first stimulation block (p = 0.018, Student's t test; Fig. 4). Likewise, when replotting data from the main experiment, MEP amplitudes were significantly increased after one iTBS block over M1 compared with baseline for the same subjects (n = 6, p = 0.024). Accordingly, there was no significant difference between the main experiment and the control experiment after the first iTBS block (p = 0.445). As expected, in the control experiment, MEP amplitudes decreased after the second block of iTBS (now applied over the vertex for control; p = 0.069, iTBS1200 compared with iTBS600) and were no longer significantly different from baseline. Still, there was no significant difference between the main experiment and the control experiment after two iTBS blocks (p = 0.104). However, when directly comparing MEP amplitudes after three stimulation blocks between the main experiment and the control experiment, we found significantly higher amplitudes after three iTBS blocks over M1 compared with one iTBS block over M1 followed by two sham stimulations (p = 0.050). Therefore, our data suggest that aftereffects after iTBS1800 over M1 did not result from delayed effects induced by the first M1-iTBS block but indeed reflected additive effects resulting from repeated M1 stimulation.
Figure 4.

Supplemental control experiment: M1 versus supplemental control stimulation. Changes in MEP amplitudes after M1 (squares) and supplemental control stimulation (diamonds), normalized to baseline MEP amplitudes. *Significant aftereffects after M1-iTBS compared with supplemental control stimulation or baseline (p ≤ 0.05, Student's t test). One stimulation over M1 in the supplemental control experiment led to comparable results as obtained after M1-iTBS600 in the main experiment. After three blocks of iTBS over M1 (M1-iTBS1800), MEP amplitudes were significantly higher compared with one M1 stimulation followed by two stimulations over the parieto-occipital vertex.
iTBS aftereffects on rsFC
Main experiment
The seed-based whole-brain group analysis showed significant positive coupling of the stimulated M1 with a bihemispheric motor network comprising M1 and premotor areas as well as parts of the somatosensory and superior parietal cortex. Baseline measurements were not significantly different between M1 and sham stimulation sessions. Aftereffects of iTBS on M1 rsFC were tested by subtracting the individual baseline whole-brain images from images obtained after 600, 1200, and 1800 pulses. The flexible factorial analysis revealed that, compared with sham stimulation, iTBS over M1 was associated with a significantly stronger increase in rsFC between M1 and various sensorimotor regions. Local maxima were situated in bilateral SMA and dPMC (superior frontal sulcus) across all iTBS blocks and less consistently in parts of the somatosensory and superior parietal cortex (p ≤ 0.05, cluster level FWE-corrected; Fig. 5A). In contrast, functional connectivity within the visual network was not influenced by iTBS over M1 or the vertex for either session. This finding indicates that iTBS over M1 did not lead to global (i.e., brainwide) changes in resting-state connectivity. Rather, stimulation effects remained within the stimulated M1 network.
Figure 5.

Changes in rsFC. M1 compared with sham stimulation, normalized to baseline values. Color bar represents t values. Only clusters surviving a cluster level FWE correction (p ≤ 0.05) are shown. A, Main experiment. M1-iTBS led to significantly higher changes in rsFC of M1 with bilateral premotor areas (dPMC, SMA) after all doses as well as with somatosensory and superior parietal cortex. B, Supplemental control experiment. iTBS1800 over M1 led to significantly higher correlations in the time courses between M1 and premotor areas (dPMC, SMA) as well as somatosensory/superior parietal cortex compared with a single M1-iTBS application followed by two sham stimulations over the vertex (supplemental control stimulation).
We next tested for dose-dependent effects in a priori defined motor ROIs. We found significant effects for rsFC between the stimulated M1 and ipsilateral dPMC: the increase in M1-dPMC connectivity was significantly higher after iTBS1800 compared with iTBS600 and iTBS1200 (p ≤ 0.05, small-volume FWE-corrected on the voxel level; Fig. 6). Furthermore, the increase in rsFC after M1-iTBS1800 was also significantly higher compared with sham stimulation (iTBS1800 vs iTBS600: p = 0.027, iTBS1800 vs iTBS1200: p ≤ 0.001 small-volume FWE-corrected on the voxel level). No significant difference was found between iTBS600 and iTBS1200 within and between stimulation conditions. Hence, an additional increase in rsFC between M1 and ipsilateral dPMC was only evident after iTBS1800 compared with iTBS600 and iTBS1200, but not between iTBS600 and iTBS1200. No dose-dependent changes were observed for rsFC between the stimulated M1 and contralateral dPMC as well as bilateral SMA and contralateral M1.
Figure 6.

ROI analysis. Dose-dependent changes in rsFC. Contrasts between the increase in rsFC compared with baseline between iTBS1800 and (A) iTBS600 or (B) iTBS1200. Color bar represents t values. The cross indicates the coordinate where dose-dependent increases were found for ipsilateral dPMC-M1 rsFC. p ≤ 0.05, small-volume FWE-corrected at the voxel level.
Supplemental control experiment
In the supplemental control experiment, six subjects received only one iTBS block over M1 followed by two sham stimulations over the parieto-occipital vertex. Here, the whole-brain group analysis revealed a stronger increase in connectivity between M1 and bilateral SMA, dPMC, and parts of the somatosensory and superior parietal cortex after 1800 pulses in the main experiment (3 × M1 stimulation) compared with 1800 pulses in the control experiment (one iTBS block over M1 followed by two sham stimulations) (p = 0.048, cluster level FWE-corrected; Fig. 5B). There was no significant difference between the main experiment (replotted data for n = 6) and the control experiment regarding iTBS600 and iTBS1200. Similar to our findings regarding MEP data, these results suggest that aftereffects after iTBS1800 over M1 did not result from delayed effects induced by the first M1-iTBS block but indeed reflected additive effects resulting from repeated M1 stimulation.
In summary, our data suggest that iTBS applied over M1 induced an increase of rsFC between the stimulated M1 and premotor areas compared with both baseline and sham stimulation. Furthermore, connectivity between M1 and the ipsilateral dPMC also depended on the number of stimuli applied.
Correlation between MEP amplitudes and rsFC
Increases in MEP amplitudes observed between M1-iTBS1800 and M1-iTBS600 or M1-iTBS1200 did not correlate with changes in rsFC within the sensorimotor network (p > 0.05, FWE-corrected for each correlation). This implies that changes in MEPs (representing changes at the local level) were not directly related to changes in connectivity of interconnected areas at the systems level after M1-iTBS.
Discussion
Summary of findings
In line with our hypotheses, we found that the application of three blocks of iTBS over M1 resulted in a significant increase of cortical excitability (as reflected by MEP amplitudes) compared with sham stimulation over the vertex. Importantly, an additive increase in MEP amplitudes was only observed after the third, but not the second block of iTBS. Furthermore, rsFC increased after iTBS between the stimulated M1 and premotor areas (i.e., dPMC and SMA), and with areas of the somatosensory and superior parietal cortex. Here, our data also revealed dose-specific changes after three blocks of iTBS between the stimulated M1 and ipsilateral dPMC. However, dose-dependent changes in excitability did not correlate with changes in motor network rsFC, suggesting that iTBS-induced aftereffects observed at the electrophysiological level and neural network level are based, at least in part, upon differential neurobiological mechanisms.
iTBS aftereffects on cortical excitability and their dose dependency
The application of rTMS offers the opportunity to noninvasively modulate motor–cortical excitability. Huang et al. (2005) introduced the iTBS protocol, which offers the advantage of enhancing cortical excitability for ∼20 min using rather low stimulation intensities applied over a short period of time. Other groups have already aimed at amplifying iTBS aftereffects by increasing the number of iTBS stimuli. For example, Gamboa and colleagues (2010, 2011) doubled the number of pulses (2 × 600) but did not find a further increase of facilitatory aftereffects across different intersession intervals (0, 2, 5, 20 min), compared with 600 pulses. We observed a similar effect in the present study as there was no additional increase in MEP amplitudes after two blocks of iTBS (Fig. 3). Importantly, however, a third block of iTBS led to a further increase in MEP amplitudes. In contrast to earlier studies, we did not observe decreases in cortical excitability after repeated application of iTBS (Gamboa et al., 2010, 2011).
Homeostatic metaplasticity
One frequently used model for explaining the aftereffects of (multiple) rTMS sessions is the Bienenstock-Cooper-Munro (BCM) theory (Bienenstock et al., 1982). Accordingly, increased levels of postsynaptic activity (i.e., long-term potentiation [LTP]) after stimulation are assumed to favor the induction of long-term depression (LTD) by the next stimulation, thereby preventing an excessive buildup of LTD or LTP. Such activation history-dependent effects (“homeostatic metaplasticity”) of neuronal ensembles might also underlie rTMS/iTBS aftereffects (Ziemann and Siebner, 2008). Hence, enhancing cortical excitability within the motor cortex via rTMS/iTBS might cause a concurrent increase in the threshold for inducing further synaptic plasticity (LTP-like effects). Such metaplastic effects might explain that two blocks of iTBS did not lead to a further increase of excitability (as observed in Gamboa et al., 2010, 2011 and also in the present study). However, the finding that 1800 pulses of iTBS caused an additional increase in cortical excitability can only be explained by overcoming the homeostatic threshold for inducing LTP-like synaptic plasticity after multiple stimulations.
Dose-dependent effects: cellular level
One potential biological mechanism underlying activation history-dependent effects of iTBS might lie in dose-dependent modifications of inhibitory systems (Di Lazzaro et al., 2005; Stagg et al., 2009; Funke and Benali, 2011). Hamada et al. (2013) suggested that individual differences in iTBS-induced plasticity arise from the distinct recruitment of inhibitory interneurons. Further support for the involvement of inhibitory cortical systems stems from animal studies reporting that TBS alters the expression-patterns of calcium-binding proteins parvalbumin and calbindin. The latter are likely to reflect activity changes within subgroups of GABAergic inhibitory interneurons in the rat cortex (Benali et al., 2011; Funke and Benali, 2011), which can be induced by iTBS and become most effective 20–40 min after iTBS (Hoppenrath and Funke, 2013). Furthermore, a recent study reported dose-specific aftereffects of multiple iTBS applications on the activity of distinct subgroups of interneurons of the rat cortex (Volz et al., 2013). Interestingly, the largest subgroup of these interneurons (i.e., parvalbumin-positive neurons) was significantly affected after ≥1800 pulses. Thus, a dose-dependent decrease of inhibitory interneuron activity could underlie the increase in cortical excitability after iTBS1800. Additionally, compensatory effects evoked by the first block of iTBS were shown to be attenuated after further stimulation. For example, the expression of GAD65, a marker reflecting the level of synaptic GABA secretion (Soghomonian and Martin, 1998), was initally increased after iTBS600, possibly compensating for less somatic activity (e.g., decrease of parvalbumin). However, GAD65 expression did not further increase after additional blocks of iTBS (Volz et al., 2013). Therefore, further LTP-like effects of the second iTBS block might have been prevented or even reversed into LTD-like effects, as suggested by the BCM rule for homeostatic plasticity, e.g., resulting from saturation effects of LTP-promoting mechanisms or changes in inhibitory interneuron activity (e.g., GAD65 expression). Finally, the effects of a third iTBS block might also still be weakened because of homeostatic plasticity, but a simultaneous decrease in cortical inhibition (e.g., parvalbumin expression) might permit a further potentiation of facilitating aftereffects. Given the similarity in stimulation protocols and intersession interval (compare Figs. 1–3), such effects would nicely explain the dose-dependent findings of the present study.
Dose-dependent effects at near-threshold MEPs
Interestingly, we found that dose-dependent effects of iTBS seem to be more pronounced when evoking MEPs with near-threshold intensities (i.e., 90%–110%; Fig. 2). At high intensities, TMS directly activates the axons of corticospinal neurons (Di Lazzaro et al., 2008). Such “D-waves” are not modified by changes in cortical excitability (Di Lazzaro et al., 2012), explaining the relatively small effect of iTBS on high-intensity MEPs observed in the present study. In contrast, near-threshold TMS activates corticospinal neurons transsynaptically via axonal projections of interneurons. Therefore, a predominant effect of iTBS on near-threshold MEPs nicely fits our hypothesis on dose-dependent iTBS aftereffects possibly resulting from differential effects on distinct interneurons.
iTBS aftereffects on rsFC
Previous studies combining rTMS with resting-state fMRI already reported alterations of rsFC between the stimulated region and other brain regions after rTMS (Vercammen et al., 2010; Eldaief et al., 2011; van der Werf et al., 2010). Our data show that iTBS over M1 increases rsFC between the stimulated M1 and premotor areas (i.e., dPMC and SMA), as well as areas of the somatosensory and superior parietal cortex (Fig. 5). Importantly, this finding was specific for the stimulated motor network, as no changes were found in connectivity of the visual system. A similar anatomical selectivity has been reported in studies by showing that lesion-induced connectivity changes in one network do not spread over to other networks (Nomura et al., 2010; Sharma et al., 2009).
A possible explanation for iTBS-induced increases in rsFC might be the simultaneous induction of neural activity in the entire motor network during stimulation of M1. Previous studies frequently reported rTMS-induced changes in neural activity to be not exclusively local, but also to extend to remote, interconnected areas (Paus and Wolforth, 1998; Siebner et al., 2000; Bestmann et al., 2003, 2004, 2005; Suppa et al., 2008; Cárdenas-Morales et al., 2011). Activity changes in connected regions after iTBS might result from activity conduction by corticocortical fibers. The regions that showed increased M1-rsFC after iTBS (Fig. 5) are known to be densely connected to M1 (Stepniewska et al., 1993; Geyer et al., 2000). Such structural connections might facilitate coactivation of interconnected regions, thereby modulating the synchronicity of neural activity between interconnected areas. Support for this hypothesis stems from studies using repetitive applications of paired-associative stimulation protocols. Here, consecutive trials of paired-associative stimulation over M1 and posterior parietal cortex have been shown to increase functional connectivity between these two stimulation sites (Veniero et al., 2013). At a functional level, increased coherence of brain activity may represent an important neurophysiological mechanism enforcing communication between two areas that interact via concurrent input and output channels (Fries, 2005). Thus, an increase in coherence of brain activity after the simultaneous activation of interconnected brain areas by iTBS might underlie increased rsFC in our study.
However, our data revealed no direct correlation between individual changes in cortical excitability and rsFC. Thus, altered resting-state connectivity of the stimulated area does not seem to be linked to rTMS/iTBS-induced changes of excitability on the level of single subjects. The reason for this remains speculative (e.g., interindividual variability, different sessions, nonlinear aftereffects). However, it should be noted that numerous previous studies have also found absent (or only rather weak) correlations between rTMS-induced changes in excitability and aftereffects on the behavioral level (Ragert et al., 2008; Stefan et al., 2008; Zeller et al., 2012). This implies that, despite significant effects on the group level, the individual magnitude of aftereffects regarding cortical excitability cannot be reliably used to predict more “complex” (behavioral) rTMS aftereffects.
Limitations
We can currently only speculate about the cellular mechanisms underlying dose-dependent aftereffects. In humans, two noninvasive techniques have previously been used to assess cortical GABAergic inhibition (i.e., cortical GABA concentration via magnetic resonance spectroscopy) (Stagg et al., 2009) or GABA-dependent short-interval intracortical inhibition via double-pulse TMS (Kujirai et al., 1993). However, magnetic resonance spectroscopy or short-interval intracortical inhibition are not capable of differentiating between distinct subpopulations of GABAergic inhibitory interneurons. As outlined above, this information would be essential as animal studies reported opposing effects on somatic GABA concentration (e.g., reflected by decreased GAD67 levels) and synaptic GABA concentration (e.g., reflected by increased GAD65 levels) to underlie the evolution of dose-dependent iTBS effects.
It could well be that functional connectivity in the activated motor system (i.e., during a motor task) would have been a better predictor of excitability aftereffects (Cárdenas-Morales et al., 2013). However, for the scope of the present study (dose-dependent iTBS effects), resting-state measurements seem to be better suited as motor activity before iTBS has rather complex effects on stimulation-induced changes in excitability (Gentner et al., 2008; Silvanto and Pascual-Leone, 2008), which would have strongly biased the results.
Conclusions
In conclusion, our data suggest that the efficiency of iTBS in enhancing cortical excitability can be increased by applying a higher number of stimuli (i.e., 1800, but not 1200) compared with the conventional iTBS protocol in healthy subjects. Interestingly, we found that dose-dependent effects of iTBS seem to be more pronounced when evoking MEPs with near-threshold intensities, supporting the hypothesis of interneuron networks underlying iTBS aftereffects. Furthermore, we observed M1-iTBS to impact on rsFC within the motor system, i.e., increasing connectivity of the stimulated M1, particularly with premotor areas (i.e., dPMC, SMA). Here, rsFC between M1 and ipsilateral dPMC increased dose-dependently (after 1800 pulses). However, the significance of dose-dependent rTMS-induced changes in MEPs and rsFC regarding behavioral rTMS effects remains to be further elucidated to fully determine the neuromodulatory potential of iTBS1800 on motor function in health and disease.
Footnotes
This work was supported by Deutsche Forschungsgemeinschaft Grants GR 3285/2-1, GR3285/5-1, and KFO219-TP8 to C.G., National Institutes of Health Grant R01-MH074457-01A1 to S.B.E., Deutsche Forschungsgemeinschaft Grants EI 816/4-1 and LA 3071/3-1, the Helmholtz Initiative on Systems Biology, and the European EFT program (Human Brain Project). G.R.F. was supported by the Marga and Walter Boll Stiftung. We thank our volunteers and Dr. Marc Tittgemeyer and the MR staff of the Max Planck Institute for Neurological Research for support.
The authors declare no competing financial interests.
References
- Ashburner J, Friston KJ. Unified segmentation. Neuroimage. 2005;26:839–851. doi: 10.1016/j.neuroimage.2005.02.018. [DOI] [PubMed] [Google Scholar]
- Benali A, Trippe J, Weiler E, Mix A, Petrasch-Parwez E, Girzalsky W, Eysel UT, Erdmann R, Funke K. Theta burst transcranial magnetic stimulation alters cortical inhibition. J Neurosci. 2011;31:1193–1203. doi: 10.1523/JNEUROSCI.1379-10.2011. [DOI] [PMC free article] [PubMed] [Google Scholar]
- Bestmann S, Baudewig J, Siebner HR, Rothwell JC, Frahm J. Subthreshold high-frequency TMS of human primary motor cortex modulates interconnected frontal motor areas as detected by interleaved fMRI-TMS. Neuroimage. 2003;20:1685–1696. doi: 10.1016/j.neuroimage.2003.07.028. [DOI] [PubMed] [Google Scholar]
- Bestmann S, Baudewig J, Siebner HR, Rothwell JC, Frahm J. Functional MRI of the immediate impact of transcranial magnetic stimulation on cortical and subcortical motor circuits. Eur J Neurosci. 2004;19:1950–1962. doi: 10.1111/j.1460-9568.2004.03277.x. [DOI] [PubMed] [Google Scholar]
- Bestmann S, Baudewig J, Siebner HR, Rothwell JC, Frahm J. BOLD MRI responses to repetitive TMS over human dorsal premotor cortex. Neuroimage. 2005;28:22–29. doi: 10.1016/j.neuroimage.2005.05.027. [DOI] [PubMed] [Google Scholar]
- Bienenstock EL, Cooper LN, Munro PW. Theory for the development of neuron selectivity: orientation specificity and binocular interaction in visual cortex. J Neurosci. 1982;2:32–48. doi: 10.1523/JNEUROSCI.02-01-00032.1982. [DOI] [PMC free article] [PubMed] [Google Scholar]
- Cárdenas-Morales L, Grön G, Kammer T. Exploring the aftereffects of theta burst magnetic stimulation on the human motor cortex: a functional imaging study. Hum Brain Mapp. 2011;32:1948–1960. doi: 10.1002/hbm.21160. [DOI] [PMC free article] [PubMed] [Google Scholar]
- Cárdenas-Morales L, Volz LJ, Michely J, Rehme AK, Pool EM, Nettekoven C, Eickhoff SB, Fink GR, Grefkes C. Network connectivity and individual responses to brain stimulation in the human motor system. Cereb Cortex. 2013 doi: 10.1093/cercor/bht023. doi: 10.1093/cercor/bht023. Advance online publication. Retrieved Feb. 8, 2013. [DOI] [PubMed] [Google Scholar]
- Carroll TJ, Riek S, Carson RG. Reliability of the input–output properties of the cortico-spinal pathway obtained from transcranial magnetic and electrical stimulation. J Neurosci Methods. 2001;112:193–202. doi: 10.1016/S0165-0270(01)00468-X. [DOI] [PubMed] [Google Scholar]
- Chen R, Tam A, Bütefisch C, Corwell B, Ziemann U, Rothwell JC, Cohen LG. Intracortical inhibition and facilitation in different representations of the human motor cortex. J Neurophysiol. 1998;80:2870–2881. doi: 10.1152/jn.1998.80.6.2870. [DOI] [PubMed] [Google Scholar]
- Di Lazzaro V, Oliviero A, Pilato F, Saturno E, Dileone M, Mazzone P, Insola A, Tonali PA, Rothwell JC. The physiological basis of transcranial motor cortex stimulation in conscious humans. Clin Neurophysiol. 2004;115:255–266. doi: 10.1016/j.clinph.2003.10.009. [DOI] [PubMed] [Google Scholar]
- Di Lazzaro V, Pilato F, Saturno E, Oliviero A, Dileone M, Mazzone P, Insola A, Tonali PA, Ranieri F, Huang YZ, Rothwell JC. Theta burst repetitive transcranial magnetic stimulation suppresses specific excitatory circuits in the human motor cortex. J Physiol. 2005;565:945–950. doi: 10.1113/jphysiol.2005.087288. [DOI] [PMC free article] [PubMed] [Google Scholar]
- Di Lazzaro V, Pilato F, Dileone M, Profice P, Oliviero A, Mazzone P, Insola A, Ranieri F, Meglio M, Tonali PA, Rothwell JC. The physiological basis of the effects of intermittent theta burst stimulation of the human motor cortex. J Physiol. 2008;586:3871–3879. doi: 10.1113/jphysiol.2008.152736. [DOI] [PMC free article] [PubMed] [Google Scholar]
- Di Lazzaro V, Profice P, Ranieri F, Capone F, Dileone M, Oliviero A, Pilato F. I-wave origin and modulation. Brain Stimul. 2012;5:512–525. doi: 10.1016/j.brs.2011.07.008. [DOI] [PubMed] [Google Scholar]
- Eickhoff SB, Grefkes C. Approaches for the integrated analysis of structure, function and connectivity of the human brain. Clin EEG Neurosci. 2011;42:107–121. doi: 10.1177/155005941104200211. [DOI] [PMC free article] [PubMed] [Google Scholar]
- Eickhoff SB, Stephan KE, Mohlberg H, Grefkes C, Fink GR, Amunts K, Zilles K. A new SPM toolbox for combining probabilistic cytoarchitectonic maps and functional imaging data. Neuroimage. 2005;25:1325–1335. doi: 10.1016/j.neuroimage.2004.12.034. [DOI] [PubMed] [Google Scholar]
- Eldaief MC, Halko MA, Buckner RL, Pascual-Leone A. Transcranial magnetic stimulation modulates the brain's intrinsic activity in a frequency-dependent manner. Proc Natl Acad Sci U S A. 2011;108:21229–21234. doi: 10.1073/pnas.1113103109. [DOI] [PMC free article] [PubMed] [Google Scholar]
- Fries P. A mechanism for cognitive dynamics: neuronal communication through neuronal coherence. Trends Cogn Sci. 2005;9:474–480. doi: 10.1016/j.tics.2005.08.011. [DOI] [PubMed] [Google Scholar]
- Funke K, Benali A. Modulation of cortical inhibition by rTMS: findings obtained from animal models. J Physiol. 2011;589:4423–4435. doi: 10.1113/jphysiol.2011.206573. [DOI] [PMC free article] [PubMed] [Google Scholar]
- Gamboa OL, Antal A, Moliadze V, Paulus W. Simply longer is not better: reversal of theta burst aftereffect with prolonged stimulation. Exp Brain Res. 2010;204:181–187. doi: 10.1007/s00221-010-2293-4. [DOI] [PMC free article] [PubMed] [Google Scholar]
- Gamboa OL, Antal A, Laczo B, Moliadze V, Nitsche MA, Paulus W. Impact of repetitive theta burst stimulation on motor cortex excitability. Brain Stimul. 2011;4:145–151. doi: 10.1016/j.brs.2010.09.008. [DOI] [PubMed] [Google Scholar]
- Gentner R, Wankerl K, Reinsberger C, Zeller D, Classen J. Depression of human corticospinal excitability induced by magnetic theta burst stimulation: evidence of rapid polarity-reversing metaplasticity. Cereb Cortex. 2008;18:2046–2053. doi: 10.1093/cercor/bhm239. [DOI] [PubMed] [Google Scholar]
- Geyer S, Matelli M, Luppino G, Zilles K. Functional neuroanatomy of the primate isocortical motor system. Anat Embryol (Berl) 2000;202:443–474. doi: 10.1007/s004290000127. [DOI] [PubMed] [Google Scholar]
- Grefkes C, Nowak DA, Wang LE, Dafotakis M, Eickhoff SB, Fink GR. Modulating cortical connectivity in stroke patients by rTMS assessed with fMRI and dynamic causal modeling. Neuroimage. 2010;50:233–242. doi: 10.1016/j.neuroimage.2009.12.029. [DOI] [PMC free article] [PubMed] [Google Scholar]
- Hamada M, Murase N, Hasan A, Balaratnam M, Rothwell JC. The role of interneuron networks in driving human motor cortical plasticity. Cereb Cortex. 2013;23:1593–1605. doi: 10.1093/cercor/bhs147. [DOI] [PubMed] [Google Scholar]
- Herwig U, Fallgatter AJ, Höppner J, Eschweiler GW, Kron M, Hajak G, Padberg F, Naderi-Heiden A, Abler B, Eichhammer P, Grossheinrich N, Hay B, Kammer T, Langguth B, Laske C, Plewnia C, Richter MM, Schulz M, Unterecker S, Zinke A, et al. Antidepressant effects of augmentative transcranial magnetic stimulation: randomised multicentre trial. Br J Psychiatry. 2007;191:441–448. doi: 10.1192/bjp.bp.106.034371. [DOI] [PubMed] [Google Scholar]
- Herwig U, Cárdenas-Morales L, Connemann BJ, Kammer T, Schönfeldt-Lecuona C. Sham or real: post hoc estimation of stimulation condition in a randomized transcranial magnetic stimulation trial. Neurosci Lett. 2010;471:30–33. doi: 10.1016/j.neulet.2010.01.003. [DOI] [PubMed] [Google Scholar]
- Hoppenrath K, Funke K. Time-course of changes in neuronal activity markers following iTBS-TMS of the rat neocortex. Neurosci Lett. 2013;536:19–23. doi: 10.1016/j.neulet.2013.01.003. [DOI] [PubMed] [Google Scholar]
- Huang YZ, Edwards MJ, Rounis E, Bhatia KP, Rothwell JC. Theta burst stimulation of the human motor cortex. Neuron. 2005;45:201–206. doi: 10.1016/j.neuron.2004.12.033. [DOI] [PubMed] [Google Scholar]
- Huang YZ, Chen RS, Rothwell JC, Wen HY. The aftereffect of human theta burst stimulation is NMDA receptor dependent. Clin Neurophysiol. 2007;118:1028–1032. doi: 10.1016/j.clinph.2007.01.021. [DOI] [PubMed] [Google Scholar]
- Huang YZ, Rothwell JC, Edwards MJ, Chen RS. Effect of physiological activity on an NMDA-dependent form of cortical plasticity in human. Cereb Cortex. 2008;18:563–570. doi: 10.1093/cercor/bhm087. [DOI] [PubMed] [Google Scholar]
- Jakobs O, Langner R, Caspers S, Roski C, Cieslik EC, Zilles K, Laird AR, Fox PT, Eickhoff SB. Across-study and within-subject functional connectivity of a right temporo-parietal junction subregion involved in stimulus-context integration. Neuroimage. 2012;60:2389–2398. doi: 10.1016/j.neuroimage.2012.02.037. [DOI] [PMC free article] [PubMed] [Google Scholar]
- Kobayashi M, Hutchinson S, Théoret H, Schlaug G, Pascual-Leone A. Repetitive TMS of the motor cortex improves ipsilateral sequential simple finger movements. Neurology. 2004;62:91–98. doi: 10.1212/WNL.62.1.91. [DOI] [PubMed] [Google Scholar]
- Kujirai T, Caramia MD, Rothwell JC, Day BL, Thompson PD, Ferbert A, Wroe S, Asselman P, Marsden CD. Corticocortical inhibition in human motor cortex. J Physiol. 1993;471:501–519. doi: 10.1113/jphysiol.1993.sp019912. [DOI] [PMC free article] [PubMed] [Google Scholar]
- Nomura EM, Gratton C, Visser RM, Kayser A, Perez F, D'Esposito M. Double dissociation of two cognitive control networks in patients with focal brain lesions. Proc Natl Acad Sci U S A. 2010;107:12017–12022. doi: 10.1073/pnas.1002431107. [DOI] [PMC free article] [PubMed] [Google Scholar]
- Oldfield RC. The assessment and analysis of handedness: the Edinburgh inventory. Neuropsychologia. 1971;9:97–113. doi: 10.1016/0028-3932(71)90067-4. [DOI] [PubMed] [Google Scholar]
- Pascual-Leone A, Tormos JM, Keenan J, Tarazona F, Cañete C, Catalá MD. Study and modulation of human cortical excitability with transcranial magnetic stimulation. J Clin Neurophysiol. 1998;15:333–343. doi: 10.1097/00004691-199807000-00005. [DOI] [PubMed] [Google Scholar]
- Pascual-Leone A, Amedi A, Fregni F, Merabet LB. The plastic human brain cortex. Annu Rev Neurosci. 2005;28:377–401. doi: 10.1146/annurev.neuro.27.070203.144216. [DOI] [PubMed] [Google Scholar]
- Paus T, Wolforth M. Transcranial magnetic stimulation during PET: reaching and verifying the target site. Hum Brain Mapp. 1998;6:399–402. doi: 10.1002/(SICI)1097-0193(1998)6:5/6<399::AID-HBM13>3.0.CO%3B2-H. [DOI] [PMC free article] [PubMed] [Google Scholar]
- Ragert P, Franzkowiak S, Schwenkreis P, Tegenthoff M, Dinse HR. Improvement of tactile perception and enhancement of cortical excitability through intermittent theta burst rTMS over human primary somatosensory cortex. Exp Brain Res. 2008;184:1–11. doi: 10.1007/s00221-007-1122-x. [DOI] [PubMed] [Google Scholar]
- Reetz K, Dogan I, Rolfs A, Binkofski F, Schulz JB, Laird AR, Fox PT, Eickhoff SB. Investigating function and connectivity of morphometric findings: exemplified on cerebellar atrophy in spinocerebellar ataxia 17 (SCA17) Neuroimage. 2012;62:1354–1366. doi: 10.1016/j.neuroimage.2012.05.058. [DOI] [PMC free article] [PubMed] [Google Scholar]
- Ridding MC, Ziemann U. Determinants of the induction of cortical plasticity by non-invasive brain stimulation in healthy subjects. J Physiol. 2010;588:2291–2304. doi: 10.1113/jphysiol.2010.190314. [DOI] [PMC free article] [PubMed] [Google Scholar]
- Sarfeld AS, Diekhoff S, Wang LE, Liuzzi G, Uludað K, Eickhoff SB, Fink GR, Grefkes C. Convergence of human brain mapping tools: neuronavigated TMS parameters and fMRI activity in the hand motor area. Hum Brain Mapp. 2012;33:1107–1123. doi: 10.1002/hbm.21272. [DOI] [PMC free article] [PubMed] [Google Scholar]
- Satterthwaite TD, Elliott MA, Gerraty RT, Ruparel K, Loughead J, Calkins ME, Eickhoff SB, Hakonarson H, Gur RC, Gur RE, Wolf DH. An improved framework for confound regression and filtering for control of motion artifact in the preprocessing of resting-state functional connectivity data. Neuroimage. 2013;64:240–256. doi: 10.1016/j.neuroimage.2012.08.052. [DOI] [PMC free article] [PubMed] [Google Scholar]
- Sharma N, Baron JC, Rowe JB. Motor imagery after stroke: relating outcome to motor network connectivity. Ann Neurol. 2009;66:604–616. doi: 10.1002/ana.21810. [DOI] [PMC free article] [PubMed] [Google Scholar]
- Siebner HR, Peller M, Willoch F, Minoshima S, Boecker H, Auer C, Drzezga A, Conrad B, Bartenstein P. Lasting cortical activation after repetitive TMS of the motor cortex: a glucose metabolic study. Neurology. 2000;54:956–963. doi: 10.1212/WNL.54.4.956. [DOI] [PubMed] [Google Scholar]
- Silvanto J, Pascual-Leone A. State-dependency of transcranial magnetic stimulation. Brain Topogr. 2008;21:1–10. doi: 10.1007/s10548-008-0067-0. [DOI] [PMC free article] [PubMed] [Google Scholar]
- Soghomonian JJ, Martin DL. Two isoforms of glutamate decarboxylase: why? Trends Pharmacol Sci. 1998;19:500–505. doi: 10.1016/S0165-6147(98)01270-X. [DOI] [PubMed] [Google Scholar]
- Stagg CJ, Wylezinska M, Matthews PM, Johansen-Berg H, Jezzard P, Rothwell JC, Bestmann S. Neurochemical effects of theta burst stimulation as assessed by magnetic resonance spectroscopy. J Neurophysiol. 2009;101:2872–2877. doi: 10.1152/jn.91060.2008. [DOI] [PMC free article] [PubMed] [Google Scholar]
- Stefan K, Gentner R, Zeller D, Dang S, Classen J. Theta burst stimulation: remote physiological and local behavioral aftereffects. Neuroimage. 2008;40:265–274. doi: 10.1016/j.neuroimage.2007.11.037. [DOI] [PubMed] [Google Scholar]
- Stepniewska I, Preuss TM, Kaas JH. Architectonics, somatotopic organization, and ipsilateral cortical connections of the primary motor area (M1) of owl monkeys. J Comp Neurol. 1993;330:238–271. doi: 10.1002/cne.903300207. [DOI] [PubMed] [Google Scholar]
- Suppa A, Ortu E, Zafar N, Deriu F, Paulus W, Berardelli A, Rothwell JC. Theta burst stimulation induces aftereffects on contralateral primary motor cortex excitability in humans. J Physiol. 2008;586:4489–4500. doi: 10.1113/jphysiol.2008.156596. [DOI] [PMC free article] [PubMed] [Google Scholar]
- Teo JT, Swayne OB, Rothwell JC. Further evidence for NMDA dependence of the aftereffects of human theta burst stimulation. Clin Neurophysiol. 2007;118:1649–1651. doi: 10.1016/j.clinph.2007.04.010. [DOI] [PubMed] [Google Scholar]
- Terao Y, Ugawa Y. Basic mechanisms of TMS. J Clin Neurophysiol. 2002;19:322–343. doi: 10.1097/00004691-200208000-00006. [DOI] [PubMed] [Google Scholar]
- van der Werf YD, Sanz-Arigita EJ, Menning S, van den Heuvel OA. Modulating spontaneous brain activity using repetitive transcranial magnetic stimulation. BMC Neurosci. 2011;11:145. doi: 10.1186/1471-2202-11-145. [DOI] [PMC free article] [PubMed] [Google Scholar]
- Veniero D, Ponzo V, Koch G. Paired associative stimulation enforces the communication between interconnected areas. J Neurosci. 2013;33:13773–13783. doi: 10.1523/JNEUROSCI.1777-13.2013. [DOI] [PMC free article] [PubMed] [Google Scholar]
- Vercammen A, Knegtering H, Liemburg EJ, den Boer JA, Aleman A. Functional connectivity of the temporo-parietal region in schizophrenia: effects of rTMS treatment of auditory hallucinations. J Psychiatr Res. 2010;44:725–731. doi: 10.1016/j.jpsychires.2009.12.011. [DOI] [PubMed] [Google Scholar]
- Volz LJ, Benali A, Mix A, Neubacher U, Funke K. Dose dependence of changes in cortical protein expression induced with repeated transcranial magnetic theta burst stimulation in the rat. Brain Stimul. 2013;6:598–606. doi: 10.1016/j.brs.2013.01.008. [DOI] [PubMed] [Google Scholar]
- Wassermann EM. Risk and safety of repetitive transcranial magnetic stimulation: report and suggested guidelines from the International Workshop on the Safety of Repetitive Transcranial Magnetic Stimulation, June 5–7, 1996. Electroencephalogr Clin Neurophysiol. 1998;108:1–16. doi: 10.1016/S0168-5597(97)00096-8. [DOI] [PubMed] [Google Scholar]
- Watanabe T, Hanajima R, Shirota Y, Ohminami S, Tsutsumi R, Terao Y, Ugawa Y, Hirose S, Miyashita Y, Konishi S, Kunimatsu A, Ohtomo K. Bidirectional effects on interhemispheric resting-state functional connectivity induced by excitatory and inhibitory repetitive transcranial magnetic stimulation. Hum Brain Mapp. 2014;35:1896–1905. doi: 10.1002/hbm.22300. [DOI] [PMC free article] [PubMed] [Google Scholar]
- Yousry TA, Schmid UD, Alkadhi H, Schmidt D, Peraud A, Buettner A, Winkler P. Localization of the motor hand area to a knob on the precentral gyrus: a new landmark. Brain. 1997;120:141–157. doi: 10.1093/brain/120.1.141. [DOI] [PubMed] [Google Scholar]
- Zafar N, Paulus W, Sommer M. Comparative assessment of best conventional with best theta burst repetitive transcranial magnetic stimulation protocols on human motor cortex excitability. Clin Neurophysiol. 2008;119:1393–1399. doi: 10.1016/j.clinph.2008.02.006. [DOI] [PubMed] [Google Scholar]
- Zeller D, Dang SY, Weise D, Rieckmann P, Toyka KV, Classen J. Excitability decreasing central motor plasticity is retained in multiple sclerosis patients. BMC Neurol. 2012;12:92. doi: 10.1186/1471-2377-12-92. [DOI] [PMC free article] [PubMed] [Google Scholar]
- Ziemann U, Siebner HR. Modifying motor learning through gating and homeostatic metaplasticity. Brain Stimul. 2008;1:60–66. doi: 10.1016/j.brs.2007.08.003. [DOI] [PubMed] [Google Scholar]
- zu Eulenburg P, Caspers S, Roski C, Eickhoff SB. Meta-analytical definition and functional connectivity of the human vestibular cortex. Neuroimage. 2012;60:162–169. doi: 10.1016/j.neuroimage.2011.12.032. [DOI] [PubMed] [Google Scholar]