

Abstract
The “Down syndrome critical region” (DSCR) is a chromosome 21 segment purported to contain genes responsible for many features of Down syndrome (DS), including craniofacial dysmorphology. We used chromosome engineering to create mice that were trisomic or monosomic for only the mouse chromosome segment orthologous to the DSCR and assessed dysmorphologies of the craniofacial skeleton that show direct parallels with DS in mice with a larger segmental trisomy. The DSCR genes were not sufficient and were largely not necessary to produce the facial phenotype. These results refute specific predictions of the prevailing hypothesis of gene action in DS.
Trisomy 21 is among the most complex genetic insults compatible with human survival past term. The genetic complexity and individual variability of DS phenotypes pose a considerable challenge to understanding mechanisms by which development is disrupted in trisomy. The DSCR concept suggesting that most phenotypes are the product of a few dosage-sensitive genes has dominated the field of DS research for three decades, but until now there has been no method for definitive testing of this hypothesis.
DS occurs in 1 out of 700 live births. The disorder is the leading cause of congenital heart disease and the most frequent genetic cause of mental retardation. Characteristic dysmorphology of the face and underlying skeleton, alterations in brain structure, and early onset Alzheimer pathology occur in all individuals with DS, though with variable severity and onset. The occurrence of Hirschsprung’s disease, testicular cancer, and childhood onset leukemia is elevated, and many additional clinical features occur with varying frequency in DS (1).
Rare individuals have chromosome rearrangements resulting in triplication of a subset of HSA21 genes (segmental trisomy 21) (2, 3). Correspondence of the smallest region of overlap among individuals with the same DS features led to the concept that a critical chromosomal region (DSCR) delimited a dosage-sensitive gene or genes that are responsible for various features of DS. The most precise description of the DSCR extends about 5.4 Mb on HSA21 from a proximal boundary between markers D21S17 and D21S55 to a distal boundary between MX1 and BCEI (4, 5). This region has been associated with several major DS phenotypes including facial features that result from dysmorphology of the craniofacial skeleton (6, 7) (fig. S1). The DSCR hypothesis predicts that a gene or genes in this region are sufficient to produce this phenotype.
Several recent developments enable direct testing of the genetic basis for disrupted development in trisomy. Annotation of the finished sequence of HSA21 provides a complete gene catalog (8). Manipulation of the mouse germ line through embryonic stem (ES) cells supports the creation of defined segmental aneuploidies (9). Quantitative assessments of phenotypes with direct parallels between DS and trisomic mice provide readouts for these genetic experiments and suggest that these features arise from perturbations of common evolutionarily derived developmental pathways (10).
Whereas some differences between mouse and human gene content have been reported for HSA21 predicted genes (11), established genes are nearly perfectly conserved in content and order between species (12) (table S1). Ts65Dn mice contain a marker chromosome resulting in segmental trisomy for orthologs of about half of the genes on HSA21. These mice have been used widely in studies relevant to DS and display a variety of phenotypes that parallel or predict those in DS (10).
To assess the contribution of DSCR genes to DS facial features that have been mapped to this region, we generated ES cells carrying a 3.9-Mb reciprocal duplication or deletion (Fig. 1A). This segment contains mouse orthologs of the 33 conserved and minimally conserved genes in the human DSCR (Fig. 2). Cre-mediated recombination between LoxP sites located on different chromosomes was used to produce the duplication and deletion (9) (Fig. 1A).
Fig. 1.
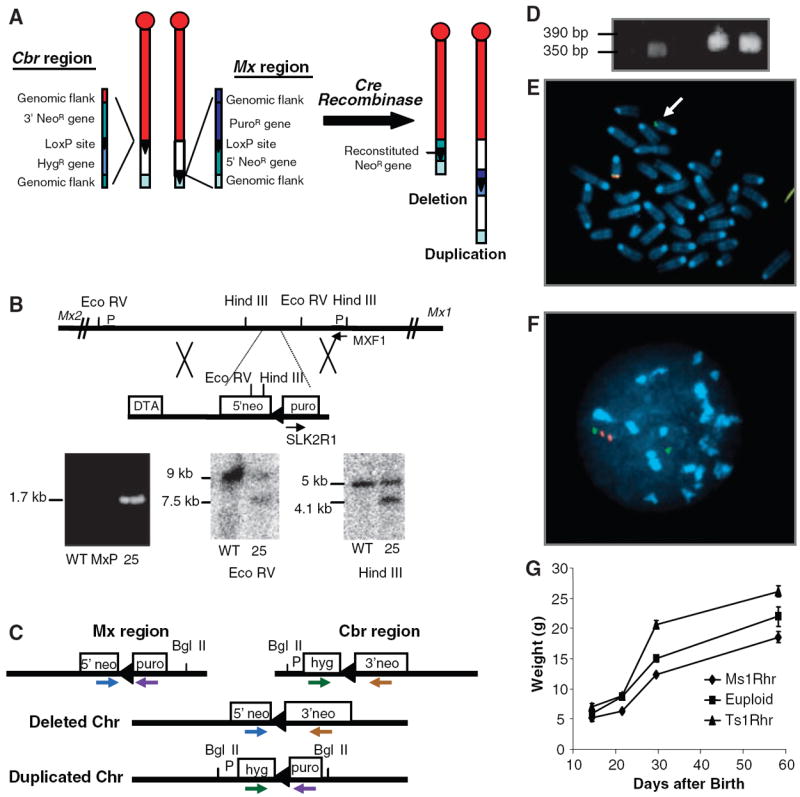
Construction of a duplication or deletion of the MMU16 region orthologous to the DSCR. (A) LoxP sites were targeted to asymmetrical positions on MMU16 at Cbr1 (13) and adjacent to Mx2. Each targeting vector contained a LoxP site (triangle), a selectable antibiotic resistance gene (hyg or puro), and half of the neomycin resistance gene (5′ or 3′ neo). (B) The Mx-Lox vector produced a 1.7-kb PCR product from the targeted allele in line MxP25. Wild-type (WT) and targeted alleles produced 9.0- and 7.5-kb restriction fragments with EcoRV and 5.0- and 4.1-kb fragments with HindIII. Arrows identify PCR primers; P designates probes. (C) PCR primers used to screen vector sequences for recombination after Cre-mediated translocation. (D) PCR products from neor ES lines produced the 350– and 390–base pair (bp) fragments expected for deletion and duplication, respectively. (E) Metaphase FISH with one bacterial artificial chromosome (BAC) that maps to the DSCR (red) and a second BAC proximal to it (green) shows one chromosome with a single green signal (arrow) and a second with green and red plus a yellow signal, indicating overlap. (F) Interphase FISH shows a green signal by itself representing the deleted MMU16 and a green signal with two adjacent red signals representing the duplication. (G) Body weights of Ts1Rhr mice are significantly larger than controls. Standard errors (bars) are indicated.
Fig. 2.
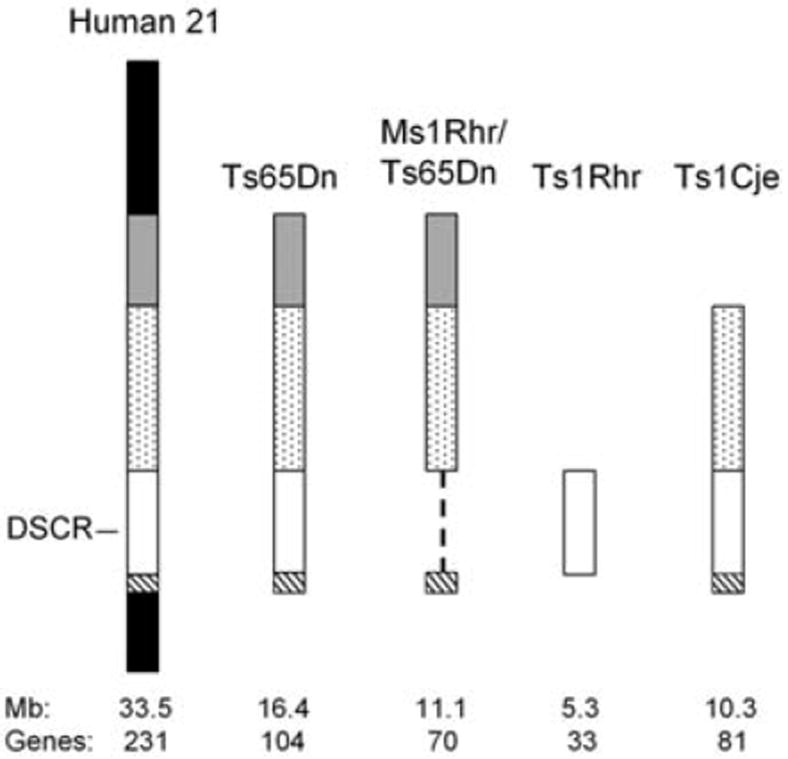
Trisomic segments represented in mouse models relative to HSA21. The DSCR is indicated as an open box where it is present and by a dashed line where it is deleted. Approximate size in megabases of triplicated information is based on genomic sequence; gene number is from Gardiner et al. (11). Gene content for each segment is given in table S1.
Consecutive targeting with homologous recombination vectors containing LoxP sequences established the boundaries for the translocation at Cbr1 (13) and at a site adjacent to the Mx2 gene (Fig. 1B). The targeting vectors were designed so that Cre-mediated recombination between LoxP sites would make cells resistant to G418 (neor). The CAGGS-Cre expression vector was electroporated into doubly targeted ES cells and two neor clones were recovered. The presence of both recombined chromosomes was confirmed by Southern blotting and polymerase chain reaction (PCR) followed by sequencing (Fig. 1, C and D). Metaphase and interphase fluorescence in situ hybridization (FISH) demonstrated the predicted association of signals from the duplicated and deleted chromosomes (Fig. 1, E and F). These karyotypically normal ES lines were injected into blastocysts and one of the resulting chimeras exhibited germline transmission when bred to C57BL/6J (B6) mice. Mice with segmental monosomy due to the deleted MMU16 (Ms1Rhr mice) and with segmental trisomy due to the duplication (Ts1Rhr) were born, and both were fertile.
Ms1Rhr mice were smaller than (B6 × 129)F1 controls from birth to adulthood (Fig. 1G). However, adult Ts1Rhr mice were significantly larger than euploid mice, in contrast to Ts65Dn mice, which were smaller than their euploid littermates (14). Femur length, a commonly used index of body size, was shorter in Ts65Dn mice than in controls, whereas femurs were longer in Ts1Rhr mice than in controls. Short stature in DS is a feature attributed to the DSCR (4, 5). Thus, whereas trisomy for orthologs of about half of the genes on HSA21 produces an effect similar to that in DS in Ts65Dn mice, the opposite effect occurred in Ts1Rhr mice, which were trisomic only for the DSCR.
Anomalies of the skull contribute to the distinctive face in DS. The mandible is small (7), contributing to the characteristic open mouth and protruding tongue, features that have been attributed to trisomy for genes within the DSCR (4, 5). The DS skull shows a compact midface with reduced maxilla and zygomatic bones, and brachycephaly. Ts65Dn mice show specific abnormalities in the mandible and in bones of the face and neurocranium that directly parallel these patterns in DS (6).
These parameters were assessed quantitatively and compared in four mouse models. The Ts1Rhr skull was larger than that of euploid littermates (Fig. 3). These differences were not localized to specific bones of the face or neurocranium but instead demonstrated an overall rostrocaudal elongation of the skull. There was no significant difference between Ts1Rhr and euploid littermates along the mediolateral axis local to the face or neurocranium.
Fig. 3.
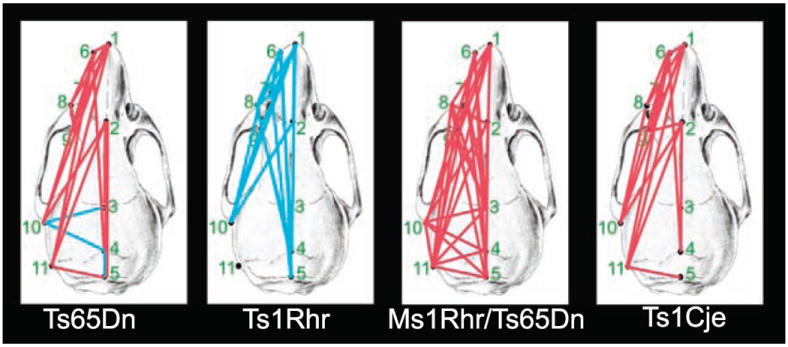
Linear measurements that contribute to dysmorphology in Ts65Dn, Ts1Cje, and Ms1Rhr/Ts65Dn form a closely related set, whereas trisomy for the DSCR alone produces a distinct dysmorphology in Ts1Rhr. Red lines indicate linear distances between landmarks that were significantly smaller in trisomic mice relative to euploid mice; blue lines indicate distances that were larger. Statistical significance was determined using Euclidean Distance Matrix Analysis confidence intervals (17). This is not a simple scaling difference because the magnitude of the differences varies from one measure to another and the set of differences contributing to dysmorphology in Ts1Rhr is different from that in the other models. Landmarks are defined in fig. S3.
These differences contrast sharply with the findings of previous studies of Ts65Dn mice (6). Skulls of Ts65Dn were significantly smaller than euploid littermates. Differences were most pronounced along the rostrocaudal axis local to the bones of the face corresponding with reduced facial dimensions in humans with DS. The reduced rostrocaudal dimension coupled with increased cranial vault width local to the parietal bones produced a brachycephalic skull corresponding with the human condition (Fig. 3).
The mandibles of Ts1Rhr mice were larger overall than mandibles of their euploid littermates. Out of 21 linear distances, 5 were significantly larger in Ts1Rhr, and these converged on the condyle, inferior ramus, and incisive alveolar of the murine mandible (Fig. 4). As was the case for face and skull, this pattern in Ts1Rhr mandibles was in marked contrast to that in Ts65Dn mice, which were significantly smaller overall. Further, differences in Ts65Dn were centered on the coronoid and angular processes (6). The DS mandible is significantly reduced in size as well (7). Direct comparisons between mouse and human mandibles are available for a few dimensions; these show a DS-like pattern in Ts65Dn but not in Ts1Rhr mice (Fig. 4).
Fig. 4.
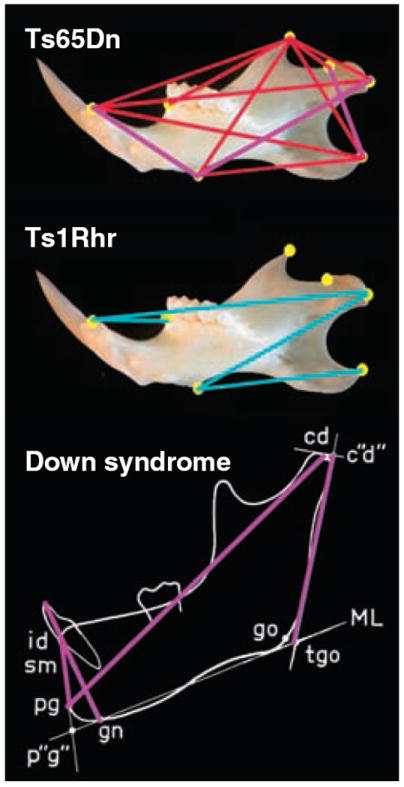
The Ts1Rhr mandible is larger overall and has a distinctly different shape than Ts65Dn. Results of three-dimensional comparative analysis of mandibular shape show those distances between landmarks that are significantly smaller in trisomic mice as red lines, whereas blue lines indicate distances that are larger. Purple lines drawn on the DS and Ts65Dn mandibles are measures that are significantly smaller than those for euploid in both (6, 7) Landmarks are described in fig. S3.
Morphological assessment of the neurocranium, face, and mandible demonstrate that trisomy of only critical region genes is not sufficient to produce the anomalies seen in Ts65Dn mice that parallel those assigned to the DSCR. To determine whether critical region genes are necessary to produce phenotypes mapped to this region, we examined skull morphology of the Ms1Rhr/Ts65Dn mouse. Crossing the Ms1Rhr deletion onto the Ts65Dn background produced mice that were trisomic for about 70% of the genes trisomic in Ts65Dn but had the normal two copies of genes in the critical region (Fig. 2). Similar to Ts65Dn mice and in contrast to Ts1Rhr mice, the skull was significantly smaller than that of euploid littermates in these mice (Fig. 3). Ms1Rhr/Ts65Dn mice did not show disproportionate changes along the rostrocaudal and mediolateral axis (i.e., they did not have brachycephaly). Overall, however, the pattern of dysmorphology in the Ms1Rhr/Ts65Dn craniofacial skeleton was similar to Ts65Dn, whereas the anomalies seen in Ts1Rhr mice were distinctly different. Thus, although genes in the critical region may contribute to skull development, the Ts65Dn pattern is produced substantially without their contribution.
One alternative to the critical region concept suggests that anomalies in DS occur primarily because of disruption of genetic homeostasis and, therefore, the number of triplicated genes rather than their specific functions explain DS phenotypes (15). Thus, Ts1Rhr mice, with only 32% of the trisomic genes in Ts65Dn, should have a mild form of the Ts65Dn phenotype. This was not the case. Furthermore, we compared the craniofacial dysmorphology in Ms1Rhr/Ts65Dn mice, which are trisomic for about 70% of the genes triplicated in Ts65Dn, with that in Ts1Cje segmental trisomic mice (16), which are trisomic for 78% of Ts65Dn genes (Fig. 2). Ts65Dn, Ts1Cje, and Ms1Rhr/Ts65Dn mice showed expansion, no change, and reduction in measures of the middle aspect of the cranial vault, respectively, but the models shared reductions of the face and rostrocaudal aspects of the cranial vault (Fig. 3).
Overall, the Ts65Dn, Ts1Cje, and Ms1Rhr/Ts65Dn face and skull are affected similarly, whereas the pattern produced by three copies of the DSCR alone in Ts1Rhr mice is very different. Statistical analyses of cranial shape in these precisely constructed genetic models show that DSCR genes alone are not sufficient and are largely unnecessary to produce the facial dysmorphology attributed to this region. This result points to interactions among noncontiguous genes that could not have been predicted from or observed in human studies. The critical region concept proposes that a small number of dosage-sensitive genes have large effects on phenotypes when present in three copies. The developmental instability hypothesis considers that nonspecific, small effects of many genes perturb genetic homeostasis. We favor a synthesis of these two hypotheses, which acknowledges that a triplicated gene, the solitary effect of which is inconspicuous, could contribute to a trisomic phenotype in combination with other genes based on the specificity of effects and interactions of these genes.
Supplementary Material
Acknowledgments
We thank J. D. Gearhart for insightful comments, M. Cowan for ES cells and chimeras, and S. South for FISH analysis. This work was supported by a Howard Hughes Predoctoral Fellowship to L.E.O. and by a Public Health Service awards HD38384 and HD24605 (R.H.R.).
Footnotes
Supporting Online Material
www.sciencemag.org/cgi/content/full/306/5696/687/DC1
Materials and Methods
Figs. S1 to S3
Table S1
References
References and Notes
- 1.Cohen WI. Down Syndrome Q. 1999 Sep;4:3. [Google Scholar]
- 2.Niebuhr E. Humangenetik. 1974;21:99. doi: 10.1007/BF00278575. [DOI] [PubMed] [Google Scholar]
- 3.McCormick MK, et al. Genomics. 1989;5:325. doi: 10.1016/0888-7543(89)90065-7. [DOI] [PubMed] [Google Scholar]
- 4.Delabar JM, et al. Eur J Hum Genet. 1993;1:114. doi: 10.1159/000472398. [DOI] [PubMed] [Google Scholar]
- 5.Korenberg JR, et al. Proc Natl Acad Sci U S A. 1994;91:4997. doi: 10.1073/pnas.91.11.4997. [DOI] [PMC free article] [PubMed] [Google Scholar]
- 6.Richtsmeier J, Baxter L, Reeves R. Dev Dyn. 2000;217:137. doi: 10.1002/(SICI)1097-0177(200002)217:2<137::AID-DVDY1>3.0.CO;2-N. [DOI] [PubMed] [Google Scholar]
- 7.Kisling E. Cranial Morphology in Down’s Syndrome: A Comparative Roentgencephalometric Study in Adult Males. Munksgaard; Copenhagen: 1966. [Google Scholar]
- 8.Hattori M, et al. Nature. 2000;405:311. doi: 10.1038/35012518. [DOI] [PubMed] [Google Scholar]
- 9.Ramirez-Solis R, Liu P, Bradley A. Nature. 1995;378:720. doi: 10.1038/378720a0. [DOI] [PubMed] [Google Scholar]
- 10.Reeves R, Baxter L, Richtsmeier J. Trends Genet. 2001;17:83. doi: 10.1016/s0168-9525(00)02172-7. [DOI] [PubMed] [Google Scholar]
- 11.Gardiner K, Fortna A, Bechtel L, Davisson MT. Gene. 2003;318:137. doi: 10.1016/s0378-1119(03)00769-8. [DOI] [PubMed] [Google Scholar]
- 12.Mural RJ, et al. Science. 2002;296:1661. doi: 10.1126/science.1069193. [DOI] [PubMed] [Google Scholar]
- 13.Olson LE, et al. Cancer Res. 2003;63:6602. [PubMed] [Google Scholar]
- 14.Davisson MT. personal communication [Google Scholar]
- 15.Shapiro B. Am J Med Genet. 1983;14:241. doi: 10.1002/ajmg.1320140206. [DOI] [PubMed] [Google Scholar]
- 16.Sago H, et al. Proc Natl Acad Sci U S A. 1998;95:6256. doi: 10.1073/pnas.95.11.6256. [DOI] [PMC free article] [PubMed] [Google Scholar]
- 17.Lele SR, Richtsmeier JT. An Invariant Approach to Statistical Analysis of Shapes. Chapman & Hall/CRC; Boca Raton, FL: 2001. [Google Scholar]
Associated Data
This section collects any data citations, data availability statements, or supplementary materials included in this article.