Abstract
The study of highly photo-excited matter at solid state density is an emerging field of research, which is benefitting the development of free-electron-laser (FEL) technology. We report an extreme ultraviolet (XUV) reflectivity experiment from a titanium (Ti) sample irradiated with ultrafast seeded FEL pulses at variable incident photon fluence and frequency. Using a Drude formalism we relate the observed increase in reflectivity as a function of the excitation fluence to an increase in the plasma frequency, which allows us to estimate the free electron density in the excited sample. The extreme simplicity of the experimental setup makes the present approach potentially a valuable complementary tool to determine the average ionization state of the excited sample, information of primary relevance for understanding the physics of matter under extreme conditions.
The study of matter under extreme thermodynamic conditions is a longstanding and fruitful field of research that has generated a host of applications in fundamental physics and applied cutting-edge technology1,2. In the last few decades increasing efforts have been devoted to studying new states of matter such as strongly coupled plasma and warm dense matter (WDM)3. The latter is characterised by solid-like density and temperatures of a few eV, conditions actually found in astrophysical contexts4 or in devices for plasma creation and inertial confinement fusion5. The advent of ultra-fast/ultra-intense lasers has opened up the possibility to generate and probe such extreme states of matter in transient conditions2,6. However, the capability of optical lasers to probe the excited sample is hampered by the “screening effect” of the excited plasma, which drastically limits the penetration length for photons with frequency (ω) lower than the plasma frequency:
 |
where Ne, e, me and  are the free electron density, the elementary charge, the effective electron mass and the dielectric constant, respectively3,7.
In this context, the development of Free Electron Lasers (FELs) operating in the extreme ultraviolet (XUV) and x-ray spectral ranges represent a landmark result3, since the high energy photons emitted by these sources can penetrate matter at solid densities ensuring uniform excitation of the sample. FEL-based experiments have provided valuable new insights into this field, for example saturable absorption by core electrons at XUV/x-ray wavelengths8 or depression of the ionization potential in solid-density plasma9. Other FEL-based experiments aimed at the determination of the relevant parameters of these highly excited states of matter have been proposed, such as x-ray induced changes in optical reflectivity10,11,12, the parallel pyrometrical characterization of heat waves for the determination of the ion temperature (Ti)13 or Thompson scattering for the determination of both free electron density (Ne) and temperature (Te)14. The latter approach is based on the measurement of the plasmon lineshape in the inelastic scattering spectra of the excited sample. These highly informative experiments rely on the development of sophisticated XUV/x-ray spectrometers and are limited by coherence issues15 and, in high-Z samples, by the low scattering cross-sections14.
Information on the plasma resonance (and thus on the related sample parameters) can be also gained by simpler reflectivity measurements16,17,18. For instance, a shift in ωp upon photo-excitation, observable in Thompson scattering experiments, can be ascribed, through Eq. (1), to a change in Ne. However, the same shift in ωp also leads to a change in the XUV reflectivity. This is illustrated in Fig. 1, which reports the XUV reflectivity (R) of a metal at given values of ω for a typical range in ωp and γ, calculated using the Drude model (here γ is the inverse lifetime of the plasma resonance19,20,21, see Methods for further details). If ω is tuned just above ωp then the dependence of R on ωp is more significant than that on γ. In this case any variation in R can be essentially attributed to a variation in ωp and thus in Ne. Following this idea we performed an XUV reflectivity experiment on a Ti sample as a function of both photon fluence (F) and ω. The experiment was carried out at the TIMEX end-station of the Elastic and Inelastic Scattering (EIS) beamline22,23, exploiting the broad ω-tunability in the low frequency side of the XUV spectrum provided by the FERMI FEL source24,25,26; experimental details are reported in the Methods section.
Figure 1.  ωp-dependence of R for
  ω = 18.9 and 20 eV (black/red lines) and
  γ = 1, 1.5 and 2 eV (higher to lower curves), calculated with Eqs. (3) and (4); the upper horizontal scale is the corresponding range in Ne calculated through Eq. (1).
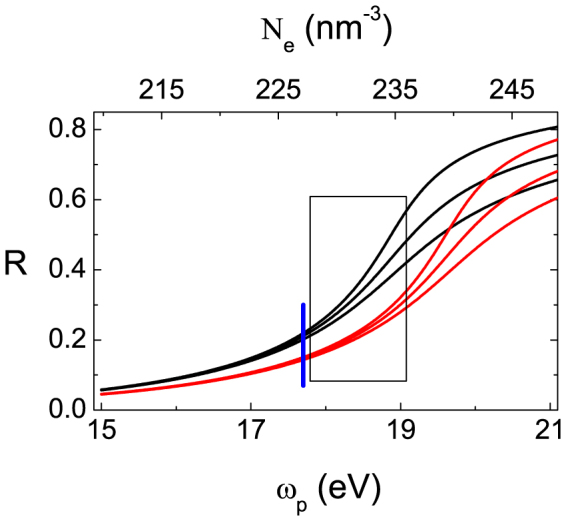
The vertical blue segment indicates the expected value of  ωp =
ωp =  ωp(0) = 17.7 eV for the unexcited Ti sample27,28, while the hatched area sketches the
  ωp-range reached in the excited sample in the exploited F-range.
Results
The dependence of R on F is shown in Fig. 2 for three representative values of  ω and clearly show an increase of reflectivity up to about 40–50% for F-values as large as 20–25 J/cm2. No appreciable changes in R has been observed for F < 0.02 J/cm2 (see the Methods section). Assuming that the increase in Ne (and thus that in ωp) is proportional to the energy density (
 ) deposited into the sample close to the metal surface, it is possible to calculate the F-dependence of R at a given value of ω. For this purpose we used the Drude model to account for metal reflectivity, in which we consider the time and transverse spatial profiles of the FEL pulse and the fractional increase in Ne per unit
  , i.e.:
 |
where  27,28 is the plasma frequency of the unperturbed sample (more details of the model used for the calculations are reported in the Methods section) and A is an empirical constant. Curves reported in Fig. 2 were obtained using A = 7.5 · 1012 m3/J; higher/lower dashed lines correspond to A-value 25% larger/smaller than 7.5 · 1012 m3/J and can be regarded as an estimate of the confidence interval (see Supplemental Information), which roughly matches the deviation of the data from the calculated curves.
Figure 2. F-dependence of R(F)/R(0) for some selected  ω-values, indicated in the individual panels.
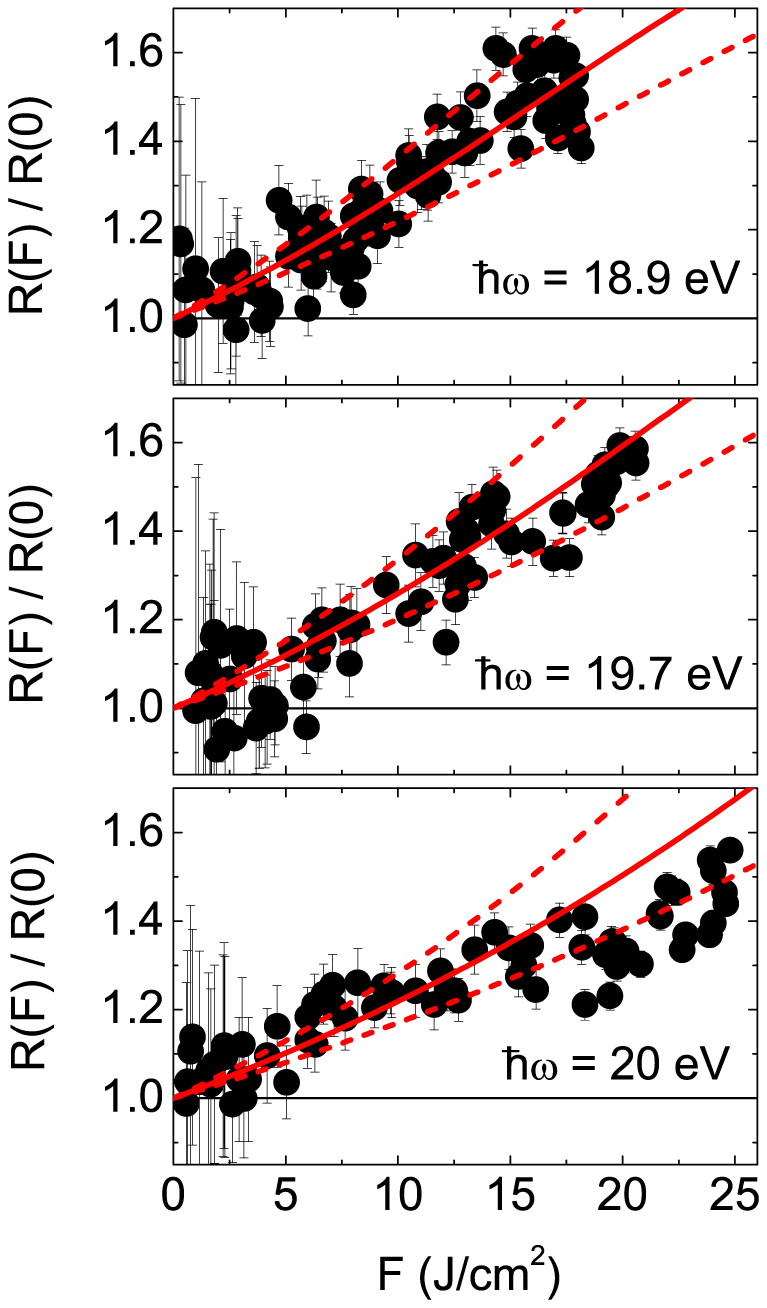
Each data corresponds to a single shot measurement taken in a fresh portion of the sample. Red full lines are the R(F)/R(0) trends calculated through Eq. (6); dashed lines are the estimate of the confidence interval.
Once the parameter A is determined, it is straightforward to compute the F-dependencies of ωp and Ne, and these indicate an increase in ωp and Ne (averaged over both the time and transverse spatial profiles of the FEL pulse) of up to ≈4% and 8%, respectively, at the highest F-values. Fig. 3 reports the variation with F of the mean ion charge: Z(F) = Z(0)Ne(F)/Ne(0), where Z(0) = 427,28,29. Such a variation is most likely due to the ionization of the shallower (3p) core electrons, that cannot efficiently recombine within the FEL pulse duration, thus leading to a net increase in the average density of free electrons. We note that the  reached in the present experiment compares well with the ionization energy (E+ = 99 eV/atom29,30) for the Ti4+ → Ti5+ process. If we assume that the latter is the leading ionization process, then the data shown in Fig. 3 indicates that at the highest probed F's and within the ≈45 fs FEL pulse duration ≈40% of Ti atoms are ionized. This is in qualitative agreement with the results reported in Ref. 8 for Al, where the onset of a FEL-induced saturable absorption is observed in a similar F-range. This corresponds to the situation where almost all atoms are ionized within the FEL pulse duration. Furthermore, by making the crude assumption that in a moderately excited sample
  3 one can derive Te from Z. The Te values estimated in this way are shown in the inset of Fig. 3 and compared with those reported in ref 8 for Al. The latter data were obtained by interpreting the soft x-ray emission spectra within a free electron gas model (like the one used in the present work), so that we can speculatively infer a common low-F behavior of highly photo-excited metals in the sub-0.1 ps timescale, which is mainly determined by the role played by free electrons.
Figure 3. Full lines are the F-dependencies of Z(F) at the employed  ω-values; dashed lines are the confidence range.
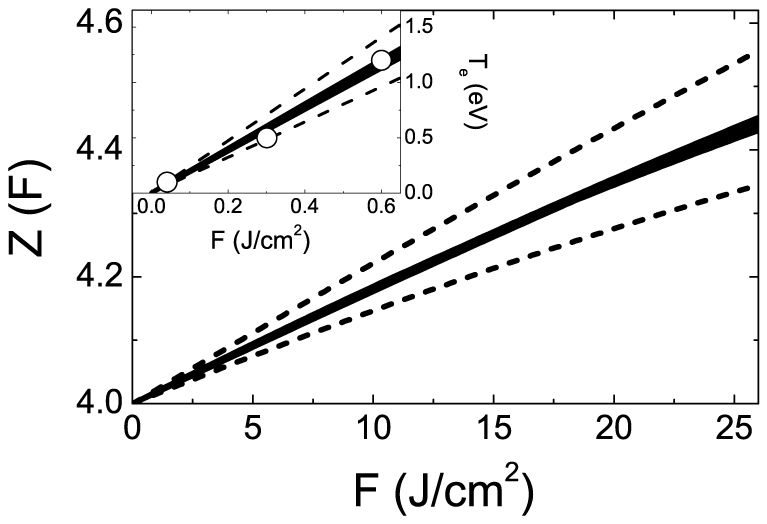
Inset compares the low F estimate of Te with data from Ref. 8 (circles).
Discussion
We have reported the experimental observation of a large XUV reflectivity enhancement in titanium upon irradiation with ultrafast high-fluence FEL-pulses, whose photon frequency was tuned above the plasma frequency of the sample. The FEL irradiation drives the titanium sample into a transient (short-lived) excited state that exhibits electronic temperatures typical of dense plasmas but still retains a cold atomic lattice. Reflectivity data were interpreted through a simple analytical model, based on the free electron gas approach, which employs a single empirical parameter to account for the increase in the plasma frequency within the FEL pulse duration. Such a simplified data analysis is able to capture the main physical process at the base of the observed phenomenology and allows us to determine the mean free electron density of the excited sample.
The information that can be gained from the present experiment is of the highest relevance for the study of highly excited states of matter. Analogous information can be deduced from the lineshape analysis of Thompson scattering spectra. However, the present approach has the advantage of the extreme simplification of the experimental setup and, additionally, reflectivity measurements do not suffer from cross-section or coherence issues. Substantial improvements in the experimental accuracy and data analysis can be achieved with moderate efforts and will likely open up the possibility to obtain additional information from this class of experiments, for example possible modifications of the electronic band structure. Also, the capability of FERMI to operate in the near future at photon energies down to ≈12 eV will allow one to probe the condition where the metal reflectivity is almost insensitive to plasma frequency variations but strongly depends on the plasmon lifetime. Since the latter is mostly determined by electron-electron and electron-phonon interactions, information on these dynamics could be gained as well. In summary, the possibility to map out FEL-induced reflectivity variations in a broad range across the low frequency side of the XUV spectrum can be profitably used as a complementary tool with respect to Thompson scattering methods by the growing community involved in the study of matter under extreme conditions.
Methods
XUV reflectivity measurements
A sketch of the experimental setup is shown in Fig. 4. A Ti mirror (substrate: Si, roughness ≈1 nm RMS, thickness 100 nm, passivated with 3 nm TiO2) was loaded into the 5-axis manipulator (x,y,z,pitch,roll) of the EIS-TIMEX end-station. The FEL beam was focused onto the sample by a spherical platinum-coated silicon mirror (400 mm radius of curvature, 0.2 nm roughness RMS) placed close to normal incidence (angle of incidence 3°), which is able to provide a focal spot of area σ2 ≈ 100 μm2. The maximum energy/pulse delivered by the FEL source was in the ≈300 μJ level. The actual energy/pulse at the input of the photon transport system of the EIS-TIMEX beamline (IFEL) was varied in the 1–300 μJ range by a gas attenuator and monitored on a shot-to-shot base by a gas monitor31. Each shot was tagged by a unique label (bunch number) to one-to-one correlate all the acquired data. F was determined from IFEL taking into account σ2 as well as the transmission of the TiO2 layer, the beamline transmission and the mirror reflectivity that, in the used ω-range, are in the ≈73%, 52–56% and 15–20% ranges, respectively. Appreciable damage of the sample surface was observed after irradiation with a single FEL pulse with F > 0.1 J/cm2. The pulse energy reflected by the sample (IR), at 6° angle of incidence, was collected at  = 18.9, 19.1, 19.4, 19.7, 20.0 and 20.3 eV by a Silicon photodiode (UVG20S, IRD inc) coupled with a 0.5 mm thick YAG fluorescence screen having a 100 nm aluminum coating on the FEL side. In order to calibrate the high-F experiment we collected the ratio
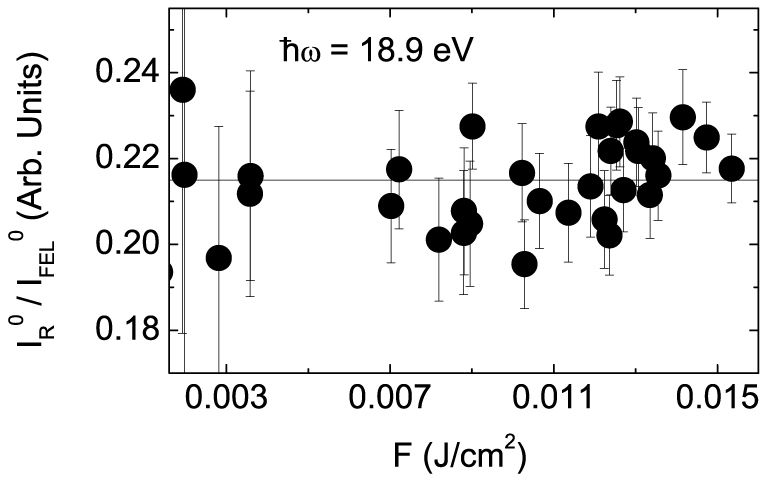
  in the 1–300 μJ IFEL-range after having moved the sample 3 mm away from the focal plane (here F < 0.02 J/cm2). The results are shown in Fig. 5 and display a constant ratio, indicating no appreciable changes in the reflectivity in this low-F range. The
  value was used to determine the relative reflectivity variation in the high-F experiment, i.e.:
  .
.
Figure 4. Sketch of the experimental setup (side view - not to scale): GA, GM, SM and PD are the gas attenuator cell, the gas monitor, the spherical focusing mirror and the photodiode, respectively.

The FEL beam is shown in green. The relevant distances and angles are indicated.
Figure 5.  -values as a function of F in the low-F range for
  ω = 18.9 eV.
Data analysis
The reflection coefficient at near normal incidence can be expressed in terms of the complex dielectric function ( ) as7:
 |
which is a sufficiently accurate approximation for sample thickness much larger than the penetration depth of the radiation (L < 23 nm in the present case). In metals a simple expression for  is given by the Drude formula7:
 |
In this model, a variation in R is ascribed to a change in ωp or γ when the photon pulse impinges. However, as shown in Fig. 1, in the used ω range the dependence on ωp is much more significant than on γ. So we arbitrarily set  , in analogy with what was found for Al (where γ ≈ 0.1 · ωp(0)19) since a reference value for Ti is not available in the literature, and we drop a possible F-dependence of γ. We also stress that within the accuracy of the present experiment the results are only marginally affected by the choice of the
  within the 0.5–2.5 eV range, which essentially includes the
  observed in a large number of metals19,20,21, as also shown in the Supplemental Information. For this reason the observed increase in R was related to an increase in ωp and then in Ne through Eq. (1). As quoted in the main text, in order to provide a quantitative estimate we assumed that Ne is proportional to
  and we considered both the time (t) and transverse spatial (x, y) profiles of the FEL pulse. These result in a (t, x, y)-evolution of the reflectivity (R(F, t, x, y)), which can be calculated using Eqs. (3) and (4) assuming
  , where
 |
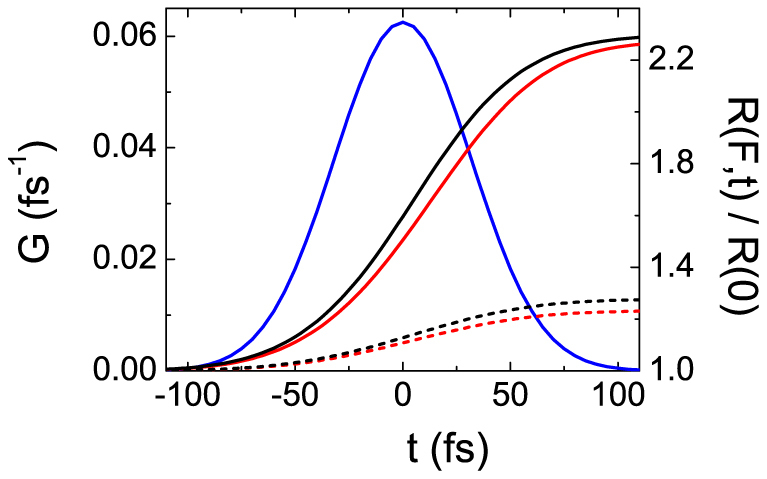
is the spatial profile of the energy density at time t deposited in a sample layer (involved in the reflectivity process) of thickness d < L below the surface, where G(t) and S(x, y) are the normalized time and space intensity distributions. These are approximated by Gaussian functions with σx = σy = 5 μm and σt = 45 fs. σt was evaluated as  32, where σseed = 70 fs is the time duration of the seed laser pulse (measured with an optical cross-correlator) and N = 4 is the harmonic number at which the FEL radiators were tuned. Representative t-traces of R(F, t)/R(0) = (1/R(0)) ∫ dx ∫ dyS(x, y)R(F, t, x, y) are shown in Fig. 6 along with G(t). It is worth stressing that the possibility to approximate G(t) with a well defined function (which ultimately permitted us to carry out the present data analysis) is one of the advantages related to the use of seeded FELs. Finally, the factor 1 − R(F, t, x, y) in Eq. (5) accounts for the reduction in the amount of energy available at later times for further excitation due to the t-increase in ωp (and thus in R) within the FEL pulse duration. Finally, the observed R(F)/R(0) is simply given by the space-time average of R(F, t, x, y), i.e.:
 |
The mean ion charge (or equivalently the average free electron density) can be calculated as well through the definition of ωp (see Eq. (1)), i.e.:
 |
Figure 6. t-dependence of G(t) (left scale; blue line) and of R(F, t)/R(0) (right scale; black/red and full/dashed lines are  ω = 18.9/20 eV and F = 20/5 J/cm2, respectively).
Author Contributions
F.B. conceived the experiment and data interpretation. E.P., E.G. and A.G. realized the experimental setup. F.B., E.P., E.G., R.C., A.B., F.D.A., A.D.C., S.D.F., M.M., L.P. and M.S. performed the measurements. F.B. carried out the data analysis. F.B., C.M., E.G., E.P., A.D.C., R.G. and A.F. discussed the data and wrote the paper.
Supplementary Material
Supplementary information
Acknowledgments
The authors acknowledge the invaluable support provided by the whole FERMI team and K. C. Prince for proof reading of the manuscript. C. Masciovecchio acknowledges support from the European Research Council through the ERC Grant N.202804-TIMER. A. Di Cicco acknowledges support from Elettra-Sincrotrone Trieste (ST) through the TIMEX collaboration.
References
- Holzapfel W. B. Physics of solids under strong compression. Rep. Prog. Phys. 59, 29–90 (1996). [Google Scholar]
- Ross M. Matter under extreme conditions of temperature and pressure. Rep. Prog. Phys. 48, 1–52 (1985). [Google Scholar]
- Lee R. W. et al. Finite temperature dense matter studies on next-generation light sources. J. Opt. Soc. Am. B 20, 770–778 (2003). [Google Scholar]
- Taylor R. J. The Stars: their structure and evolution (Cambridge University Press, Cambridge, 1994). [Google Scholar]
- Hu S. X., Militzer B., Goncharov V. N. & Skupsky S. Strong coupling and degeneracy effects in inertial confinement fusion implosions. Phys. Rev. Lett. 104, 235003 (2010). [DOI] [PubMed] [Google Scholar]
- Ping Y. et al. Broadband dielectric function of nonequilibrium warm dense gold. Phys. Rev. Lett. 96, 255003 (2006). [DOI] [PubMed] [Google Scholar]
- Wooten F. Optical Properties of Solids (Academic Press, New York, 1972). [Google Scholar]
- Nagler B. et al. Turning solid aluminium transparent by intense soft X-ray photoionization. Nat. Phys. 5, 693–696 (2009). [Google Scholar]
- Ciricosta O. et al. Direct measurements of the ionization potential depression in a dense plasma. Phys. Rev. Lett. 109, 065002 (2012). [DOI] [PubMed] [Google Scholar]
- Durbin S. M. X-ray induced optical reflectivity. AIP Advances 2, 042151 (2012). [Google Scholar]
- Gahl O. et al. A femtosecond X-ray/optical cross-correlator. Nat. Photonics 2, 165–169 (2008). [Google Scholar]
- Krupin O. et al. Temporal cross-correlation of x-ray free electron and optical lasers using soft x-ray pulse induced transient reflectivity. Opt. Express 20, 11396–11406 (2012). [DOI] [PubMed] [Google Scholar]
- Principi E. et al. Determination of the ion temperature in a stainless steel slab exposed to intense ultrashort laser pulses. Phys. Rev. Lett. 109, 025005 (2012). [DOI] [PubMed] [Google Scholar]
- Gregori G., Glenzer S. H., Rozmus W., Lee R. W. & Landen O. L. Theoretical model of x-ray scattering as a dense matter probe. Phys. Rev. E 67, 026412 (2003). [DOI] [PubMed] [Google Scholar]
- Gregori G., Tommasini R., Landen O. L., Lee R. W. & Glenzer S. H. Limits on collective X-ray scattering imposed by coherence. Europhys. Lett. 74, 637–643 (2006). [Google Scholar]
- Moss T. S., Hawkins T. D. F. & Burrell G. J. Use of plasma edge reflection measurements in the study of semiconductors. J. Phys. C: Solid State Phys. 1, 1435–1446 (1968). [Google Scholar]
- Shank C. V., Yen R. & Hirlimann C. Time-resolved reflectivity measurements of femtosecond-optical-pulse-induced phase transitions in silicon. Phys. Rev. Lett. 50, 454–457 (1983). [Google Scholar]
- Mao H. K., Hemley R. J. & Hanfland M. Infrared reflectance measurements of the insulator-metal transition in solid hydrogen. Phys. Rev. Lett. 65, 484–487 (1990). [DOI] [PubMed] [Google Scholar]
- Ujihara K. Reflectivity of metals at high temperatures. J. Appl. Phys. 43, 2376–2383 (1972). [Google Scholar]
- Sturm K. & Oliveira L. E. Wave-vector-dependent plasmon linewidth in the alkali metals. Phys. Rev. B 24, 3054–3062 (1981). [Google Scholar]
- Chen C. H., Joy D. C., Chen H. S. & Hauser J. J. Observation of anomalous plasmon linewidth in the icosahedral Al-Mn quasicrystals. Phys. Rev. Lett. 57, 743–746 (1986). [DOI] [PubMed] [Google Scholar]
- Di Cicco A. et al. Probing matter under extreme conditions at FERMI@Elettra: the TIMEX beamline. Proc. of SPIE 8077, 807704 (2011). [Google Scholar]
- Bencivenga F. & Masciovecchio C. FEL-based transient grating spectroscopy to investigate nanoscale dynamics. Nucl. Instrum. Meth. Phys. Res. A 606, 785–789 (2009). [Google Scholar]
- Allaria E. et al. The FERMI@Elettra free-electron-laser source for coherent x-ray physics: photon properties, beam transport system and applications. New. J. Phys. 12, 075002 (2010). [Google Scholar]
- Allaria E. et al. Highly coherent and stable pulses from the FERMI seeded free-electron laser in the extreme ultraviolet. Nat. Photonics 6, 699–704 (2012). [Google Scholar]
- Allaria E. et al. Tunability experiments at the FERMI@Elettra free-electron laser. New. J. Phys. 14, 113009 (2012). [Google Scholar]
- Robins J. L. & Swan J. B. Characteristic electron energy loss spectra of the transition metals, Ti to Cu. Proc. Phys. Soc. 76, 857–869 (1960). [Google Scholar]
- Bracconi P. & Lässer R. Investigation of titanium and titanium hydride by AES and EELS. Appl. Surf. Science 28, 204–214 (1987). [Google Scholar]
- Stambulchik E. et al. Progress in line-shape modeling of K-shell transitions in warm dense titanium plasmas. J. Phys. A: Math. Theor. 42, 214056 (2009). [Google Scholar]
- James A. M. & Lord M. P. Macmillan's Chemical and Physical Data (Macmillan, London, 1992). [Google Scholar]
- Zangrando M. et al. PADReS: the photon analysis delivery and reduction system at the FERMI@Elettra FEL user facility. Rev. Scient. Instrum. 80, 113110 (2009). [DOI] [PubMed] [Google Scholar]
- Ratner D., Fry A., Stupakov G. & White W. Laser phase errors in seeded free electron lasers. Phys. Rev. ST Accel. Beams 15, 030702 (2012). [Google Scholar]
Associated Data
This section collects any data citations, data availability statements, or supplementary materials included in this article.
Supplementary Materials
Supplementary information


