

Significance
The locus coeruleus projection system in the brain is thought to exert uniform and synchronous modulatory effects on cells and circuits throughout the CNS by widespread release of its transmitter, norepinephrine. We challenge this notion by demonstrating that neurons in the locus coeruleus maintain segregated connections to brain regions with distinctly different functions. Specifically, cells that communicate with the prefrontal cortex, a region involved in cognition and executive function, are characterized by properties that allow for independent and asynchronous modulation of operations in this area, compared with those that project to the motor cortex and regulate movement generation. These findings have important implications for understanding the role of this system in normal brain physiology and pathologic neuropsychiatric conditions.
Abstract
The brainstem nucleus locus coeruleus (LC) is the primary source of norepinephrine (NE) to the mammalian neocortex. It is believed to operate as a homogeneous syncytium of transmitter-specific cells that regulate brain function and behavior via an extensive network of axonal projections and global transmitter-mediated modulatory influences on a diverse assembly of neural targets within the CNS. The data presented here challenge this longstanding notion and argue instead for segregated operation of the LC–NE system with respect to the functions of the circuits within its efferent domain. Anatomical, molecular, and electrophysiological approaches were used in conjunction with a rat model to show that LC cells innervating discrete cortical regions are biochemically and electrophysiologically distinct from one another so as to elicit greater release of norepinephrine in prefrontal versus motor cortex. These findings challenge the consensus view of LC as a relatively homogeneous modulator of forebrain activity and have important implications for understanding the impact of the system on the generation and maintenance of adaptive and maladaptive behaviors.
The brainstem nucleus locus coeruleus (LC), the primary source of the catecholamine neurotransmitter norepinephrine (NE) to the forebrain, cerebellum, and spinal cord, is conserved across several taxa, including fish, birds, and mammals (1). In mammals, it is the largest noradrenergic nucleus in the brain and the main source of NE to the neocortex. This projection system modulates sensory processing, motor behavior, arousal, and executive functions (2–10) and is implicated in a number of neuropsychiatric disorders (4). The LC has long been considered a homogeneous assembly of NE-containing cells, each with highly divergent axons that innervate broad regions of the CNS. There is only limited evidence of functional or topographic order within the nucleus (11–16), leading to the generally accepted notion that activation of the LC leads to simultaneous release and uniform physiologic action of NE throughout the brain. However, using the rat as a model, we have recently demonstrated the existence of three minimally overlapping populations of LC neurons that project to orbitofrontal (OFC), medial prefrontal (mPFC), and anterior cingulate (ACC) cortices (17, 18). This projection pattern suggests a more segregated mode of operation for this projection system.
The goals of the present study were to determine whether this trend of minimal axonal collateralization extended to LC neurons innervating primary motor cortex (M1) and to identify the molecular and electrophysiological characteristics that distinguish the target-specific cell populations within the rat LC. Because these prefrontal subregions regulate higher-order executive operations (19, 20) whereas M1 regulates the generation of motor behaviors downstream of prefrontal cortical processes, we hypothesized that M1 and each prefrontal cortical subregion receives input from functionally distinct populations of LC neurons. To test this hypothesis, we paired injections of fluorescently labeled retrograde tracers in M1 with injections in OFC, mPFC, or ACC. After confirming the existence of distinct populations of LC neurons with nonoverlapping projections to M1 and each prefrontal cortical subregion, several approaches were used to probe for potential functional differences among populations. First, we combined retrograde tract tracing with laser-capture microdissection and RT-PCR to quantify differences in expression of various mRNAs among populations. We then performed whole-cell patch-clamp recordings on retrogradely labeled cells in vitro to measure passive and active membrane properties within each population.
Through this combination of techniques, we have determined that LC cells innervating specific subregions of the prefrontal cortex (PFC) are phenotypically and electrophysiologically distinct from those terminating in M1. Specifically, OFC and mPFC projection cells contain enriched mRNA transcripts coding for several markers of excitability and transmitter release relative to the M1 projection group. These same populations also differed in their spontaneous firing rates and several action potential and membrane properties, as well as size and frequency of glutamate-mediated excitatory postsynaptic currents. Taken together, these findings suggest that LC cells projecting to subregions of PFC are more excitable than those projecting to cortical circuitries involved in the execution of motor acts, which may be indicative of a greater demand for NE by PFC. Deviations from this functional organization may have consequences for the sequencing of operations required to execute normal behaviors and may manifest in the form of hyperactivity, attentional impairments, and impulsivity that are related to various neuropsychiatric disorders. Overall, these data argue for a more specific organization of the LC with respect to the functions of its efferent targets and consequently more subtle, asynchronous control of NE release within and across its efferent domain.
Results
LC Cells Exhibit Target-Specific Projections.
Retrograde tract-tracing experiments revealed largely segregated populations of cells projecting to OFC vs. M1, mPFC vs. M1, and ACC vs. M1. For OFC and M1 paired injections, 57% of retrogradely labeled LC cells projected to OFC, 37.8% projected to M1, and 5.2% projected to both regions. For mPFC and M1 paired injections, 60.8% of labeled cells projected to mPFC, 35.4% projected to M1, and 3.9% projected to both. For ACC and M1 paired injections, 48.2% of labeled cells projected to ACC, 45.5% projected to M1, and 6.3% projected to both regions (Fig. 1). When an animal underwent a single surgery with three different tracers (red, green, and blue) injected into the same cortical region, all retrogradely labeled cells in the LC were found to contain all three tracers (Fig. S1). This result confirmed that the incorporation of one tracer into an axon does not preclude uptake of other tracers in the same axon and that the extensive single labeling of neurons observed on our studies could not be attributed to competitive uptake and/or transport between tracers.
Fig. 1.

LC cells innervating M1 are distinct from those innervating OFC, mPFC, and ACC. (A–C) Representative photomicrographs of pairs of injection sites (Left) and LC through merged fluorescence filters to detect retrograde tracers (second from Left) and DBH immunofluorescence (third from Left) following injections into OFC and M1 (A), mPFC and M1 (B), and ACC and M1 (C). Arrowheads and Roman numerals indicate the locations of cells shown in high power images in the Right panels. Columns show individual neuron(s) through fluorescein (OFC, mPFC, or ACC), rhodamine (M1), and merged fluorescence filters, thus identifying single labeled cells with different terminal fields. (A′–C′) Histograms show mean cell counts per animal ± SEM projecting to each possible combination of terminal fields (n = 5 rats per experiment).
Distinct Projection-Specific Molecular Phenotypes.
The expression of 5 of 20 assayed mRNAs differed between subsets of LC cells projecting to subregions of PFC and M1: Kruskal-Wallis H tests revealed that expression of AMPA receptor subunit GluR1 (H = 12.762, P = 0.005), NMDA receptor subunit NR1 (H = 12.332, P = 0.006), tyrosine hydroxylase (H = 7.891, P = 0.048), VMAT2 (H = 12.751, P = 0.005), and voltage-gated sodium channel subunit β3 (NaV β3; H = 10.680, P = 0.014) mRNAs were not equally expressed between populations (Fig. 2). Mean relative quantities ± SEM and corrected P values for all significant pairwise comparisons are shown in Table S1. Representative photomicrographs of LC before and after laser-capture microdissection, as well as quantification of A260/280 ratios and concentrations for both RNA and cDNA used in this study, are shown in Fig. S2.
Fig. 2.

LC cells projecting to OFC and mPFC contain enriched mRNA transcripts coding for markers of excitability and release. Mean ± SEM of relative quantities of mRNAs that were shown to differ significantly from M1 projection cells according to terminal field by a Kruskal–Wallis H test (*P < 0.05). DBH is shown in the far right as a representation of protein whose mRNA expression was highly consistent between populations.
Physiologically Distinct Populations of LC Projection Cells.
AMPA sEPSCs.
Representative photomicrographs of a brain slice containing a patched retrogradely labeled LC cell are shown in Fig. S3. Retrogradely labeled neurons were patched and held at −70 mV to record AMPA spontaneous excitatory postsynaptic currents (sEPSCs). Representative traces of AMPA sEPSCs and summary graphs are shown in Fig. 3 A–C. Rise tau, decay tau, and 10–90% amplitude rise time values were log transformed, and 90–10% amplitude decay time values were inverse cube transformed, to meet normality requirements for parametric statistical analyses. A one-way ANOVA revealed a significant effect of LC terminal field on AMPA sEPSC amplitude, with neurons projecting to mPFC exhibiting significantly larger sEPSC amplitudes (F = 3.327, P = 0.024). Mean ± SEM values for all measured AMPA sEPSC parameters and corrected P values for all significant pairwise comparisons are shown in Table S2.
Fig. 3.

EPSC size and frequency vary according to LC neuronal terminal field. Representative traces of AMPA-mediated sEPSCs, mEPSCs, and NMDA-mediated sEPSCs are shown in A, D, and G. Mean frequencies and amplitudes of these events are shown in B, E, and H, and C, F, and I, respectively. Cells projecting to mPFC were characterized by significantly larger AMPA-mediated sEPSCs and more frequent mEPSCs than those projecting to M1, and cells projecting to OFC were characterized by significantly larger NMDA-mediated sEPSCs than M1 projection cells. Values were generated by using an automated search protocol in ClampFit software to identify all sEPSC events recorded from each cell and calculate a single mean sEPSC size for each cell. Any event smaller than twice the SD of the baseline of the recording was discarded. These data were then used to generate mean ± SEM amplitude values on a cell by cell basis. *Significantly different from M1 projection cells (P < 0.05).
AMPA mEPSCs.
Retrogradely labeled neurons were patched and held at −70mV in the presence of 0.5 μM TTX and 50 μM picrotoxin (PTX) to measure AMPA miniature EPSCs (mEPSCs). Representative traces of AMPA mEPSCs and summary graphs are shown in Fig. 3 D–F. Decay tau values were log transformed to meet normality requirements for parametric statistical analyses. A one-way ANOVA revealed a significant effect of terminal field on mEPSC frequency, with mPFC projection cells exhibiting significantly more frequent mEPSCs (F = 3.600, P = 0.031). Mean ± SEM values for all measured AMPA mEPSC parameters and corrected P values for all significant pairwise comparisons are shown in Table S3.
NMDA sEPSCs.
Retrogradely labeled neurons were patched and held at +60mV to record NMDA sEPSCs. Representative traces of NMDA sEPSCs and summary graphs are shown in Fig. 3 G–I. Charge transfer, decay tau, and rise tau values were log transformed to meet normality requirements for parametric statistical analysis. One-way ANOVAs revealed significant effects of terminal field on sEPSC amplitude (F = 4.510, P = 0.007), and charge transfer (F = 3.713, P = 0.018). Mean ± SEM values for all measured NMDA sEPSC parameters and corrected P values for all significant pairwise comparisons are shown in Table S4.
To further show that the differences in NMDA sEPSC amplitude and charge transfer were not due to differences in AMPA-mediated currents and that the EPSCs recorded at −70 mV were indeed derived from AMPA receptor activation, four cells from each group were recorded before and after infusion of 20 μM 6,7-dinitroquinoxaline-2,3-dione (DNQX) into the recording chamber. DNQX reversibly blocked both AMPA-mediated sEPSCs and mEPSCs (Fig. S3A). Two one-way ANOVAs performed on NMDA-mediated sEPSC amplitude (F = 4.584, P = 0.023) and charge transfer (F = 6.024, P = 0.010) revealed a main effect of terminal field on both measures. Sequential Bonferroni comparisons showed that both NMDA-mediated sEPSC amplitude (P = 0.015) and charge transfer (P = 0.006) are significantly larger in OFC projection cells than those projecting to M1. Furthermore, the ratios of pre- and postinfusion amplitudes were very highly correlated such that cells with very large preinfusion amplitudes had a much greater decrease in sEPSC amplitude postinfusion than those with small preinfusion amplitudes (Fig. S4).
Action potential and membrane properties.
All recorded LC neurons fired spontaneously, but those projecting to OFC and mPFC discharged at a greater average rate than those projecting to M1. Individual action potentials from mPFC and M1 projection neurons and representative traces of baseline firing for each type of cortical projection neuron are shown in Fig. 4. The afterhyperpolarization half-duration (AHPt1/2), spontaneous firing frequency, action potential rise time, input resistance, and time-constant values were log transformed to satisfy normality assumptions required for parametric statistical analyses. One-way ANOVAs performed on AHP amplitude (F = 10.205, P < 0.001), action potential threshold (F = 4.180, P = 0.009), activation gap (F = 4.081, P = 0.010), and log-transformed AHPt1/2 (F = 4.043, P = 0.011), frequency (F = 9.798, P < 0.001), input resistance (F = 9.770, P < 0.001) and time constant values (F = 5.435, P = 0.002) revealed significant main effects of terminal fields on these parameters. Mean ± SEM values for all measured current-clamp parameters, as well as corrected P values for all significant pairwise comparisons, are shown in Table S5. The results of nonparametric tests performed on raw untransformed datasets for all current-clamp and voltage-clamp experiments are presented in SI Materials and Methods.
Fig. 4.

LC cells projecting to mPFC are more spontaneously active and have a smaller AHP than those projecting to M1. (A) Representative traces of individual action potentials from an mPFC and M1 projection cell showing the magnitude of afterhyperpolarization as measured from action potential threshold to its most hyperpolarized state (dashed lines and arrows). Mean ± SEM afterhyperpolarization amplitudes are shown in B. (C) Representative traces of spontaneous action potentials from all populations of LC projection cells (OFC, n = 18; mPFC, n = 19; ACC, n = 18; M1, n = 17). Mean ± SEM of spontaneous discharge values are shown in D. *Significantly different from M1 projection cells (P < 0.05).
A two-way ANOVA (projection group × current injected) was used to determine the effects of LC terminal field and current injection on the number of action potentials propagated in a 1-s period (Fig. 5). The main effects of terminal field (F = 7.206, P < 0.001) and current (F = 1110.209, P < 0.001), as well as the terminal field × current interaction effect (F = 5.601, P < 0.001), were all found to be significant. Planned Bonferroni comparisons of the main effect of terminal field showed that cells projecting to mPFC generated more spikes in response to a depolarizing step current than those projecting to M1. Furthermore, post hoc Bonferroni comparisons of the interaction effect showed that mPFC projection cells fired more spikes than M1 projection cells in response to all depolarizing currents.
Fig. 5.

LC cells projecting to mPFC are more excitable than those projecting to M1. (A) Patched cells were injected with a −0.1-nA current step to measure input resistance, followed by a series of progressively increasing current steps (−3.0 to +4.0 nA, 0.5-nA interval). Representative traces of discharge in response to a 1-s injection of 4.0 nA are shown in B. Action potentials were truncated 5 mV above firing threshold. (C) Input resistance was significantly greater in cells projecting to OFC and ACC than M1. (Inset) The responses to the current injection from representative traces shown in B superimposed on one another. Note that the larger deflections in voltage are from ACC and OFC projection cells whereas the smaller two are from M1 and mPFC projection cells (P < 0.05). A plot of the mean ± SEM of the number of action potentials fired in response to all levels of current injected into each of the populations of LC neurons is shown in D. *Significantly different from M1 projection cells (P < 0.05).
Principal-Component Analysis Reveals a Clear Differential Distribution Between M1 and PFC Projection Cells.
To explore whether the overall sample variance from electrophysiological measurements could be concentrated within a few composite constructs, a principal component (PC) analysis was performed. Data from each measured parameter were normalized and converted to Z-scores. Four outliers with |Z| > 3 were removed from the sample, and the analysis was performed on the correlation matrix. Resultant components with Eigenvalues > 1 were considered in subsequent data rotation and analysis. Both Varimax and oblique rotations were attempted. We found that oblique rotation methods did not substantially change the relative contributions of the variables to the various PCs; therefore, the results from Varimax rotations are reported. The four rotated PCs accounted for 69% of the total variance within the dataset. Regression scores for each rotated PC were computed for all cells, a scatter plot of PC1 vs. PC2 was generated, and Davies–Bouldin indices were used to assess cluster quality (Fig. 6). The relative weights of each current-clamp parameter to each PC are shown in Table S6. Comparison of rotated PC1 vs. PC2 values for each population of LC-cortical projection cells revealed a clear differential distribution between M1 vs. PFC projection neurons.
Fig. 6.
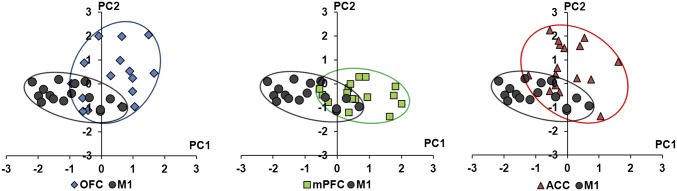
Cells projecting to PFC and M1 segregate from one another in principal-component space. Principal-component analysis was used to construct composite variables from several current-clamp parameters measured independently. Regression scores were calculated in IBM SPSS Statistics version 20. Scores for PC1 versus PC2 are plotted for all cells in all groups. Note that cells projecting to OFC and ACC differ from M1 projection cells primarily in PC2 (membrane properties) whereas cells projecting to mPFC differ mostly from cells projecting to M1 in PC1 (action potential properties). Individual weights of each of the current-clamp measures to each principal component are shown in Table S6. The quality of cluster separation was evaluated using the Davies–Bouldin index (45). Computations were performed in the R language (46) using the clusterSim package according to Walesiak and Dudek (47), with cluster dispersion assessed as the SD of distances from points to the cluster centroid, and separation between clusters assessed as the Euclidean distance. Davies–Bouldin index values for comparisons between M1 and OFC, mPFC, and ACC were 1.47, 1.13, and 1.40, respectively.
Discussion
The results of the current study suggest that several functional properties of LC neurons vary according to their terminal field projection. This nucleus has long been viewed as a homogeneous regulator of forebrain activity (4, 12, 21). However, the present findings suggest that LC exhibits greater functional organization than previously thought, and that NE may have a unique role in PFC function. Interestingly, a recent study by Robertson et al. (22) showed that, out of the entire cortical mantle, the insular subregion of PFC is the only region innervated by non–LC-derived NE-containing fibers, suggesting that NE efflux occurs in this area independent of the rest of the cortex. These findings therefore agree with our working hypothesis that NE maintains a unique role in PFC function. Interestingly, others have reported a wide range of spontaneous firing rates and resting membrane potentials for LC cells (23, 24), findings that may be explained in terms of their terminal field projections. The observation that LC cells innervating OFC and mPFC contain greater levels of mRNAs related to synaptic excitability and excitatory synaptic transmission, display higher spontaneous firing frequencies, and are more responsive to glutamate than those projecting to M1 may be reflective of a greater demand for NE by cortical circuitries related to cognition. This finding is in general agreement with observations that executive functions are impaired by manipulations that limit noradrenergic transmission in prefrontal cortex (9, 10, 25) and that symptoms of various psychiatric diseases are partially alleviated with drugs that promote NE actions within the synapse (9, 26–30). Methylphenidate is of particular interest in this context, as Berridge and coworkers have shown previously that doses of methylphenidate, which are effective in treating symptoms of attention deficit hyperactivity disorder (ADHD) without increasing locomotion, preferentially increase NE efflux and responsiveness of individual neurons in the PFC, but not within other cortical regions (31, 32).
The results of the RT-PCR experiments indicated that relative levels of most mRNAs sampled do not vary between cells projecting to subregions of PFC and M1. For example, expression of dopamine-β-hydroxylase mRNA was remarkably similar between populations, suggesting an equal capacity for NE synthesis from its precursor dopamine by all groups sampled. However, a small number of mRNAs were differentially expressed between cells projecting to M1 and the various PFC terminal fields. Interestingly, all of these mRNAs relate to synaptic excitability and excitatory synaptic transmission. Specifically, cells innervating both OFC and mPFC contain elevated levels of mRNAs coding for subunits of both AMPA and NMDA receptors (GluR1 and NR1, respectively), as well as VMAT2. Because both AMPA and NMDA receptor subunit mRNAs were enriched in OFC and mPFC projection cells, it suggests that both are more sensitive to synaptically released glutamate. Indeed, we found that OFC and mPFC projection neurons exhibit a significant or a clear trend toward larger AMPA- and NMDA-EPSC amplitudes. However, it is also possible that OFC and mPFC projection neurons maintain more synapses with glutamatergic afferents. Functionally and/or neurochemically distinct afferent regulation of these populations would be an important determinant for configuring LC output according to different behavioral contingencies. Such an organization may be revealed by using optogenetic techniques to explore responses of LC neurons to specified input pathways. These experiments could reveal an even more sophisticated organization of the nucleus than we have shown here and open the door to the possibility that LC in fact contains discrete populations of cells that are unique in both their afferent regulation and efferent domains, as has been shown recently for the dopamine system (33, 34).
Interestingly, Navβ3 mRNA was the only mRNA that was enriched in mPFC projection cells, indicating greater absolute numbers or density of voltage-gated sodium channels on LC cells that project to mPFC versus other regions. As action-potential generation requires a high density of voltage-gated sodium channels at the axon initial segment (35), this finding could explain why cells projecting to mPFC are capable of maintaining sustained periods of high-frequency firing and are more responsive to current injection (Fig. 5). This explanation is consistent with the finding that VMAT2 is enriched in the same population: i.e., a high rate of firing would also require a greater capacity for packaging NE into vesicles for synaptic release. The same finding held true for the OFC projection group, which was also characterized by an elevated level of spontaneous discharge. Furthermore, more VMAT2 may be required to maintain synaptically driven NE release. Therefore, LC may produce a greater efflux of NE in OFC and mPFC than M1 during convergent glutamate-mediated activation of the nucleus. Importantly, it has been previously demonstrated that neocortical NE concentration increases in a linear fashion as the firing rate of its neurons increases (36). This would suggest that interpopulation differences in basal and electrically evoked discharge rates shown in the present study could correspond to functionally relevant differences in NE concentration among cortical-terminal fields of LC. Specifically, Berridge and coworkers demonstrated that, although LC cells discharge across a narrow range in situ, a 300% increase in LC discharge equated roughly to a 300% increase in terminal-field NE concentration (36). Because cells projecting to mPFC discharge approximately three times faster than those projecting to M1, we predict that this difference would likely result in a threefold difference in NE concentration between mPFC and M1, thereby promoting unique cellular actions between these two terminal fields as dictated by the inverted-U relationship between LC–NE system output and subsequent modulation of terminal-field operations (for review, see refs. 4 and 37).
It is also interesting that the PC analysis identified individual parameters measured in current clamp that differentially contribute to composite variables. Furthermore, each of these PCs seems to be dominated by parameters that are biologically related. PC1, for example, was heavily weighted by AP threshold, AHP magnitude, AHPt1/2, and spontaneous firing frequency, all of which collectively contribute to a cell’s discharge behavior. PC2, on the other hand, was weighted by input resistance and time constant, both of which are descriptors of passive membrane properties. Importantly, plotting regression scores for PC1 versus PC2 for all recorded neurons reveals that cells projecting to mPFC and M1 segregate in the PC1 dimension (Fig. 6), suggesting that mPFC projection cells tend to have characteristics that favor higher basal discharge rates. Overall, this analysis is useful in explaining how these different parameters of membrane function collectively affect the output of a cell or group of cells.
The most important outcomes of the present study are the demonstration that populations of LC-prefrontal and motor projection neurons can be distinguished on the basis of their anatomical projections, molecular phenotypes, and electrophysiological properties and the implication that such selectivity translates to the potential for differential noradrenergic modulation of cortical operations and behavioral outcomes. The results of our study challenge the longstanding view of LC as a highly divergent and homogeneous nucleus with broad and uniform actions throughout the cerebral cortex (11–16). Many studies have provided evidence of a facilitating effect of NE or LC activation on the signal-processing capabilities of various networks in the mammalian brain, but the extent to which such actions are uniform and simultaneous across forebrain terminal fields has not been resolved. Heterogeneity among LC-prefrontal projection neurons opens the door for differential actions of LC output on specified prefrontal subregions as has been suggested by selective lesion and pharmacologic studies (9, 10, 30, 38, 39). Recent work using similar experimental strategies has revealed similar novel functional and organizational principles of dopamine projections to prefrontal versus limbic terminal fields (33), thus providing considerable new insights regarding the impact of dopaminergic inputs to those circuitries in health and disease. Importantly, these newly revealed organizational properties and implied functional attributes may be a common feature of both catecholamine systems in the mammalian brain.
The findings presented here are in general agreement with more recent theories of compartmentalized LC function as proposed by Aston-Jones and Cohen (37) and Arnsten (38, 40). We conclude that LC comprises minimally divergent cortical projection neurons whose molecular phenotypes and physiological profiles are matched to the operation of their particular terminal fields. Such an arrangement may have considerable behavioral significance insofar as LC seems to be aligned to elicit greater NE release and more robust noradrenergic modulatory actions in decision-making circuits relative to movement-generating circuits. At basal levels of LC output, this dynamic would facilitate the execution of PFC-guided planned behaviors and sustained attention. Furthermore, because noradrenergic modulation follows an inverted-U dose–response function (5, 7, 8), we would expect increasing LC output to achieve optimal NE modulator effects in motor cortex while noradrenergic facilitating actions in prefrontal cortex are waning, thereby shifting the organism from focused attention and decision making to labile attention and enactment of movement directives. This asynchronous mode of operation would facilitate transitions between exploitation of successful behavioral strategies and exploration of alternatives to meet new behavioral contingencies, as suggested by the theoretical constructs proposed by Aston-Jones and Cohen (37).
These data also match well with the theoretical construct of LC output and function put forward by Arnsten (38, 40), who has proposed that high levels of LC output during stress shift the brain into a more primitive survival mode with minimal regulation of posterior cortical and subcortical structures by PFC. Based upon the data presented here, LC projections to PFC would always maintain a more active state than those projecting to M1, and the resultant release of NE in PFC would regulate executive operations in this circuitry via high-affinity α2 receptors. Increasing LC discharge over the normal physiologic range would lead to the engagement of lower-affinity NE receptors, which Arnsten (38) has proposed impairs PFC function while simultaneously improving more posterior and primitive cortical function by limiting prefrontal inhibition of sensory processes and motor impulses that are necessary for escape behaviors and survival.
The findings reported here extend our understanding of the operation of the LC–NE system in normal brain function and behavior but also have far-reaching implications for cognitive function with respect to sex, age, and neuropsychiatric disorders. For example, we have preliminary data suggesting that LC–PFC projection neurons in normal animals versus those identified in the spontaneously hypertensive rat (SHR) exhibit different electrophysiological properties. The SHR shows other evidence of noradrenergic system dysfunction (41, 42) and displays inattentive behaviors and hyperactivity (43, 44), traits that are associated with ADHD and other neuropsychiatric conditions. In this context, molecular and physiological profiling of LC neurons with specified projection targets in normal animals provides a backdrop against which the properties of cells from animals across the aging spectrum or animals with acquired or inherited behavioral abnormalities can be evaluated. Most certainly the LC–NE system is not responsible for all dimensions of executive function nor is it the sole underlying cause of all neuropsychiatric conditions. Nevertheless, the results of the current studies provide a framework for better understanding acquired or genetically transmitted abnormalities of the LC–NE system that result in maladaptive behaviors, including those expressed in ADHD, autism, schizophrenia, and post-traumatic stress disorder.
Materials and Methods
Detailed procedures can be found in SI Materials and Methods. Briefly, young adult male Sprague–Dawley rats underwent a surgical procedure to inject retrograde tracers into OFC, mPFC, ACC, or M1. In anatomical experiments, each animal received an injection of one tracer into OFC, mPFC, or ACC, and a second injection of a different tracer into M1. In RT-PCR and electrophysiological experiments, animals received only a single injection into one of these areas. For RT-PCR experiments, the brain was sectioned, retrogradely labeled LC cells were isolated using laser-capture microdissection, and total RNA was extracted for two-step quantitative RT-PCR using primers and probes shown in Table S7. For whole-cell patch-clamp recordings, retrogradely labeled LC cells were identified through rhodamine fluorescence and were patched under visually guided control. Electrophysiological parameters were recorded in both current-clamp and voltage-clamp modes. All data were analyzed using IBM SPSS Statistics version 20 as described in Results.
Supplementary Material
Footnotes
The authors declare no conflict of interest.
This article is a PNAS Direct Submission.
This article contains supporting information online at www.pnas.org/lookup/suppl/doi:10.1073/pnas.1320827111/-/DCSupplemental.
References
- 1.Amaral DG, Sinnamon HM. The locus coeruleus: Neurobiology of a central noradrenergic nucleus. Prog Neurobiol. 1977;9(3):147–196. doi: 10.1016/0301-0082(77)90016-8. [DOI] [PubMed] [Google Scholar]
- 2.Cain RE, Wasserman MC, Waterhouse BD, McGaughy JA. Atomoxetine facilitates attentional set shifting in adolescent rats. Dev Cogn Neurosci. 2011;1(4):552–559. doi: 10.1016/j.dcn.2011.04.003. [DOI] [PMC free article] [PubMed] [Google Scholar]
- 3.Sara SJ. The locus coeruleus and noradrenergic modulation of cognition. Nat Rev Neurosci. 2009;10(3):211–223. doi: 10.1038/nrn2573. [DOI] [PubMed] [Google Scholar]
- 4.Berridge CW, Waterhouse BD. The locus coeruleus-noradrenergic system: modulation of behavioral state and state-dependent cognitive processes. Brain Res Brain Res Rev. 2003;42(1):33–84. doi: 10.1016/s0165-0173(03)00143-7. [DOI] [PubMed] [Google Scholar]
- 5.Moxon KA, Devilbiss DM, Chapin JK, Waterhouse BD. Influence of norepinephrine on somatosensory neuronal responses in the rat thalamus: A combined modeling and in vivo multi-channel, multi-neuron recording study. Brain Res. 2007;1147:105–123. doi: 10.1016/j.brainres.2007.02.006. [DOI] [PMC free article] [PubMed] [Google Scholar]
- 6.Devilbiss DM, Waterhouse BD. The effects of tonic locus ceruleus output on sensory-evoked responses of ventral posterior medial thalamic and barrel field cortical neurons in the awake rat. J Neurosci. 2004;24(48):10773–10785. doi: 10.1523/JNEUROSCI.1573-04.2004. [DOI] [PMC free article] [PubMed] [Google Scholar]
- 7.Devilbiss DM, Waterhouse BD. Norepinephrine exhibits two distinct profiles of action on sensory cortical neuron responses to excitatory synaptic stimuli. Synapse. 2000;37(4):273–282. doi: 10.1002/1098-2396(20000915)37:4<273::AID-SYN4>3.0.CO;2-#. [DOI] [PubMed] [Google Scholar]
- 8.Devilbiss DM, Page ME, Waterhouse BD. Locus ceruleus regulates sensory encoding by neurons and networks in waking animals. J Neurosci. 2006;26(39):9860–9872. doi: 10.1523/JNEUROSCI.1776-06.2006. [DOI] [PMC free article] [PubMed] [Google Scholar]
- 9.Newman LA, Darling J, McGaughy J. Atomoxetine reverses attentional deficits produced by noradrenergic deafferentation of medial prefrontal cortex. Psychopharmacology (Berl) 2008;200(1):39–50. doi: 10.1007/s00213-008-1097-8. [DOI] [PMC free article] [PubMed] [Google Scholar]
- 10.McGaughy J, Ross RS, Eichenbaum H. Noradrenergic, but not cholinergic, deafferentation of prefrontal cortex impairs attentional set-shifting. Neuroscience. 2008;153(1):63–71. doi: 10.1016/j.neuroscience.2008.01.064. [DOI] [PMC free article] [PubMed] [Google Scholar]
- 11.Loughlin SE, Foote SL, Bloom FE. Efferent projections of nucleus locus coeruleus: topographic organization of cells of origin demonstrated by three-dimensional reconstruction. Neuroscience. 1986;18(2):291–306. doi: 10.1016/0306-4522(86)90155-7. [DOI] [PubMed] [Google Scholar]
- 12.Loughlin SE, Foote SL, Fallon JH. Locus coeruleus projections to cortex: Topography, morphology and collateralization. Brain Res Bull. 1982;9(1-6):287–294. doi: 10.1016/0361-9230(82)90142-3. [DOI] [PubMed] [Google Scholar]
- 13.Loughlin SE, Foote SL, Grzanna R. Efferent projections of nucleus locus coeruleus: Morphologic subpopulations have different efferent targets. Neuroscience. 1986;18(2):307–319. doi: 10.1016/0306-4522(86)90156-9. [DOI] [PubMed] [Google Scholar]
- 14.Fallon JH, Loughlin SE. Monoamine innervation of the forebrain: Collateralization. Brain Res Bull. 1982;9(1-6):295–307. doi: 10.1016/0361-9230(82)90143-5. [DOI] [PubMed] [Google Scholar]
- 15.Waterhouse BD, Lin CS, Burne RA, Woodward DJ. The distribution of neocortical projection neurons in the locus coeruleus. J Comp Neurol. 1983;217(4):418–431. doi: 10.1002/cne.902170406. [DOI] [PubMed] [Google Scholar]
- 16.Waterhouse BD, Border B, Wahl L, Mihailoff GA. Topographic organization of rat locus coeruleus and dorsal raphe nuclei: Distribution of cells projecting to visual system structures. J Comp Neurol. 1993;336(3):345–361. doi: 10.1002/cne.903360304. [DOI] [PubMed] [Google Scholar]
- 17.Chandler D, Waterhouse BD. Evidence for broad versus segregated projections from cholinergic and noradrenergic nuclei to functionally and anatomically discrete subregions of prefrontal cortex. Front Behav Neurosci. 2012;6:20. doi: 10.3389/fnbeh.2012.00020. [DOI] [PMC free article] [PubMed] [Google Scholar]
- 18.Chandler DJ, Lamperski CS, Waterhouse BD. Identification and distribution of projections from monoaminergic and cholinergic nuclei to functionally differentiated subregions of prefrontal cortex. Brain Res. 2013;1522:38–58. doi: 10.1016/j.brainres.2013.04.057. [DOI] [PMC free article] [PubMed] [Google Scholar]
- 19.Dalley JW, Cardinal RN, Robbins TW. Prefrontal executive and cognitive functions in rodents: Neural and neurochemical substrates. Neurosci Biobehav Rev. 2004;28(7):771–784. doi: 10.1016/j.neubiorev.2004.09.006. [DOI] [PubMed] [Google Scholar]
- 20.Ramos BP, Arnsten AF. Adrenergic pharmacology and cognition: Focus on the prefrontal cortex. Pharmacol Ther. 2007;113(3):523–536. doi: 10.1016/j.pharmthera.2006.11.006. [DOI] [PMC free article] [PubMed] [Google Scholar]
- 21.Nagai T, Satoh K, Imamoto K, Maeda T. Divergent projections of catecholamine neurons of the locus coeruleus as revealed by fluorescent retrograde double labeling technique. Neurosci Lett. 1981;23(2):117–123. doi: 10.1016/0304-3940(81)90027-6. [DOI] [PubMed] [Google Scholar]
- 22.Robertson SD, Plummer NW, de Marchena J, Jensen P. Developmental origins of central norepinephrine neuron diversity. Nat Neurosci. 2013;16(8):1016–1023. doi: 10.1038/nn.3458. [DOI] [PMC free article] [PubMed] [Google Scholar]
- 23.Ishimatsu M, Williams JT. Synchronous activity in locus coeruleus results from dendritic interactions in pericoerulear regions. J Neurosci. 1996;16(16):5196–5204. doi: 10.1523/JNEUROSCI.16-16-05196.1996. [DOI] [PMC free article] [PubMed] [Google Scholar]
- 24.Williams JT, North RA, Shefner SA, Nishi S, Egan TM. Membrane properties of rat locus coeruleus neurones. Neuroscience. 1984;13(1):137–156. doi: 10.1016/0306-4522(84)90265-3. [DOI] [PubMed] [Google Scholar]
- 25.Lapiz MD, Morilak DA. Noradrenergic modulation of cognitive function in rat medial prefrontal cortex as measured by attentional set shifting capability. Neuroscience. 2006;137(3):1039–1049. doi: 10.1016/j.neuroscience.2005.09.031. [DOI] [PubMed] [Google Scholar]
- 26.Arnsten AF. Toward a new understanding of attention-deficit hyperactivity disorder pathophysiology: An important role for prefrontal cortex dysfunction. CNS Drugs. 2009;23(Suppl 1):33–41. doi: 10.2165/00023210-200923000-00005. [DOI] [PubMed] [Google Scholar]
- 27.Devilbiss DM, Berridge CW. Low-dose methylphenidate actions on tonic and phasic locus coeruleus discharge. J Pharmacol Exp Ther. 2006;319(3):1327–1335. doi: 10.1124/jpet.106.110015. [DOI] [PubMed] [Google Scholar]
- 28.Mehta MA, Goodyer IM, Sahakian BJ. Methylphenidate improves working memory and set-shifting in AD/HD: Relationships to baseline memory capacity. J Child Psychol Psychiatry. 2004;45(2):293–305. doi: 10.1111/j.1469-7610.2004.00221.x. [DOI] [PubMed] [Google Scholar]
- 29.Poyurovsky M, Faragian S, Fuchs C, Pashinian A. Effect of the selective norepinephrine reuptake inhibitor reboxetine on cognitive dysfunction in schizophrenia patients: An add-on, double-blind placebo-controlled study. Isr J Psychiatry Relat Sci. 2009;46(3):213–220. [PubMed] [Google Scholar]
- 30.Seu E, Lang A, Rivera RJ, Jentsch JD. Inhibition of the norepinephrine transporter improves behavioral flexibility in rats and monkeys. Psychopharmacology (Berl) 2009;202(1-3):505–519. doi: 10.1007/s00213-008-1250-4. [DOI] [PMC free article] [PubMed] [Google Scholar]
- 31.Devilbiss DM, Berridge CW. Cognition-enhancing doses of methylphenidate preferentially increase prefrontal cortex neuronal responsiveness. Biol Psychiatry. 2008;64(7):626–635. doi: 10.1016/j.biopsych.2008.04.037. [DOI] [PMC free article] [PubMed] [Google Scholar]
- 32.Berridge CW, et al. Methylphenidate preferentially increases catecholamine neurotransmission within the prefrontal cortex at low doses that enhance cognitive function. Biol Psychiatry. 2006;60(10):1111–1120. doi: 10.1016/j.biopsych.2006.04.022. [DOI] [PubMed] [Google Scholar]
- 33.Lammel S, et al. Unique properties of mesoprefrontal neurons within a dual mesocorticolimbic dopamine system. Neuron. 2008;57(5):760–773. doi: 10.1016/j.neuron.2008.01.022. [DOI] [PubMed] [Google Scholar]
- 34.Lammel S, et al. Input-specific control of reward and aversion in the ventral tegmental area. Nature. 2012;491(7423):212–217. doi: 10.1038/nature11527. [DOI] [PMC free article] [PubMed] [Google Scholar]
- 35.Kole MH, et al. Action potential generation requires a high sodium channel density in the axon initial segment. Nat Neurosci. 2008;11(2):178–186. doi: 10.1038/nn2040. [DOI] [PubMed] [Google Scholar]
- 36.Berridge CW, Abercrombie ED. Relationship between locus coeruleus discharge rates and rates of norepinephrine release within neocortex as assessed by in vivo microdialysis. Neuroscience. 1999;93(4):1263–1270. doi: 10.1016/s0306-4522(99)00276-6. [DOI] [PubMed] [Google Scholar]
- 37.Aston-Jones G, Cohen JD. Adaptive gain and the role of the locus coeruleus-norepinephrine system in optimal performance. J Comp Neurol. 2005;493(1):99–110. doi: 10.1002/cne.20723. [DOI] [PubMed] [Google Scholar]
- 38.Arnsten AF. Through the looking glass: Differential noradenergic modulation of prefrontal cortical function. Neural Plast. 2000;7(1-2):133–146. doi: 10.1155/NP.2000.133. [DOI] [PMC free article] [PubMed] [Google Scholar]
- 39.Berridge CW, et al. Differential sensitivity to psychostimulants across prefrontal cognitive tasks: Differential involvement of noradrenergic α₁ - and α₂-receptors. Biol Psychiatry. 2012;71(5):467–473. doi: 10.1016/j.biopsych.2011.07.022. [DOI] [PMC free article] [PubMed] [Google Scholar]
- 40.Arnsten AF. Stress signalling pathways that impair prefrontal cortex structure and function. Nat Rev Neurosci. 2009;10(6):410–422. doi: 10.1038/nrn2648. [DOI] [PMC free article] [PubMed] [Google Scholar]
- 41.Russell V, de Villiers A, Sagvolden T, Lamm M, Taljaard J. Differences between electrically-, ritalin- and D-amphetamine-stimulated release of [3H]dopamine from brain slices suggest impaired vesicular storage of dopamine in an animal model of Attention-Deficit Hyperactivity Disorder. Behav Brain Res. 1998;94(1):163–171. doi: 10.1016/s0166-4328(97)00177-0. [DOI] [PubMed] [Google Scholar]
- 42.Russell VA. Hypodopaminergic and hypernoradrenergic activity in prefrontal cortex slices of an animal model for attention-deficit hyperactivity disorder: The spontaneously hypertensive rat. Behav Brain Res. 2002;130(1-2):191–196. doi: 10.1016/s0166-4328(01)00425-9. [DOI] [PubMed] [Google Scholar]
- 43.Sagvolden T. Behavioral validation of the spontaneously hypertensive rat (SHR) as an animal model of attention-deficit/hyperactivity disorder (AD/HD) Neurosci Biobehav Rev. 2000;24(1):31–39. doi: 10.1016/s0149-7634(99)00058-5. [DOI] [PubMed] [Google Scholar]
- 44.Sagvolden T, Russell VA, Aase H, Johansen EB, Farshbaf M. Rodent models of attention-deficit/hyperactivity disorder. Biol Psychiatry. 2005;57(11):1239–1247. doi: 10.1016/j.biopsych.2005.02.002. [DOI] [PubMed] [Google Scholar]
- 45.Davies DL, Bouldin DW. A cluster separation measure. IEEE Trans Pattern Anal Mach Intell. 1979;1(2):224–227. [PubMed] [Google Scholar]
- 46.Core Team R 2013. R: A Language and Environment for Statistical Computing (R Foundation for Statistical Computing, Vienna, Austria)
- 47.Walesiak M, Dudek A. 2014. clusterSim: Searching for Optimal Clustering Procedure for a Data Set, R package version 0.43-3. Available at http://CRAN.R-project.org.
Associated Data
This section collects any data citations, data availability statements, or supplementary materials included in this article.