Abstract
We use molecular dynamics simulations to examine the dynamical heterogeneity of a model single-component lipid membrane using a coarse-grained representation of lipid molecules. This model qualitatively reproduces the known phase transitions between disordered, ordered, and gel membrane phases, and the phase transitions are accompanied by significant changes in the nature of the lipid dynamics. In particular, lipid diffusion in the liquid-ordered phase is hindered by the transient trapping of molecules by their neighbors, similar to the dynamics of a liquid approaching its glass transition. This transient molecular caging gives rise to two distinct mobility groups within a single-component membrane: lipids that are transiently trapped, and lipids with displacements on the scale of the intermolecular spacing. Most significantly, lipids within these distinct mobility states spatially segregate, creating transient “islands” of enhanced mobility having a size and time scale compatible with lipid “rafts,” dynamical structures thought to be important for cell membrane function. Although the dynamic lipid clusters that we observe do not themselves correspond to rafts (which are more complex, multicomponent structures), we hypothesize that such rafts may develop from the same universal mechanism, explaining why raft-like regions should arise, regardless of lipid structural or compositional details. These clusters are strikingly similar to the dynamical clusters found in glass-forming fluids, and distinct from phase-separation clusters. Further examination shows that mobile lipid clusters can be dissected into smaller clusters of cooperatively rearranging molecules. The geometry of these clusters can be understood in the context of branched equilibrium polymers, related to the statistics percolation theory. We discuss how these dynamical structures relate to a range observations on the dynamics of lipid membranes.
I. INTRODUCTION
Lipid membranes are among the most intensely studied forms of condensed matter. Yet many aspects of these ubiquitous biological structures remain poorly understood, especially dynamical characteristics related to their function in living systems. It is widely appreciated that heterogeneity of the membrane is essential to biological function, and in living membranes is often discussed as the “lipid-raft” concept [1]. However, the definition and experimental quantification of dynamically heterogeneous structures of membranes and monolayers – and their relation to lipid raft formation – remains an ongoing challenge [2]. This unsatisfactory situation exists even in the case of single-component lipid bilayer membranes, where supramolecular assembly and phase separation of the myriad components of living cell membranes do not complicate investigation [3]. Nonetheless, even without the complex structures of living cells, it is apparent that single component membranes can be intrinsically heterogeneous [4–7]. Consequently, a first principles explanation of membrane heterogeneity in biological systems naturally begins by properly understanding the intrinsic heterogeneity of simple, single-component membranes.
While there has been much focus on structural aspects of membranes based on the lipid raft model, there is an increasing appreciation of heterogeneity in the dynamics and the potential impact of this phenomenon for diverse biophysical phenomena. In particular, there has been examination of coordinated lipid movement in recent simulations of lipid dynamics [5–9] and inferred by neutron scattering measurements [10]. Similar coordinated motion has been widely studied in measurements of glass-forming liquids [11–13], and some lipid simulation studies briefly mention the qualitative similarity of `dynamic heterogeneity' in the lipid membranes to observations in glass-forming liquids. However, these works do not consider a quantitative comparison between the dynamics of lipid membranes and glass-forming liquids based on the established theoretical tools for quantifying collective motion in the field of glassy materials formation. The present work focuses exactly on such a comparison, and our analysis reveals striking quantitative similarities between the collective and heterogeneous dynamics of glass-forming liquids and the dynamics of lipid membranes. Moreover, this heterogeneity may play an important role for understanding the dynamical structure of `rafts' in living membranes.
Any unifying framework for the dynamics of membranes and raft-like heterogeneity must account for a number of basic physical characteristics, including: (i) the occurrence of coexisting “immobile” and “mobile” lipid molecules that exhibit different displacement kinetics in single particle molecular tracking studies [5, 14]; (ii) intermittency of protein displacements, the occurrence of coexisting mobile and immobile protein populations, and the correlated displacement of proteins within cells [15, 16] (iii) the occurrence of collective particle rearrangement motions, a phenomenon observed directly in membrane associated proteins in living cells [15, 17], as well as in model lipid membranes [6, 7]; (iv) the formation of island and hole structures of the membrane topography that seem to persist at equilibrium, even in single-component lipid films [4, 18, 19]; (v) a strong sensitivity of the fluidity of lipid membranes to molecular additives (e.g., anesthetics, antibiotics, neurotransmitters, proteins) that influence molecular packing in the lipid layer [20–26]; Many of the referenced studies have emphasized the shortcomings of continuum theory for these materials, and some invoke free volume ideas developed in the theory of glass-forming liquids to rationalize trends in lipid mobility data [27–29], further suggesting the connection to the physics of glass-forming liquids.
As a step towards a molecular based understanding of these dynamical features, we quantify and explain the nature of heterogeneity of lipid dynamics via simulation of a single-component lipid bilayer. We consider how our findings account for many of the aforementioned observations, the possible connection between the dynamics of lipid membranes and glass-forming liquids, and the relation to the concept of lipid rafts. To this end, we examine a simple, coarse-grained model for a lipid that has been demonstrated to reproduce many of the canonical feature of lipid membranes [30, 31]. We choose this simple representation because it allows us to readily examine both the phase behavior, as well as dynamical behavior on the millisecond time scale, while still being feasible using current typical computational resources. Due to the coarse-grained nature of our lipid model, our simulations are intended to describe general trends and essential aspects of lipid transport rather the properties of any particular lipid membrane. In particular, we observe clear evidence for cooperative lipid motion and define a precise metric for this motion that should give guidance for measurements aimed at quantifying collective motion in membranes. Specifically, our findings indicate that the dynamics within the liquid-ordered (LO) phase of the membrane exhibits significant heterogeneity in the lipid mobility, where lipid molecules can be unambiguously partitioned into two well-defined classes, caged and mobile lipid molecules. Importantly, the mobile lipids strongly segregate into transient islands having a size and time scale compatible with lipid raft structures, suggesting that raft behavior may develop in large part due to the inherent dynamical heterogeneity of the lipid molecules. Additionally, we examine the precise nature of the cooperativity of lipid motion within the fractal mobile regions, and find that motion is dominated by a replacement mechanism of the molecules, in striking accord with glass-forming liquids. We finally discuss how these findings fit with many of the above observations on real membranes.
Our findings for the dynamical heterogeneity of the membrane share many striking similarities to the dynamics of glass-forming liquids. Obviously, lipid membranes are distinct from glass-forming liquids, but the strong intermolecular interactions in both systems apparently lead to a similar tendency for dynamical clustering and collective motion. Likewise, recent studies on the interfacial dynamics of nanoparticles [32], the melting and freezing of nanoparticles [33], the melting of crystals [34], and the dynamics of grain boundaries [35–37] have revealed similar dynamical features, further supporting the possible universal nature of collective molecular motion in strongly interacting condensed materials. Consequently, further exploration of the the degree of universality in the underlying dynamical structure of these materials is merited using computational tools and theoretical ideas developed previously in the field of glassy materials.
II. MODELING AND SIMULATIONS
In order to facilitate the study of large time scales associated with the slowing of molecular motion in the ordered phase of a lipid bilayer, we have chosen to use a very simple, solvent free, coarse-grained model for lipid molecules developed by Cooke, Kremer and Deserno [30, 31]. This model represents a lipid by three beads, with one head-bead and two tail-beads (Fig. 1). To mimic the behavior of lipids, there are favorable interactions between lipid tails, and neutral head interactions. It has been demonstrated that this model captures the important qualitative features of lipids, including the spontaneous formation of a bilayer. A detailed description of the model is provided by Cooke and Deserno [30]. Here, we briefly cover the most important features associated with the present study.
FIG. 1.
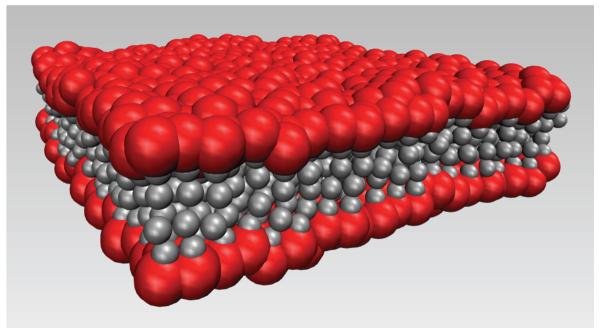
Simulation snapshot of a typical bilayer at T = 287 K. The red beads are the hydrophilic heads, and the grey beads are the hydrophobic tails. Beads are not drawn to scale.
The excluded volume of each lipid bead is represented by a Weeks-Chandler-Andersen (WCA) potential, i.e. a Lennard-Jones (LJ) potential that is truncated and shifted at the location of the minimum so that there is only core-repulsion. The WCA interactions between tail beads have a diameter σ, while head-head and head-tail beads have an interaction diameter 0.95σ. Connectivity between the three beads is provided by a finitely extensible non-linear elastic (FENE) bond potential [38]. Additionally, the lipids are stiffened by a harmonic bending potential between the head bead and the further tail bead. A key for the success of this coarse-grained representation is the ability to tune the range of the attractive interactions between tail beads. Two functional forms have been considered for this expandable range [30], and here we choose to adopt the expandable Lennard-Jones representation. More specifically, between tail beads, we use a LJ potential were the minimum is expanded by inserting a `flat' region of size wf. We choose wf = 0.3σ, which yields a substantial range of simple fluid behavior for a tensionless membrane [30].
For this simple coarse-grained model, quantities can be expressed in reduced Lennard-Jones units, where ∊ (the LJ energy scale) is the unit of energy, length is in units of σ, and time is in units . For the purposes of relating to experiments, it is useful to map these reduced units to physics units. While the model should not be taken as a quantitative representation of any specific lipid, we can approximately map these reduced units to physical values, given the typical scales of lipid membranes. Assuming a typical membrane thickness ≈ 5 nm, σ ≈ 0.7 nm. Given a diffusion coefficient in the simple fluid phase ≈ 1 μm2/s, τ ≈ 10 ns [30]. Finally, the transition between disordered and ordered fluid states for a lipid like DPPC (dipalmitoylphosphatidylcholine) occurs around 315 K [39, 40]. This allows us to set an approximate energy scale ∊ ≈ 4.6 kJ/mol. To simplify comparison to experiments, we will use this mapping in the presentation of our results.
Our findings are based on a series of molecular dynamics (MD) simulations for a lipid membrane consisting of N = 1250 lipids in a cubic simulation box with periodic boundary conditions, using the LAMMPS MD suite [41]. To implement the model in LAMMPS, we added the LJ potential with an expandable range to LAMMPS (code available upon request). For each of the 14 temperatures between T = 0.5 and T = 1.0 (reduced units), we first perform a preliminary simulation at fixed isotropic pressure P = 0 to determine the equilibrium area per lipid. Since surface tension is define by the difference between lateral and transverse pressure, which are both zero in this case, the membrane is tensionless. Using the resulting volume values, we carry out further equilibration with a fixed simulation box size in the NVT ensemble, controlling temperature via a Nosé-Hoover thermostat [42]. These are the starting configurations for our production simulations, which are also carried out at fixed box size, corresponding to tensionless membranes. For each T, we simulate from 24 to 72 independent trajectories, to improve our statistics. For T ≤ 0.56 (the Lo phase, in reduced units), production and equilibration runs are each 108 steps, with an integration time step δt = 0.006, mapping to ≈ 6 ms of real time. At higher T, we run 107 steps, or ≈ 0.6 ms of real time.
III. MEMBRANE THERMODYNAMICS AND STRUCTURE
Before we examine the dynamics of our model membrane system, we briefly characterize the thermodynamics and structure of the membrane to orient ourselves with respect to experimentally known behavior of a typical lipid membrane.
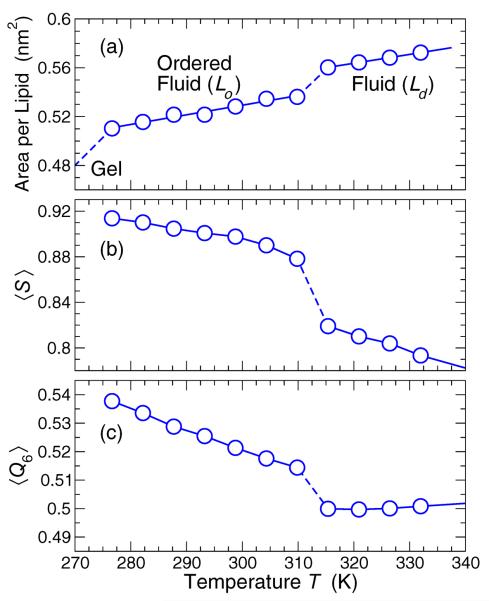
Simple lipid membranes, such as made from DPPC or DMPC, exhibit a quasi-2D liquid-liquid phase transition between states with distinct areal density [40]. The high temperature fluid phase phase is disordered, with weak tail orientation, and has relatively large mobility. This phase is commonly referred to at the liquid-disordered (Ld or Lα) phase. On cooling the Ld phase condenses to a liquid-ordered (Lo) phase, which is more densely packed, has greater tail orientation, and has lower mobility. At even lower T, there are gel states with near vanishing mobility. We first precisely identify these states for the tensionless membrane. Figure 2 shows the mean area per lipid A as a function of temperature T for a tensionless membrane which exhibits a discontinuous drop in A. The values of A correspond to densely packed fluid phases, as opposed to a gas-like state. For the tensionless membrane, the Lo-Ld transition occurs between temperatures 310 K to 315 K. We also confirmed that the transition between the Lo and Ld phase can be driven by lateral pressure under isothermal conditions. Thus, the qualitative behavior of the areal density matches physical expectations. At even lower T ≈ 275 K, the membrane has a transition to a denser gel phase with near vanishing mobility. (Mobility is evaluated in the next section). The large time scales needed to study low mobility prevents us from equilibrium study of the gel state.
FIG. 2.
(a) The lipid areal density has a clear transition from a liquid disordered (Ld) to a liquid-ordered (Lo) state around temperature T = 315 K, and to a gel phase at lower T . (b) The tail orientational order parameter 〈S〉 shows an increase in orientation of lipids along the axis perpendicular to the membrane in the Lo phase. (c) The rotationally invariant order parameter 〈Q6〉 shows an increase in hexatic ordering of the head beads entering the Lo phase.
The Lo-Ld transition is accompanied by changes in the lipid structure. The Lo phase is expected to exhibit a greater degree of orientation of the tails. We quantify the lipid orientation by the orientational order parameter,
| (1) |
where uz is the z-component of the head-to-tail unit vector of the lipid, and that z is average normal direction to the membrane. A value 〈S〉 = 1 corresponds to alignment perpendicular to the plane of the membrane, while 〈S〉 = 0 corresponds to an isotropic system. The inset of Fig. 2(b) shows that 〈S〉 increases discontinuously at the same time as A decreases. Therefore, as expected from experiment, the denser phase is accompanied by an increased orientation of lipid tails.
The increased lipid density in the Lo phase also gives rise to increased orientational order of the lipid heads in the membrane plane. For example, in DPPC, lipids in the Lo phase pack with predominantly hexagonal order in the membrane plane [43]. Such orientational order can be quantified by an orientational order parameter ψ6 = Σj 〈exp(6iϕij)〉, where ϕij is the angle between neighboring lipids i and j. However, this measure is only meaningful if we can define a preferred orientation. Since the membrane lacks long-range order (as we shall briefly show), such a preferred orientation cannot be globally defined. Instead, we use the rotationally invariant orientational order parameter
| (2) |
where Y6m(θ, ϕ) is the spherical harmonic function, and the sum on j is over Nb nearest neighbors. Since we are interested only in the order in the plane of the membrane, we take θ = π/2, and ϕ is the angle in the membrane plane between near neighbors with respect to the arbitrary coordinate system. Since this quantity is rotationally invariant, the choice of coordinate system does not affect the value of Q6. The sixth spherical harmonic is chosen since it yields the largest value for an ideal hexagonal lattice, Q6 ≈ 0.741.
Fig. 2(c) shows that, like A and 〈S〉, 〈Q6〉 also changes discontinuously entering the Lo phase. 〈Q6〉 increases in the Lo phase relative to the Ld phase, indicative of increased lateral order, but is still considerably smaller than that of a perfect hexagonal lattice, indicating a substantial degree of disorder.
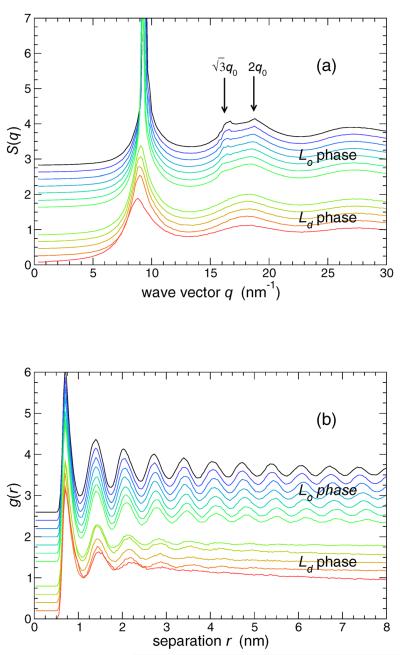
To formally confirm that these are indeed liquid (amorphous) ordered membranes, as opposed to crystalline ordered, we evaluate the static structure factor S(q) for the lipid heads in the plane of the membrane. Figure 3 demonstrates the amorphous structure of both phases, as there are no Bragg peaks beyond the characteristic first neighbor peak at q0 ≈ 9.3 nm−1. However, note the there is a significant increase in the ordering of the high-density phase (compare S(q) just above the transition with just below). Specifically, in the Lo phase, there are two features located at and 2q0, the expected locations for a triangular lattice. This type of ordering is commonly observed in 2D, and is referred to as a hexatic phase [44, 45]. The hexatic phase is characterized by exponential positional but quasi-long-range orientational correlations, and a first-order transition between the liquid and hexatic phases (as observed in Fig. 2) has been robustly demonstrated for 2D liquids [46].
FIG. 3.
The in-plane structure of the lipid heads, quantified by (a) the structure factor S(q) and (b) radial distribution function g(r). The hexatic ordering of the lipids in the Lo phase is characterized by secondary features in S(q) indicated by the arrows. Similarly, the order is also reflected in the persistent oscillations of g(r). For reference to later figures, note that first neighbors can be defined as those beads with a separation less than the first minimum of g(r), which occurs at r ≈ 1.05 nm. Curves are shifted vertically for clarity of the figure: lowest T is at the top, highest T is at the bottom. A larger gap is left between data for the Lo and Ld phases.
Finally, to complete the characterization of static structure of our model membrane, we also include the radial distribution function g(r) in the membrane plane, which is related to S(q) via Fourier transform. Fig. 3 shows that, in the Lo phase, there is rather long-ranged order, as would be expected for hexatic structure.
IV. MEMBRANE DYNAMICS
A. Lipid Diffusion
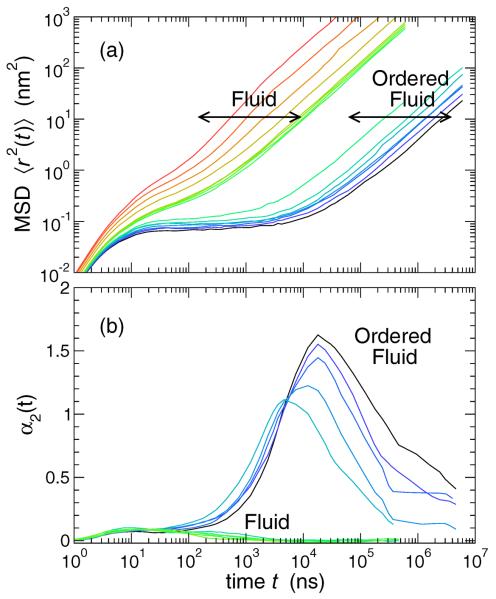
We first characterize the mean membrane dynamics in terms of mean lipid mobility. With experimental diffusion measurements in mind, we evaluate the mean-squared displacement 〈r2(t)〉 of the lipid head beads in the plane of the membrane, as shown in Fig. 4(a). In the high T liquid-disordered phase, 〈r2(t)〉 is ballistic as very short time t (i.e. 〈r2(t)〉 ~ t2) and crosses over to linear (〈r2(t)〉 ~ t) behavior at larger t, as expected for simple diffusion. Note that, on the time and length scale of ballistic motion in the simulation, the dynamics are not physically relevant, since the model has coarse-grained the atomic details at this scale; only motion beyond the nanosecond scale is physically meaningful for the simulated lipid dynamics. Below the transition to the Lo phase, there is a dramatic gap in 〈r2(t)〉, demonstrating that the Lo phase is significantly less mobile, as expected. Moreover, 〈r2(t)〉 exhibits a substantial plateau region. This plateau is characteristic of the transient `caging' of lipids by nearest neighbors which hinders diffusion. At sufficiently large t, lipids `escape' from their cages and a linear (diffusive) behavior of 〈r2(t)〉 is recovered.
FIG. 4.
(a) The in-plane mean-squared displacement 〈r2(t)〉 of lipid heads. The gap in the data occurs at the Lo-Ld transition. In the L0 phase, 〈r2(t)〉 shows a substantial t-range where the displacement is nearly constant. This transient `caging' is a universal characteristic of fluids approaching a glass transition. (b) The non-Gaussian parameter α2(t). In the Lo phase, α2 shows a pronounced peak, which grows larger on cooling, indicating the non-Gaussian nature of bead displacements. The characteristic time t* of the large peak of α2(t) also grows on cooling.
This transient caging feature of 〈r2(t)〉 is ubiquitous in glass-forming fluids, where the diffusion coefficient becomes vanishingly small. This plateaus is a first indication that the dynamics of liquid-ordered phase might share some basic characteristics of glass-forming liquids, motivating a more careful analysis from the perspective and tools conventionally applied to glass-forming liquids. We evaluate the in-plane diffusion coefficient from the Einstein relation,
| (3) |
Figure 5 shows that the change in the behavior of 〈r2(t)〉 results in a discontinuous drop in D at the Lo-Ld transition by more than a factor 10. For T below the lowest T shown, the system enters the gel state, and D is smaller that we can estimate from equilibrium simulations. We now consider how local fluctuations in the mobility affect the mean lipid molecular displacements.
FIG. 5.
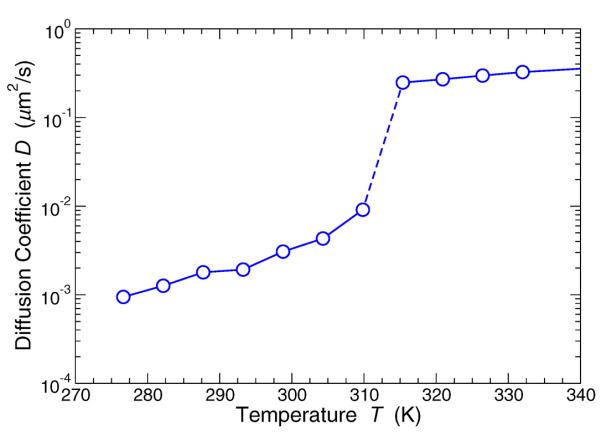
The diffusion coe cient extracted from the asymptotic t behavior of 〈r2(t)〉. The transition to the Lo phase is marked by a drop of D by more than a factor 10.
In the cases of ballistic or diffusive motion, displacements are known to follow a Gaussian distribution. In contrast, on the time scales of transient caging in glass-forming systems, displacements are typically not Gaussian, and the degree of deviation is commonly quantified by the the non-Gaussian parameter α2(t), which in 2D has the form
| (4) |
For Gaussian displacements, this ratio of moments should be zero, and otherwise positive. Figure 4(b) shows that α2(t) ≈ 0 for all t in the high T, Ld state, where 〈r2(t)〉 has correspondingly simple behavior. In the Lo state, the transient caging is accompanied by significant growth of α2(t), which dissipates for large t as diffusive time scales are reached. Accordingly, α2(t) has a characteristic time t* on which displacements are most non-Gaussian. The amplitude of both α2(t*) and t* increase on cooling, as the transient caging become progressively more pronounced.
In glass-forming fluids [47], as well as in the more obviously related case of the hexatic phase of 2D fluids [48], the origin of this non-Gaussian behavior arises from correlations in the motion of a modest fraction of atoms or molecules that vary both spatially and temporally. This phenomenon is commonly referred to as dynamical heterogeneity in the literature on glass formation [11, 12, 49]. To discern the different contributions to intermolecular motion, it is valuable to examine the van Hove correlation function Gs(r, t), which quantifies the distribution of particle displacements r at a time t. Accordingly, Fig. 6 shows Gs(r, t*) for the lipid heads, when lipid displacements show the largest deviation from a simple Gaussian distribution. Gs(r, t*) has a pronounced peak at small displacements, and a long tail, extending to more than the interparticle spacing of the head groups. This general feature is again a universal feature of glass-forming fluids.
FIG. 6.
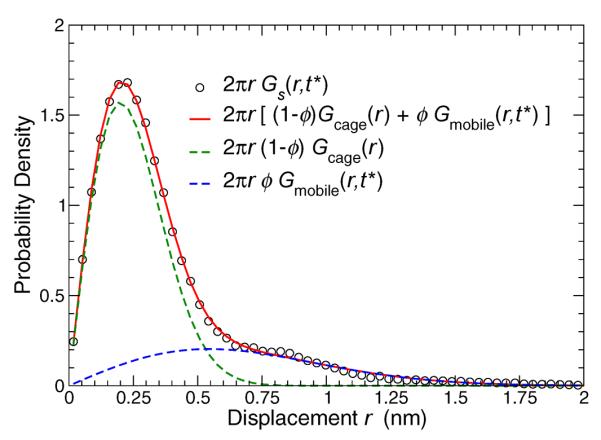
(a) The van Hove function 2πrGs(r, t*) at the time t* of the maximum of non-Gaussian behavior for a representative T = 293 K. The van Hove is well-described by a super-position of two Gaussian functions, representing localized, low-mobility lipids (green line), and highly-mobile lipids (blue line). The red line shows that the superposition of these terms describes well the simulation results (circles).
Importantly, it is possible to dissect Gs(r, t*) into two distinct groups. The transient trapping of lipids has a characteristic size scale 〈u2〉 defined by the value of 〈r2(t)〉 in the plateau region (Fig. 4(a)). If the displacements within this cage region are Gaussian, then the van Hove of these trapped particles should obey
| (5) |
Figure 6 show that such a Gaussian accounts well for the primary peak of Gs(r, t*). Hence, the tail of Gs(r, t*) should be associated with those head beads which are able to escape their local surrounding.
If we assume these mobile lipids can also be described by a Gaussian
| (6) |
with a characteristic displacement , then we can describe Gs(r, t*) to high precision by the superposition of Gaussian functions
| (7) |
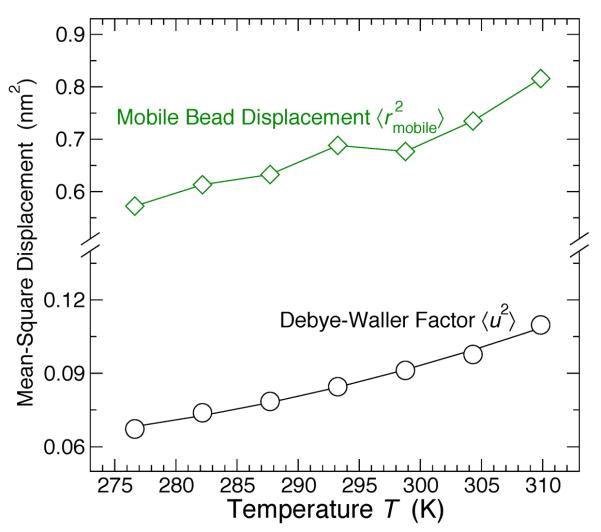
where ϕ represents the fraction of mobile lipids. Considering the behavior of Gs(r, t*) for all T in the liquid-ordered state, Fig. 7 shows the T dependence of 〈u2〉, . Note that 〈u2〉 is determined directly from the plateau value of 〈r2(t)〉 (see fig. 4(a)), while and ϕ are left as fit parameters. The mean mobile bead displacement varies from 1.1 to 1.3 bead diameters – slightly larger than the typical bead spacing. We find that the fraction ϕ of mobile lipids is roughly constant, with a mean value of ϕ = 0.267 averaged over all T in the Lo phase. For the remainder of the manuscript, mobile lipids are defined as the fraction ϕ = 0.267 of the most mobile lipids over any given interval t.
FIG. 7.
The Debye-Waller factor (determined independently) for the localized lipids (black), and mean-square displacement of mobile lipids (green). These values are used in the description of the van Hove functions for mobile and immobile lipids, given in eqs. 5 and 6.
In summary, we have built a picture of single lipid motion that can be partitioned into two groups: those lipids that `rattle' in the local environment defined by their neighbors, and a smaller fraction ϕ of lipids that move roughly an interparticle spacing, presumably displacing (or replacing) a neighboring lipid.
B. Mobile Lipid Clusters and Cooperative Motion
In a variety of strongly interacting condensed materials, a broad distribution of molecular mobility is accompanied by a tendency for those atoms or molecules with similar mobility to cluster, and for highly mobile molecules to move in a cooperative fashion. Accordingly, we now examine the spatial correlations of molecular motion within the lipid bilayer, where qualitatively similar physical conditions are operative.
Having already established that there are two broad mobility classes within our membrane, the first consideration is to visualize the location of these different groups. Figure 8(a) shows the head beads on one side of a typical bilayer, where the beads are colored according to whether they are mobile (red) or caged (white) over the time interval t*. From this image, it is readily apparent that there are strong spatial correlations in these groups that result in substantial lipid molecule clustering. Figures 8(b) and (c) show a further dissection of the collection of mobile head beads, into sub-groups that move cooperatively, which we discuss later in this section.
FIG. 8.
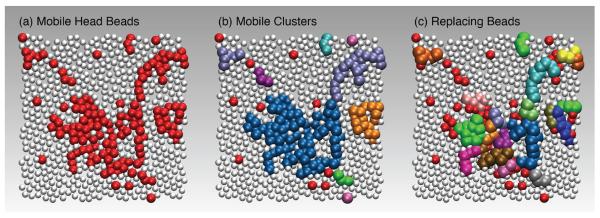
A representative simulation snapshot at T = 293 K of the head beads in a bilayer: (a) mobile beads are colored red, and caged beads are white; (b) mobile beads are colored by the distinct clusters that they form; (c) within each cluster, we color distinctly those particles that replace each other, resulting in many quasi-string-like structures. The configuration used for all panels is identical, to facilitate comparison. All beads have the same diameter, but are not drawn to scale for the purposes of visualization.
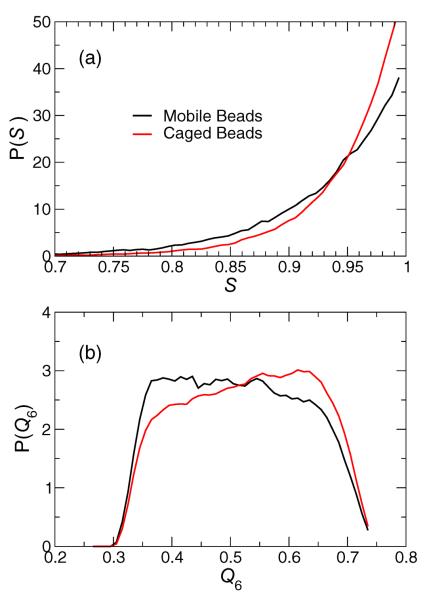
The strong spatial correlation in the locations of the mobile lipid molecules is reminiscent of the formation of phase separation domains in the vicinity of a critical point for a phase transition [50]. Consequently, it is natural to check whether there is a structural distinction between these groups that might be attributable to domains with order like the Ld or Lo phase. Indeed, an evaluation of the the local orientational measures S or Q6 shows that the mobile regions have a slightly smaller mean order (by ≈ 5 %), while immobile regions also have a slightly enhanced mean order (also by ≈ 5 %). However, this does not mean an individual lipid molecule can be identified as mobile or immobile based simply on their local orientation. The reason is that the distribution of S or Q6, shown in Fig. 9, is very broad, so that a lipid with a given local order might well be either mobile or immobile. In other words, while there is a correlation between mean structure and mobility, this correlation is weak when viewed at a local, single molecule scale. The absence of a clear structural signature in these mobility groups indicates that clustering is not a manifestation of phase separation domains associated with the Lo-Ld phase transition. We provide further evidence to support this assertion below.
FIG. 9.
(a) The distribution P(S) of tail orientations S for mobile and immobile head beads. While the means of these distributions differ, the overlap between them precludes using the value of S as a structural tag to differentiate mobility. (b) Similar to (a), the distribution P(Q6) of hexagonal order Q6 for mobile and immobile groups shows broad overlap.
To move beyond the qualitative observation that mobile heads tend to group together, we quantify the size of clusters formed by these beads. To do so, for each interval t, we examine the fraction ϕ = 0.267 (determined in the previous section) of the most mobile lipids. We define a cluster of mobile lipids as those mobile beads that are nearest neighbors, where nearest neighbors are defined as beads having a separation less than 1.05 nm – the location of the first minimum of the pair correlation function g(r) (see Fig. 3(b)). Such a cluster analysis only makes sense only in the Lo phase, since in the Ld there is no apparent distinction of mobility classes. A visualization of typical clusters of mobile head beads is shown in Fig. 8(b).
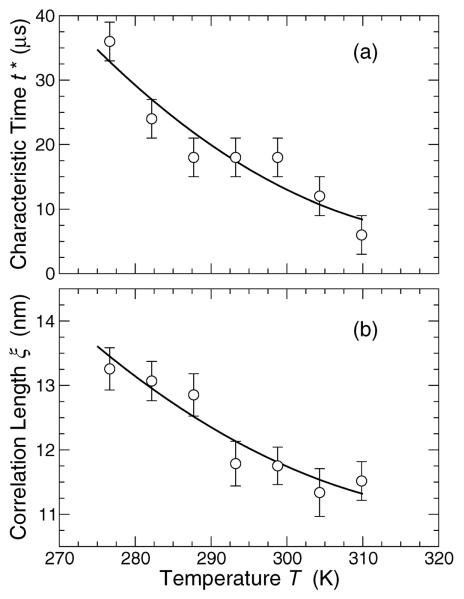
On the time scale t* when non-Gaussian displacements are most pronounced (5 to 40 μs, depending on T; see fig. 10a), there is substantial clustering of beads, which we can quantify by a correlation length
| (8) |
where n(s) is the size of cluster s, and the radius of gyration
| (9) |
where i and j denote particle indices within a cluster. The correlation length ξ is the radius of clusters that give the primary contribution to the second moment of the cluster size distribution. Thus, ξ is characteristic of larger clusters, while 〈Rg〉 is more reflective of smaller clusters when small clusters predominate. Figure 10b shows that ξ grows modestly on cooling, and lies in the range from 10 nm to 15 nm.
FIG. 10.
(a) The characteristic time t* from the non-Gaussian parameter α2(t) shown in fig. 4b. (b) The corresponding characteristic size ξ of mobile particle clusters, which grows on cooling below the Lo-Ld phase transition.
The important biological question is whether these domains are related to collective motion and raft structures that aid biological function in lipid membranes. Given the simplicity of our model, and the lack of important components of living membranes, we cannot unambiguously answer this question. One concern that about suggesting a connection with rafts is that the we observe clusters of enhanced mobility in a relatively immobile background of the Lo phase, while rafts are normally envisioned to correspond to relative low mobility and ordered molecules in island-like groupings surrounded by a more fluid background. This might render the comparison between the structures we observe and rafts moot, but it is worthwhile to make some general observations on this important question. Raft domains should be a few protein diameters (10 nm to 100 nm) and have a minimum lifetime corresponding to a short enzyme turnover time (order of μs) to be biologically significant [2]. Our dynamical clusters indeed occur such size and time scales (≈ 10 μs and 10 nm), suggesting that this intrinsic heterogeneity may help promote the organization of complex raft structures in living membranes. Additionally, in glass-forming systems, the appearance of clusters of high mobility molecules is normally also accompanied by clusters of low mobility molecules with similar size and time scales [51], and we expect this feature to naturally arise in multicomponent lipids where macroscopic crystal ordering is frustrated. The absence of such low mobility clusters in this simple membrane model may be an artifact of the model. The real test of the possible relation between intrinsic dynamic heterogeneity and raft-like structures requires the simulation of more realistic multicomponent lipid membranes. That said, the single component membrane is an important reference state for comparison to the multicomponent lipid simulations.
We emphasize that the our mobile lipid clusters are inherently dynamic in nature, which we quantify by the dynamic equilibrium mean cluster mass 〈n(t)〉 as a function of the observation window t; the inset of Fig. 11 shows 〈n(t)〉 for all T in the Lo phase. As previously indicated, clustering is greatest on the time scale t* where α2(t) is most pronounced. In contrast, at small t, where motion is primarily vibrational, we do not expect significant clustering of mobility groups. In line with expectation, 〈n(t)〉 is small for small t, and equal to the size of clusters that would be formed simply by picking a fraction of beads ϕ randomly. Similarly, at long times t where motion is Brownian, there is little clustering.
FIG. 11.
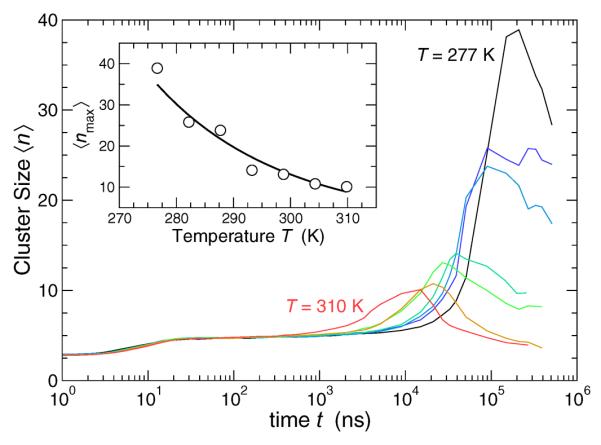
The mean cluster size 〈n(t)〉 of mobile lipids in the Lo phase as a function of the observation window t. Clustering is most pronounced on the same time scale that displacements are most non-Gaussian. Clustering diminishes on the time scale of diffusive motion. The inset shows the characteristic peak cluster size grows on cooling away from the Lo-Ld phase transition.
The observation the characteristic size of clusters grow on cooling below the Lo-Ld transition is particularly germain to the question of whether or not these clusters are connected with phase transition phenomena. If the clusters were associated with the phase transition, they should grow approaching the Lo-Ld phase transition. Instead, the clusters grow only on cooling as we go away from the Lo-Ld phase transition. Moreover, the characteristic size of dynamic clusters is an equilibrium quantity, independent of the waiting time for an observation. In contrast, phase separation clusters progressively grow and coarsen with waiting time. Our observation of growing dynamical clusters on cooling is precisely in line with the observations in glass-forming fluids. Thus, the growth of these clusters is apparently due to the increasing propensity for collective motion as the thermal energy is reduced and molecular packing becomes congested.
We next wish to provide physical insight in the to factors controlling the structure of these clusters. To do so, we quantify the statistical geometry of clusters at time interval t* by the fractal dimension df, defined by the scaling of cluster size
| (10) |
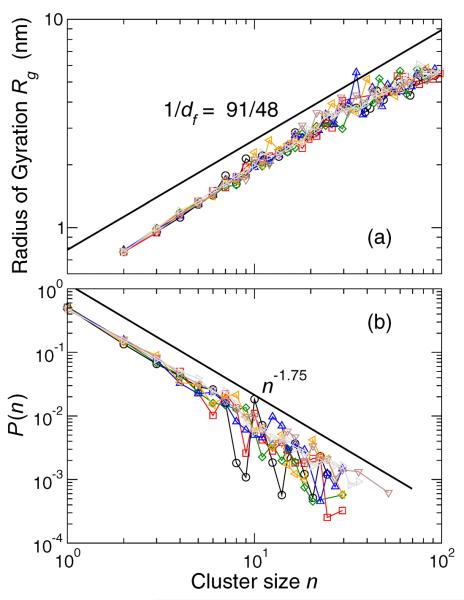
Figure 12(a) shows that at all T, df ≈ 91/48 ≈ 1.9. This value is particularly significant, since it matches the known fractal dimension of near critical percolation clusters [52]. Accordingly, concepts from percolation theory and polymer physics may be useful to understand cluster structure. In a recent study of a 3D glass-forming polymer melt, the fractal dimension of highly mobile clusters was shown to approach that of percolation clusters in 3D [51]. Thus, there appears to be consistency in the statistical geometry of these clusters across vastly different systems.
FIG. 12.
(a) Mobile lipid radius of gyration Rg as a function of cluster size, which determines the fractal dimension df. Different data sets are different T . For 2D percolation clusters near the percolation threshold, df = 91/48 [52], indicated by the bold line. Clusters are examined for all T in the Lo phase at interval t*. (b) The distribution of cluster sizes of mobile lipids. The functional from of P(n) comes from percolation theory [52].
If these clusters are indeed like those formed by a percolation process, we expect that the cluster size distribution P (n) can be described by a power law with an exponential cut-off, namely
| (11) |
In the case of 2D percolation near the transition, we expect τ = 187/91 ≈ 2.05. Figure 12(b) shows that P(n) does follow the expected functional form, but that τ ≈ 1.75, a value smaller than would be expected from ordinary percolation theory.
While the above analysis demonstrates that mobile head beads are spatially correlated and form clusters similar to those of percolation clusters, it does not answer the question of whether the motion of these beads any kind of collective nature. Given the evident similarities to glass-forming fluids, we consider if the clusters can be further dissecting into subgroups of particles that cooperatively replace each other, as in glass-forming fluids. To do so, we follow the established procedure [53] of building clusters of replacing beads within a mobile lipid cluster. We refer to these as cooperatively rearranging clusters (CRC). Clearly, the largest size of a CRC is limited by the mobile lipid cluster size. Following ref. [53] two mobile beads are in the same CRC if, over an interval t, one head bead has replaced the other within a radius δ = 0.6 σ = 0.42 nm. We have checked that the qualitative features of our findings are not affected by reasonable changes in the value δ. A visualization of the CRC within clusters of mobile head beads is shown in Fig. 8(c). From this image, it is apparent that many of these CRC groups form roughly co-linear regions, commonly referred to as `strings' in the context of glass-forming systems [53].
Figure 13 quantifies the average number of lipid heads 〈L〉 in a cooperatively rearranging cluster in the Lo phase as a function of the interval t, for all T studied. As in the formation of the related mobile lipid clusters, there is no cooperativity on very small time or very large time scales, but on the intermediate scale where the mean motion is non-Gaussian and clusters emerge, the size scale of replacing beads is largest. Not surprisingly, these CRC are substantially smaller than the mobile lipid clusters. Accordingly, percolation of these cooperatively rearranging clusters is rare, so that finite size affects should not be an issue.
FIG. 13.
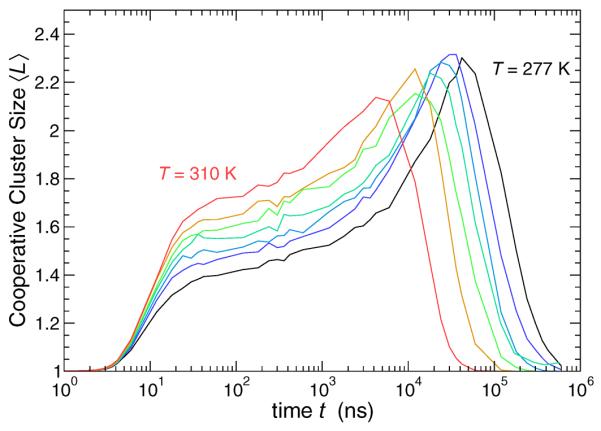
Mean size 〈L(t)〉 of the cooperatively replacing clusters (CRC). The behavior is similar to the mean cluster size 〈n(t)〉, but cooperative subgroups are much smaller.
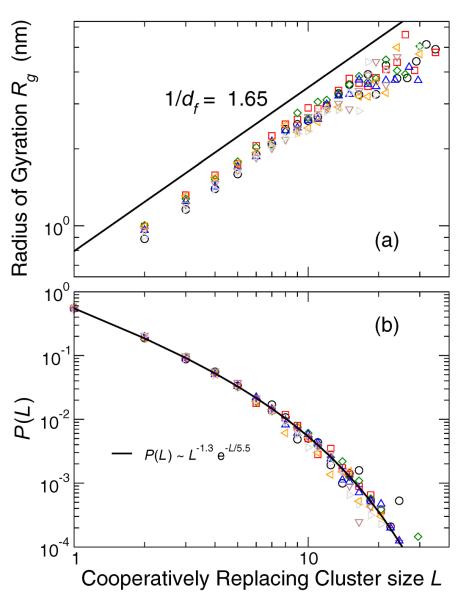
Parallel to our analysis of mobile particle clusters, we next examine the statistical geometry of these CRC sub-groups. Since these clusters are clearly not percolating, we would not expect them to exhibit the same structure as clusters near the percolation threshold. Instead, Fig. 14(a) shows that df ≈ 1.56, a value consistent with `lattice animals' in 2D – i.e., percolation clusters below the percolation threshold; this value may also relate ring polymeric structures, which suggests some non-trivial topology of the CRCs, as we discuss below.
FIG. 14.
Cooperatively replacing cluster radius of gyration Rg as a function of its size L, which determines the fractal dimension df. For 2D percolation clusters below the percolation threshold, df = 1.56 [52]. Clusters are examined for all T in the Lo phase at interval t*. (b) Distribution of cooperatively replacing cluster sizes L. The functional from of P(L) comes from percolation theory [52].
The cluster size distribution of lattice animals P (L) is predicted to follow a form similar to that of the percolation clusters, namely,
| (12) |
where θ = 1 in 2D. Figure 14(b) shows that the replacing particle clusters indeed follow this functional form, but with θ ≈ −1.3. The difference in the value of θ might be due to the fact that our clusters are only quasi-2D, and have some structure out of the plane. In 3D, θ = 3/2 for lattice animals, so our results fall between these 2D and 3D limits. Curiously, we do not see such intermediate behavior for the fractal dimension. An alternate possible explanation might be that these CRC are described by strongly interacting ring polymers, which should have a relatively collapsed structure, similar to percolation clusters under conditions where strong excluded volume interactions cause the collapse to rings. Indeed, CRC having the form of rings were observed in the melting of crystals [34], which we have shown have a similar partitioning of mobile regions. Further work is required to better understand the topological and geometric nature of these clusters.
While the mobile lipid clusters and the CRC have have many features in common with their counterparts in glass-forming liquids, there are notable differences. Qualitatively, the replacing particles in glass-forming systems tend to have an open, co-linear, string-like structure, similar to self-avoiding walks [34, 51] – at least at temperatures where equilibrium simulations are possible. Such string-like objects also appear here (Fig. 8), but the CRC in the membrane typically have a more compact structure. Quantitatively, this results in a fractal dimension consistent with that of branched polymers (lattice animals), rather than linear chain self-avoiding walks. Additionally, the functional form of the CRC mass distribution P(L) differs between the membrane and glass-forming systems. In the case of glassy systems, P(L) is usually described by a pure exponential, characteristic of a linear ideal chain equilibrium polymerization process. In the lipid membrane, P(L) is modified by a power law (eq. 12, the form expected for equilibrium assembly of ring polymers [54]). This is consistent with our suggestion above that differences in the lipid membrane CRC from those of glass-forming liquids arise from the possible formation of ring-like exchange clusters. Presumably, the contrasts between the membranes and glass-forming systems derive from the different nature of thermodynamic transition involved, and the near two-dimensionality of the lipid bilayer, which has the effective of amplifying excluded volume interactions within and between these dynamic polymeric structures.
V. DISCUSSION AND CONCLUSION
Using a simple coarse-grained representation of the lipid molecule intended to capture essential properties of a typical lipid membrane, we have reproduced the qualitative thermodynamic and structural features of the liquid-ordered and disordered phases, and have examined the heterogeneity of dynamics. Our findings show that, within the Lo phase, there exist two distinct mobility classes on a time scale when displacements are non-Brownian (non-Gaussian) in nature. Lipids with low mobility are locally caged by their neighbors, and have a weak enhancement in their mean orientational order. Conversely, mobile lipids have a diminished mean orientational order, and tend to move by a replacement mechanism. Most significantly, there is spontaneous segregation of these groups into clusters, the characteristic size of which grow on cooling away from the Lo-Ld phase transition. Thus, these dynamical clusters do not appear to be associated with the phase transition, and instead share the same features observed in liquids approaching a glass transition, commonly referred to as dynamical heterogeneity. Moreover, the size (≈ 10 nm) and time scales (≈ 10μs) of these mobility domains are consistent with those expected for lipid raft structures [2], raising the possibility that such dynamical clustering plays an important role in the formation of lipid rafts associated with membrane transport.
At the same time, we must point out that highly mobile groups in an immobile background is inverted from the type of heterogeneity expected for lipid rafts, which are believed to consist of relatively low mobility clusters embedded in a more fluid background. Such low mobility clusters are are common in many glass-forming systems [49, 51], and also arise in superheated crystalline materials [34] and at the propagating interfaces of crystallization ands melting fronts of crystalline materials [35]. Thus, the present model is probably insufficient to capture the correct nature of the dynamical clustering and explain raft formation in living membranes; nonetheless, it does provide a useful benchmark for further studies. However, we would be surprised if multiple component membranes studies did not exhibit a complementary existence of high and low mobility clusters. As a parallel example, going from a single-component (crystallizing) Lennard-Jones fluid to a multi-component liquid that forms a glass yields just such a coexistence of dynamical clusters. Accordingly, further computational and experimental studies in this direction will be valuable, and we look forward to simulating multicomponent lipid membranes to test this hypothesis. This rather general clustering phenomenon holds promise for helping to understand the physical processes leading to the formation of raft-like clusters and dynamical aspects of these structures. Investigations along this line could also be fruitful in elucidating collective dynamics of other biological materials.
Recalling our introduction, we offered a range of dynamical properties that must be explained by any picture describing membrane heterogeneity. First, regarding the question of mobile and immobile lipid regions: clearly we can distinguish such regions, and understand their origin via the same framework as glass-forming fluids. Since the membrane proteins are bathed in these lipids, it is natural to also expect such heterogeneity in their motion. Moreover, such a bifurcation of mobility should naturally lead to highly intermittent, but significant jump-like motion for membrane proteins, as the lipids vary between the mobile and immobile states. Second, regarding cooperativity of the molecular motion: we have shown how, within a mobile cluster of lipids, molecules move cooperatively via a collective replacement mechanism. This behavior again mimics that of glass-forming fluids. Our findings did not reveal any significant topography features of the membrane, and we have not examined effects of additives to membrane dynamics. However, since we showed that immobile regions tend to be slightly more ordered than mobile regions, we can expect that additives that enhance lipid order will decrease mobility locally, and vice-versa for additives that reduce lipid order. Recently, we considered such effects in the context of nanoparticle additives to model glass-forming polymer liquids [55, 56], and we expect similar behavior for lipid membranes with protein `nanoparticles'. Thus, our picture of dynamical clustering is able to account for many of the existing observations of membrane heterogeneity.
Our findings for the dynamical heterogeneity of the membrane share obvious similarities to the dynamics of glass-forming liquids, which likewise exhibit dynamical heterogeneity [11, 12, 49], collective particle motion [53], as well as a strong of sensitivity of the fluidity to additives that influence molecular packing [55–61]. Obviously lipid membranes are distinct from glass-forming liquids in some ways, but the strong interparticle interactions and disordered nature of both systems apparently lead to a similar tendency for dynamical clustering and collective motion. Likewise, recent studies on the interfacial dynamics of nanoparticles [32], the melting and freezing of nanoparticles [33], the melting of crystals [34], and the dynamics of grain boundaries [35–37] have revealed similar dynamical features, further supporting the possible universal nature of collective molecular motion in strongly interacting condensed materials.
Given the similarity to the dynamical clustering and string-like cooperativity of glass-forming liquids, it is possible that we may be able to borrow ideas from that area to explain the dynamical behavior of the Lo lipid phase. In particular, the Adam-Gibbs model [62] argues that the mean relaxation can be directly related to the size of cooperative groups. In simulated glass formers, the size of cooperative string motions has been shown to quantitatively predict the T dependence of relaxation [51, 55, 56]. Since we have evaluated the cooperative cluster size in the Lo phase, we have also examined whether the diffusion coefficient D can be quantitatively explained by the size of these groups. While our data is broadly consistent with this possibility, the range of D and L in the Lo phase is too limited to make a conclusive test. Further examination of the parallels between the dynamics of glass formation and lipid dynamics offers a potentially productive line of future research.
ACKNOWLEDGEMENTS
We thank C. Othon and N. Shafique for assistance and comments. JFD acknowledges support from NIH grant 1 R01 EB006398-01A1. BH and FWS acknowledge support from ACS-PRF grant 51983-ND7.
References
- [1].Simons K, Ikonen E. Nature. 1997;387:569–572. doi: 10.1038/42408. [DOI] [PubMed] [Google Scholar]
- [2].Jacobson K, Mouritsen OG, Anderson RGW. Nat Cell Biol. 2007;9:7–14. doi: 10.1038/ncb0107-7. [DOI] [PubMed] [Google Scholar]
- [3].van Meer G. The EMBO Journal. 2005;24:3159–3165. doi: 10.1038/sj.emboj.7600798. [DOI] [PMC free article] [PubMed] [Google Scholar]
- [4].Xie AF, Yamada R, Gewirth AA, Granick S. Physical Review Letters. 2002;89:246103. doi: 10.1103/PhysRevLett.89.246103. [DOI] [PubMed] [Google Scholar]
- [5].Zhang L, Granick S. MRS Bulletin. 2006;31:527–531. [Google Scholar]
- [6].Falck E, Róg T, Karttunen M, Vattulainen I. Journal of the American Chemical Society. 2008;130:44–45. doi: 10.1021/ja7103558. [DOI] [PubMed] [Google Scholar]
- [7].Apajalahti T, Niemela P, Govindan P, M.S. M, Salonen E, Marrink S, Vattulainen I. Faraday Discussions. 2010;144:411–430. doi: 10.1039/b901487j. [DOI] [PubMed] [Google Scholar]
- [8].Javanainen M, Monticelli L, de la Serna JB, Vattulainen I. Langmuir. 2010;26:15436–15444. doi: 10.1021/la102454m. [DOI] [PubMed] [Google Scholar]
- [9].Roark M, Feller SE. The Journal of Physical Chemistry B. 2009;113:13229–13234. doi: 10.1021/jp902186f. [DOI] [PubMed] [Google Scholar]
- [10].Busch S, Smuda C, Pardo LC, Unruh T. Journal of the American Chemical Society. 2010;132:3232–3233. doi: 10.1021/ja907581s. [DOI] [PubMed] [Google Scholar]
- [11].Ediger MD. Annual Review of Physical Chemistry. 2000;51:99–128. doi: 10.1146/annurev.physchem.51.1.99. [DOI] [PubMed] [Google Scholar]
- [12].Richert R. Journal of Physics-Condensed Matter. 2002;14:R703–R738. [Google Scholar]
- [13].Russina M, Mezei F, Lechner R, Longeville S, Urban B. Phys. Rev. Lett. 2000;84:3630–3633. doi: 10.1103/PhysRevLett.84.3630. [DOI] [PubMed] [Google Scholar]
- [14].Schutz GJ, Schindler H, Schmidt T. Biophysical Journal. 1997;73:1073–1080. doi: 10.1016/S0006-3495(97)78139-6. [DOI] [PMC free article] [PubMed] [Google Scholar]
- [15].Ghosh RN, Webb W. Biophysical Journal. 1994;66:1301–1318. doi: 10.1016/S0006-3495(94)80939-7. [DOI] [PMC free article] [PubMed] [Google Scholar]
- [16].Kusumi A, Fujiwara TK, Morone N, Yoshida KJ, Chadda R, Xie M, Kasai RS, Suzuki KG. Seminars in Cell & Developmental Biology. 2012;23:126–144. doi: 10.1016/j.semcdb.2012.01.018. [DOI] [PubMed] [Google Scholar]
- [17].Feder T, Brust-Mascher I, Slattery J, Baird B, Webb W. Biophysical Journal. 1996;70:2767–2773. doi: 10.1016/S0006-3495(96)79846-6. [DOI] [PMC free article] [PubMed] [Google Scholar]
- [18].Janiak M, Small D, Shipley G. Biochemistry. 1976;15:4575–4580. doi: 10.1021/bi00666a005. [DOI] [PubMed] [Google Scholar]
- [19].Antonov V, Petrov V, Molnar A, Predvoditelev D, Ivanov A. Nature. 1980;283:585–586. doi: 10.1038/283585a0. [DOI] [PubMed] [Google Scholar]
- [20].Miller KW, Pang K-YY. Nature. 1976;263:253–255. doi: 10.1038/263253a0. [DOI] [PubMed] [Google Scholar]
- [21].Woodson PB, Traynor ME, Schlapfer WT, Barondes SH. Nature. 1976;260:797–799. doi: 10.1038/260797a0. [DOI] [PubMed] [Google Scholar]
- [22].Curran M, Seeman P. Science. 1977;197:910–911. doi: 10.1126/science.887931. [DOI] [PubMed] [Google Scholar]
- [23].Stephens CL, Shinitzky M. Nature. 1977;270:267–268. doi: 10.1038/270267a0. [DOI] [PubMed] [Google Scholar]
- [24].Cotterill R. Physica Scripta. 1980;22:188. [Google Scholar]
- [25].Koster K, Lei Y, Anderson M, Bryant G. Biophysical Journal. 2000;78:1932–1946. doi: 10.1016/S0006-3495(00)76741-5. [DOI] [PMC free article] [PubMed] [Google Scholar]
- [26].Seeger H, Gudmundsson M, Heimburg T. The Journal of Physical Chemistry. 2007;111:13858–13866. doi: 10.1021/jp075346b. [DOI] [PubMed] [Google Scholar]
- [27].Almeida PF, Vaz WL, Thompson T. Biochemistry. 1992;31:6739–6747. doi: 10.1021/bi00144a013. [DOI] [PubMed] [Google Scholar]
- [28].Almeida PF, Vaz WL, Thompson T. Biophysical Journal. 2005;88:4434–4438. doi: 10.1529/biophysj.105.059766. [DOI] [PMC free article] [PubMed] [Google Scholar]
- [29].Lindblom G, Orädd G. Biochimica et Biophysica Acta (BBA) - Biomembranes. 2009;1788:234–244. doi: 10.1016/j.bbamem.2008.08.016. [DOI] [PubMed] [Google Scholar]
- [30].Cooke IR, Deserno M. The Journal of Chemical Physics. 2005;123:224710. doi: 10.1063/1.2135785. [DOI] [PubMed] [Google Scholar]
- [31].Cooke IR, Kremer K, Deserno M. Phys. Rev. E. 2005;72:011506. doi: 10.1103/PhysRevE.72.011506. [DOI] [PubMed] [Google Scholar]
- [32].Zhang H, Kalvapalle P, Douglas JF. Soft Matter. 2010;6:5944–5955. [Google Scholar]
- [33].Zhang H, Kalvapalle P, Douglas JF. The Journal of Physical Chemistry B. 2011;115:14068–14076. doi: 10.1021/jp203765x. [DOI] [PubMed] [Google Scholar]
- [34].Zhang H, Khalkhali M, Liu Q, Douglas JF. The Journal of Chemical Physics. 2013;138:12A538. doi: 10.1063/1.4769267. [DOI] [PMC free article] [PubMed] [Google Scholar]
- [35].Zhang H, Srolovitz DJ, Douglas JF, Warren JA. Proceedings of the National Academy of Sciences. 2009;106:7735–7740. doi: 10.1073/pnas.0900227106. [DOI] [PMC free article] [PubMed] [Google Scholar]
- [36].Nagamanasa KH, Gokhale S, Ganapathy R, Sood AK. Proceedings of the National Academy of Sciences. 2011;108:11323–11326. doi: 10.1073/pnas.1101858108. [DOI] [PMC free article] [PubMed] [Google Scholar]
- [37].Berardi CR, Barros K, Douglas JF, Losert W. Phys. Rev. E. 2010;81:041301. doi: 10.1103/PhysRevE.81.041301. [DOI] [PubMed] [Google Scholar]
- [38].Grest GS, Kremer K. Phys. Rev. A. 1986;33:3628. doi: 10.1103/physreva.33.3628. [DOI] [PubMed] [Google Scholar]
- [39].Lewis RNAH, Mak N, McElhaney RN. Biochemistry. 1987;26:6118–6126. doi: 10.1021/bi00393a026. [DOI] [PubMed] [Google Scholar]
- [40].Tristram-Nagle S, Nagle JF. Chemistry and Physics of Lipids. 2004;127:3–14. doi: 10.1016/j.chemphyslip.2003.09.002. [DOI] [PMC free article] [PubMed] [Google Scholar]
- [41].Plimpton S. J Comp Phys. 1995;117:1–19. [Google Scholar]
- [42].Frenkel D, Smit B. Understanding Molecular Simulation From Algorithms to Applications. Academic Press; San Diego, CA: 1996. [Google Scholar]
- [43].Duncan SL, Dalal IS, Larson RG. Biochimica et Biophysica Acta (BBA) - Biomembranes. 2011;1808:2450–2465. doi: 10.1016/j.bbamem.2011.06.026. [DOI] [PubMed] [Google Scholar]
- [44].Kosterlitz JM, Thouless DJ. Journal of Physics C: Solid State Physics. 1972;5:L124. [Google Scholar]
- [45].Halperin BI, Nelson DR. Phys. Rev. Lett. 1978;41:121–124. [Google Scholar]
- [46].Bernard EP, Krauth W. Phys. Rev. Lett. 2011;107:155704. doi: 10.1103/PhysRevLett.107.155704. [DOI] [PubMed] [Google Scholar]
- [47].Kob W, Donati C, Plimpton SJ, Poole PH, Glotzer SC. Phys. Rev. Lett. 1997;79:2827–2830. [Google Scholar]
- [48].Zangi R, Rice SA. Phys. Rev. Lett. 2004;92:035502. doi: 10.1103/PhysRevLett.92.035502. [DOI] [PubMed] [Google Scholar]
- [49].Donati C, Glotzer SC, Poole PH, Kob W, Plimpton SJ. Physical Review E. 1999;60:3107–3119. doi: 10.1103/physreve.60.3107. [DOI] [PubMed] [Google Scholar]
- [50].Stanley HE. Introduction to Phase Transitions and Critical Phenomena. Oxford Univ. Press; Oxford: 1971. [Google Scholar]
- [51].Starr FW, Douglas JF, Sastry S. The Journal of Chemical Physics. 2013;138:12A541. doi: 10.1063/1.4790138. [DOI] [PMC free article] [PubMed] [Google Scholar]
- [52].Stauffer D, Aharony A. Introduction To Percolation Theory. Taylor and Francis; London: 1998. [Google Scholar]
- [53].Donati C, Douglas JF, Kob W, Plimpton SJ, Poole PH, Glotzer SC. Physical Review Letters. 1998;80:2338–2341. [Google Scholar]
- [54].Wittmer JP, van der Schoot P, Milchev A, Barrat JL. The Journal of Chemical Physics. 2000;113:6992–7005. [Google Scholar]
- [55].Starr FW, Douglas JF. Physical Review Letters. 2011;106:115702. doi: 10.1103/PhysRevLett.106.115702. [DOI] [PubMed] [Google Scholar]
- [56].Pazmiño BA, Douglas JF, Starr FW. Soft Matter. 2013;9:241–254. doi: 10.1039/C2SM26800K. [DOI] [PMC free article] [PubMed] [Google Scholar]
- [57].Starr FW, Schrøder TB, Glotzer SC. Physical Review E. 2001;64:021802. doi: 10.1103/PhysRevE.64.021802. [DOI] [PubMed] [Google Scholar]
- [58].Starr FW, Schrøder TB, Glotzer SC. Macromolecules. 2002;35:4481–4492. [Google Scholar]
- [59].Riggleman RA, Yoshimoto K, Douglas JF, de Pablo JJ. Physical Review Letters. 2006;97:045502. doi: 10.1103/PhysRevLett.97.045502. [DOI] [PubMed] [Google Scholar]
- [60].Riggleman RA, Douglas JF, de Pablo JJ. Journal of Chemical Physics. 2007;126:234903. doi: 10.1063/1.2742382. [DOI] [PubMed] [Google Scholar]
- [61].Delcambre SP, Riggleman RA, de Pablo JJ, Nealey PF. Soft Matter. 2010;6:2475–2483. [Google Scholar]
- [62].Adam G, Gibbs JH. Journal of Chemical Physics. 1965;43:139–146. doi: 10.1063/1.1697082. [DOI] [PubMed] [Google Scholar]


