

Abstract
Introduction
The aim of the present study was to determine the effect of sitagliptin on microalbuminuria in patients with type 2 diabetes mellitus.
Materials and Methods
A total of 85 patients with type 2 diabetes mellitus (age >20 years, <80 years, hemoglobin A1c [HbA1c] <8.4%) were randomized to patients taking sitagliptin 50 mg or other oral glucose‐lowering agents. The following parameters were evaluated at 0, 3 and 6 months after the treatment: bodyweight, blood pressure, HbA1c, fasting plasma glucose, fasting plasma insulin, low‐density lipoprotein cholesterol, high‐density lipoprotein cholesterol, triglycerides, estimated glomerular filtration rate and urinary albumin excretion. The primary outcome was changes in urinary albumin excretion at 6 months.
Results
Significant and comparable falls in HbA1c and fasting plasma glucose were found in both groups. However, sitagliptin significantly reduced urinary albumin excretion within 6 months, especially in patients with high urinary albumin at baseline. A total of 27 patients with normoalbuminuria showed a reduction in urinary albumin excretion, suggesting that sitagliptin prevents the development of albuminuria. A total of 15 patients with albuminuria showed a reduction in urinary albumin excretion, suggesting the beneficial effect of sitagliptin in the early stage of diabetic nephropathy. There was a significant correlation between improvement of proteinuria and that of diastolic blood pressure.
Conclusions
The results suggested that sitagliptin improved albuminuria, in addition to improving glucose. The mechanism of the reduction of albuminuria by sitagliptin could be a direct effect, as well as an increase in active glucagon‐like peptide‐1, independently affecting blood pressure, bodyweight and glucose metabolism. This trial was registered with the University Hospital Medical Information Network (UMIN no. #000010871).
Keywords: Albuminuria, Dipeptidyl peptidase‐4 inhibitor, Sitagliptin
Introduction
The number of new cases of type 2 diabetes mellitus is increasing throughout the world. Death as a result of ischemic heart disease and the number of new cases of myocardial infarction are approximately two‐ to sixfold greater, and the risk of stroke is approximately two‐ to threefold greater in patients with type 2 diabetes mellitus than the normal population1. Chronic kidney disease is also common in patients with type 2 diabetes mellitus4. In addition, chronic kidney disease contributes to the development of cardiovascular diseases, and thus it increases the risk of death and cardiovascular events5.
Sitagliptin, a dipeptidyl peptidase‐4 (DPP‐4) inhibitor, is a newly developed glucose‐lowering agent currently available in Japan for the treatment of type 2 diabetes mellitus6. DPP‐4 inhibitors slow the degradation and inactivation of the incretins, glucagon‐like peptide 1 (GLP‐1) and glucose‐dependent insulinotropic polypeptide (GIP)7. The main target of action of GLP‐1 is the islet, where the hormone stimulates insulin secretion, promotes β‐cell proliferation and inhibits glucagon secretion8. However, GLP‐1 receptors are also expressed outside the islets, suggesting that GLP‐1 also plays other roles in other organs. The GLP‐1 receptor is also expressed in the proximal tubules and glomerulus of the kidney, and intravenous infusion of GLP‐1 produces natriuretic and diuretic responses9. Its efficacy for the management of diabetic kidney is known in animal models11, but remains unproven in humans.
Sitagliptin slows the degradation and inactivation of GLP‐1, and could therefore be beneficial in diabetic nephropathy. In the present prospective clinical study, we determined the efficacy of sitagliptin on urinary albumin excretion in patients with type 2 diabetes mellitus.
Materials and Methods
Patients
The study participants were patients aged <80 years with type 2 diabetes mellitus whose hemoglobin A1c (HbA1c) was lower than 8.4% (according to the National Glycohemoglobin Standardization Program [NGSP]) despite pioglitazone (15–30 mg/day) and/or sulfonylurea treatment for at least 6 months before the start of the present study at the University of Occupational and Environmental Health Hospital or its affiliated hospitals.
Patients with a history of ketoacidosis, patients with type 1 diabetes, patients with nephropathy (serum creatinine: males >1.5 mg/dL; females >1.3 mg/dL), patients treated with insulin, women who were possibly pregnant, patients with urinary tract infection and patients treated with NSAIDs were excluded from the study. All patients volunteered and signed an informed consent based on the Helsinki Declaration revised in 2000. The present study was approved by the ethics review committee of the University of Occupational and Environmental Health. This trial was registered in the University Hospital Medical Information Network (UMIN no. #000010871).
Study Protocol
The present study was an open‐labeled, prospective, randomized study. The study participants were divided into two groups: the control group (n = 44), who were treated with other oral glucose agents, such as metoformin, glinide or α‐glucosidase inhibitor; and the sitagliptin group (n = 41), who were treated with 50 mg sitagliptin once daily.
Patients of both groups were assessed for the following parameters before the start of the study, and at 3 and 6 months. No changes were made to the type and dose of glucose‐lowering drugs, angiotensin converting enzyme inhibitors or angiotensin receptor blockers during the study period, to avoid possible influences on blood pressure, lipid or glucose metabolism. These drugs had been prescribed for at least 6 months before the study.
The primary outcome of the study was changes in urinary albumin excretion at 6 months after the start of the study. The secondary outcome of the study was changes in estimated glomerular filtration rate (eGFR) at 6 months after the start of the study.
Measurements of Biochemical Variables
Venous blood samples and urinary samples were taken in the morning after an overnight fast. We evaluated at baseline, and after 3 and 6 months of treatment the following parameters: bodyweight, blood pressure, HbA1c, fasting plasma glucose (FPG), fasting plasma insulin (FPI), serum low‐density lipoprotein cholesterol (LDL‐C), high‐density lipoprotein cholesterol (HDL‐C), triglycerides (TG), eGFR and urinary albumin excretion.
Fasting blood glucose was measured by the hexokinase ultraviolet method. HbA1c was measured in the laboratories of each study area, and the results of these measurements were collected. The value of HbA1c (%) was estimated as a NGSP equivalent value (%) derived from the Japan Diabetes Society (JDS) value, and calculated by the formula HbA1c (%) = HbA1c (JDS) (%) + 0.4%14. The homeostasis model assessment of insulin resistance (HOMA‐IR) was calculated as follows: FPG (mg/dL) × FPI (μU/mL) / 405. The homeostatic model assessment of β‐cell function (HOMA‐β) was calculated as follows: FPI (μU/mL) × 360 / (FPG [mg/dL]−63). LDL‐C and HDL‐C concentrations were measured by standard enzymatic methods with the use of a kit from Kyowa Medex (Tokyo, Japan). TG was measured by standard enzymatic method (Sekisui Medical Co., Tokyo, Japan) with a fully automated analyzer (JCA‐BM6050; JEOL, Tokyo, Japan). The eGFR was calculated as 194 × serum creatinine−1.094 × age−0.287 in males, and as 194 × serum creatinine−1.094 × age−0.287 × 0.739 in females. Urine albumin concentrations were measured by immunonephelometry (Communication for Health SRL, Tokyo, Japan).
Statistical Analysis
Data are expressed as mean ± standard deviation. Between‐group comparisons were tested by unpaired Mann–Whitney U‐test or χ2‐test. Baseline and post‐treatment values within each group were compared by Wilcoxon signed rank test or Friedman test. Factors that influence the percentage change of urine albumin were analyzed using Spearman's rank correlation for variables. Multivariate stepwise regression analysis was carried out using percentage change in urine albumin as the dependent variable and several parameters found to be significantly related to percentage change of urinary albumin on univariate analysis. P‐values less than 0.05 were considered to reflect significant difference. All analyses were carried out using the PASW statistics analysis software IBM SPSS v19.0 (SPSS Inc, Chicago, IL, USA).
Results
Patient Demographics
A total of 85 patients were enrolled in the present study, of whom 80 (94%, 44 men and 36 women) with a mean age of 64.2 years at the start of the study were successfully followed over 6 months of treatment with sitagliptin or other oral glucose‐lowering agents. The mean body mass index (BMI) was 25.0 ± 3.9 kg/m2, mean HbA1c was 7.0 ± 0.6% and mean duration of diabetes was 9.4 ± 6.7 years among these 80 patients at study commencement.
Consent was obtained from 85 patients, and 41 and 44 patients were assigned to the sitagliptin and other oral glucose‐lowering agents, respectively. Because three and two patients were excluded from analysis due to dropout, only data of 38 and 42 patients of the sitagliptin and other oral glucose‐lowering agents group are presented, respectively.
Table 1 shows the baseline characteristics of the two groups of patients. There were no significant differences between the two groups with regard to age, male‐to‐female ratio, duration of diabetes, BMI, other parameters of glucose metabolism, lipid profile, eGFR and urinary albumin excretion levels. At baseline, systolic blood pressure (SBP) was higher in the sitagliptin group than in the other oral glucose‐lowering agents group; however, diastolic blood pressure (DBP) was not significantly different.
Table 1. Baseline characteristics.
| Sitagliptine | Other glucose‐lowering agents | P‐value | |
|---|---|---|---|
| Males/females | 26/16 | 18/20 | 0.140 |
| Age (years) | 63.9 ± 12.7 | 64.5 ± 11.0 | 0.954 |
| Duration of DM (years) | 10.0 ± 6.7 | 8.8 ± 6.5 | 0.405 |
| Bodyweight (kg) | 68.0 ± 13.2 | 63.5 ± 13.4 | 0.053 |
| Body mass index (kg/m2) | 25.2 ± 4.2 | 25.3 ± 4.1 | 0.981 |
| SBP (mmHg) | 126.6 ± 11.9 | 120.3 ± 8.8 | 0.024 |
| DBP (mmHg) | 72.2 ± 9.0 | 68.7 ± 7.6 | 0.098 |
| HbA1c (%) | 7.0 ± 0.7 | 6.9 ± 0.7 | 0.688 |
| FPG (mg/dL) | 138.1 ± 21.4 | 131.5 ± 26.0 | 0.103 |
| FPI (μg/mL) | 5.8 ± 3.6 | 6.9 ± 5.7 | 0.769 |
| HOMA‐IR | 2.0 ± 1.4 | 2.4 ± 2.3 | 0.696 |
| HOMA‐β (%) | 29.3 ± 19.4 | 37.0 ± 26.5 | 0.236 |
| LDL‐C (mg/dL) | 109.8 ± 29.4 | 103.7 ± 25.8 | 0.226 |
| HDL‐C (mg/dL) | 68.2 ± 16.2 | 62.8 ± 15.2 | 0.188 |
| TG (mg/dL) | 98.9 ± 41.7 | 112.1 ± 66.9 | 0.596 |
| eGFR (mL/min/1.73 m2) | 77.1 ± 18.9 | 75.5 ± 28.1 | 0.399 |
| Serum creatinine (mg/dL) | 0.8 ± 0.2 | 0.8 ± 0.2 | 0.172 |
| Urine albumin (mg/gCre) | 61.4 ± 154.3 | 61.4 ± 154.3 | 0.762 |
| Log (urine albumin) | 1.3 ± 0.7 | 1.2 ± 0.6 | 0.762 |
| ACE‐inhibitors or ARBs | 18 (42.9) | 14 (36.8) | 0.375 |
| Statins | 20 (47.6) | 21 (55.3) | 0.323 |
| Diabetes therapy | |||
| Pioglitazone (mg/day) | 24.6 ± 7.3 | 23.3 ± 7.6 | 0.414 |
| Sulfonylurea | 16 (38.1) | 15 (39.5) | 0.541 |
Data are mean ± standard deviation, or n (%). Differences between groups were tested by Mann–Whitney U‐test; categorical values were tested by χ2‐test. ACE, angiotensin converting enzyme; ARB, angiotensin‐receptor blockers; DBP, diastolic blood pressure; eGFR, estimated glomerular filtration rate; FPG, fasting plasma glucose; FPI, fasting plasma insulin; HbA1c, hemoglobin A1c; HOMA‐β, homeostasis model assessment β cell function; HOMA‐IR, homeostasis assessment model of insulin resistance; HDL‐C, high‐density lipoprotein cholesterol; LDL‐C, low‐density lipoprotein cholesterol; SBP, systolic blood pressure; TG, triglyceride.
Bodyweight and Blood Pressure
Bodyweight, SBP and DBP were not significantly different at 6 months in both groups. There were no significant differences between the two groups with regard to the percent change in SBP (−1.2 ± 8.3% vs −1.5 ± 8.3% at 3 months, −2.3 ± 11.2% vs −1.0 ± 9.5% at 6 months), and DBP (−2.4 ± 12.6% vs 0.5 ± 11.3% at 3 months, −1.3 ± 12.4% vs 1.1 ± 13.5% at 6 months). Furthermore, there were no significant differences between the two groups in the percentage changes of these parameters from baseline (Table 2).
Table 2. Effects of treatment on bodyweight, blood pressure, glucose metabolism and lipid metabolism, and renal function.
| Sitagliptin | Other glucose‐lowering agents | |||||
|---|---|---|---|---|---|---|
| Baseline | 6 months | % Change | Baseline | 6 months | % Change | |
| Bodyweight (kg) | 68.0 ± 13.2 | 68.7 ± 13.6 | 1.0 ± 3.2 | 63.5 ± 13.4 | 62.5 ± 13.1 | −1.3 ± 6.0 |
| SBP (mmHg) | 126.6 ± 11.9 | 123.4 ± 16.6 | −2.3 ± 11.2 | 120.3 ± 8.8 | 118.5 ± 8.3 | −1.0 ± 9.5 |
| DBP (mmHg) | 72.2 ± 9.0 | 70.7 ± 9.1 | −1.3 ± 12.4 | 68.7 ± 7.6 | 68.9 ± 8.0 | 1.1 ± 13.5 |
| HbA1c (%) | 7.0 ± 0.7 | 6.4 ± 0.7* | −7.4 ± 6.2 | 6.9 ± 0.7 | 6.6 ± 0.7* | −4.5 ± 9.7 |
| FPG (mg/dL) | 138.1 ± 21.4 | 124.4 ± 17.6* | −9.2 ± 10.7 | 131.5 ± 26.0 | 122.9 ± 23.8* | −5.5 ± 14.1 |
| FPI (μU/ml) | 5.8 ± 3.6 | 5.9 ± 4.1 | 9.7 ± 54.2 | 6.9 ± 5.7 | 5.9 ± 4.1 | −0.4 ± 42.0 |
| HOMA‐IR | 2.0 ± 1.4 | 1.8 ± 1.4 | 1.5 ± 59.9 | 2.4 ± 2.3 | 1.9 ± 1.7 | −3.9 ± 44.2 |
| HOMA‐β (%) | 29.3 ± 19.4 | 36.1 ± 24.9* | 34.1 ± 56.5† | 37.0 ± 26.5 | 37.8 ± 27.9 | 14.2 ± 53.6 |
| LDL‐C (mg/dL) | 109.8 ± 29.4 | 102.6 ± 30.2* | −5.7 ± 16.1 | 103.7 ± 25.8 | 102.1 ± 27.0 | −0.2 ± 18.9 |
| HDL‐C (mg/dL) | 68.2 ± 16.2 | 66.4 ± 18.0 | −2.6 ± 14.6 | 62.8 ± 15.2 | 63.4 ± 17.4 | 2.1 ± 19.4 |
| TG (mg/dL) | 98.9 ± 41.7 | 84.4 ± 34.8* | −8.9 ± 36.5 | 112.1 ± 66.9 | 95.8 ± 51.0 | −4.1 ± 39.6 |
| eGFR (mL/min/1.73 m2) | 77.1 ± 18.9 | 73.7 ± 16.0* | −3.7 ± 8.2 | 75.5 ± 28.1 | 70.8 ± 21.3* | −4.8 ± 1.8 |
| Urine albumin (mg/gCre) | 68.9 ± 133.4 | 42.2 ± 126.4* | −36.3 ± 43.3† | 61.4 ± 154.3 | 81.2 ± 194.5 | 112.5 ± 255.0 |
| Log (urine albumin) | 1.3 ± 0.7 | 1.0 ± 0.6* | −23.3 ± 37.9 † | 1.2 ± 0.6 | 1.3 ± 0.6 | 0.8 ± 192.0 |
Values are mean ± standard deviation. *P < 0.05 vs baseline by Wilcoxon matched‐pairs signed‐rank test, †P < 0.05 vs other glucose‐lowering agents group by unpaired Mann–Whitney U‐test. DBP, diastolic blood pressure; eGFR, estimated glomerular filtration rate; FPG, fasting plasma glucose; FPI, fasting plasma insulin; HbA1c, hemoglobin A1c; HOMA‐β, homeostasis model assessment β cell function; HOMA‐IR, homeostasis assessment model of insulin resistance; HDL‐C, high‐density lipoprotein cholesterol; LDL‐C, low‐density lipoprotein cholesterol; SBP, systolic blood pressure; TG, triglyceride.
Glucose Metabolism
The other oral glucose‐lowering agents group showed no change in FPI, HOMA‐IR and HOMA‐β but a significant decrease in HbA1c (from 6.9 ± 0.7% at baseline to 6.6 ± 0.7% at 6 months) and FPG (from 131.5 ± 26.0 mg/dL to 122.9 ± 23.8 mg/dL). In contrast, the sitagliptin group showed no changes in FPI and HOMA‐IR, but significant decreases in HbA1c (from 7.0 ± 0.7% to 6.4 ± 0.7%) and FPG (from 138.1 ± 21.4 mg/dL to 124.4 ± 17.6 mg/dL), and significant increases in HOMA‐β (from 29.3 ± 19.4% to 36.1 ± 24.9%). There were significant differences between the two groups in the percentage changes in HOMA‐β from baseline, but no significant differences between the two groups in the percentage changes in HbA1c and FPG from baseline (Table 2).
Lipid Metabolism
The other oral glucose‐lowering agents group showed no change in LDL‐C, HDL‐C and TG. In contrast, the sitagliptin group showed no changes in HDL‐C, but significant falls in LDL‐C (from 109.8 ± 29.4 mg/dL to 102.6 ± 30.2 mg/dL) and TG (from 98.9 ± 41.7 mg/dL to 84.4 ± 34.8 mg/dL). There were no significant differences between the two groups in the percentage changes in lipid parameters (Table 2).
Renal Function Markers
Another finding was the decrease in eGFR from 75.5 ± 28.1 to 70.8 ± 21.3 mL/min/1.73 m2 in the other oral glucose‐lowering agents group (P = 0.017) and from 77.1 ± 18.9 mL/min/1.73 m2 to 73.7 ± 16.0 mL/min/1.73 m2 in the sitagliptin group (P = 0.006), and there were no significant differences between the two groups (Table 2).
Urinary albumin excretion was the primary end‐point in the present study. Log urinary albumin excretion only showed a significant decrease in the sitagliptin group (P < 0.0001), but not in the oral glucose‐lowering agents group (Figure 1a). Log urinary albumin excretion diminished at 3 months (from 1.3 ± 0.7 to 1.1 ± 0.6) and at 6 months (to 1.0 ± 0.6). There were significant differences between the two groups in the percentage change in log urinary albumin excretion (−22.2 ± 24.8% vs −5.2 ± 185.3% at 3 months, −23.3 ± 37.3% vs 0.8 ± 192.0% at 6 months; P < 0.0001; Figure 1b).
Figure 1.
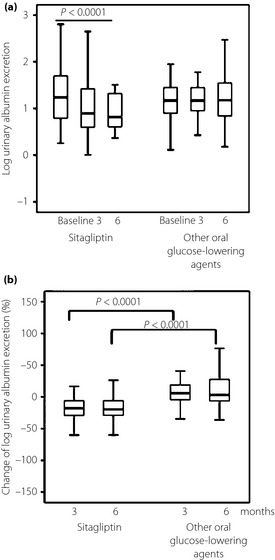
(a) Comparison of the effects of sitagliptin and other oral glucose‐lowering agents administered for 3 and 6 months on log urinary albumin excretion. In these box‐and‐whisker plots, lines within the boxes represent median values; the upper and lower lines of the boxes represent the 25th and 75th percentiles, respectively; and the upper and lower bars outside the boxes represent the 90th and 10th percentiles, respectively. Baseline and post‐treatment values within each group were compared by Friedman test. (b) Mean percentage change in log urinary albumin excretion. Between‐group comparisons were tested by unpaired Mann–Whitney U‐test.
We also divided the sitagliptin group into two subgroups according to the baseline urinary albumin excretion level, using a cut‐off level of 30.0 mg/gCre. A reduction in log urinary albumin excretion was observed at 3 months (from 2.0 ± 0.4 to 1.7 ± 0.5) and at 6 months (to 1.5 ± 0.7) in the ≥30 mg/gCre group (P = 0.001), and, at 3 months (from 0.9 ± 0.3 to 0.7 ± 0.4) and at 6 months (to 0.7 ± 0.3) in the <30 mg/gCre group (P < 0.0001). The decrease in urinary albumin excretion was significant in both groups (Figure 2a). There were no significant differences between the two subgroups in the percentage changes in log urinary albumin excretion (Figure 2b).
Figure 2.
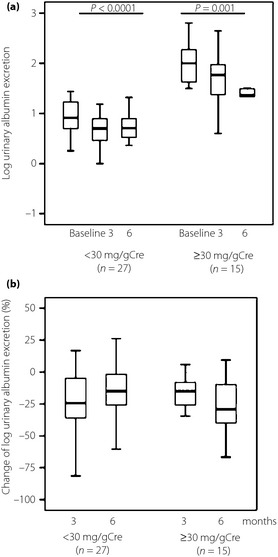
(a) Effects of 6‐month course of sitagliptin on log urinary albumin excretion in subgroups of patients with high (≥30 mg/gCre) and low (<30 mg/gCre) urinary albumin excretion levels. Baseline and post‐treatment values within each group were compared by Friedman test. (b) Mean percentage change in log urinary albumin excretion in subgroups of patients with high (≥30 mg/gCre) and low (<30 mg/gCre) urinary albumin excretion levels. Between‐group comparisons were tested by unpaired Mann–Whitney U‐test. Data are presented as box and whisker plots.
We also examined the relationship between the percentage change in log urinary albumin excretion and percentage change in markers of diabetic control, and various non‐glycemic metabolic variables in the sitagliptin group. Univariate analysis showed that the percentage change in log urinary albumin excretion correlated significantly with the percentage change in DBP (r = 0.327; P = 0.034) and log urinary albumin excretion at baseline (r = −0.371; P = 0.016). In contrast, the percentage change in log urinary albumin excretion did not correlate with glucose and lipid metabolism (Table 3). Finally, multivariate analysis identified the percentage change in log urinary albumin excretion as the only significant determinant of percentage change in DBP (adjusted multiple R2 = 0.104, standardized coefficient β = 0.322, t = 2.153, P = 0.037; Table 4).
Table 3. Correlation coefficients between percentage change in log urinary albumin and percentage change in markers of diabetic control, and various non‐glycemic metabolic variables in sitagliptin.
| r | P‐value | |
|---|---|---|
| % Change in bodyweight | −0.130 | 0.412 |
| % Change in SBP | 0.216 | 0.170 |
| % Change in DBP | 0.327 | 0.034 |
| % Change in HbA1c | −0.101 | 0.523 |
| % Change in FPG | −0.211 | 0.179 |
| % Change in FPI | 0.144 | 0.362 |
| % Change in HOMA‐β | 0.262 | 0.094 |
| % Change in LDL‐C | 0.191 | 0.226 |
| % Change in HDL‐C | −0.021 | 0.897 |
| % Change in TG | 0.099 | 0.534 |
| % Change in eGFR | −0.057 | 0.721 |
| Log(urine albumin) at baseline | −0.371 | 0.016 |
Data are results of Spearman's rank correlation for variables at 6 months. DBP, diastolic blood pressure; eGFR, estimated glomerular filtration rate; FPG, fasting plasma glucose; FPI, fasting plasma insulin; HbA1c, hemoglobin A1c; HOMA‐β, homeostasis model assessment β cell function; HOMA‐IR, homeostasis assessment model of insulin resistance; HDL‐C, high‐density lipoprotein cholesterol; LDL‐C, low‐density lipoprotein cholesterol; SBP, systolic blood pressure; TG, triglyceride.
Table 4. Linear multivariate analyses with percentage change of log urine albumin as the dependent variable.
| Variables | Unstan‐dardized coefficient | Standardized coefficients β | P‐value | 95% CI | |
|---|---|---|---|---|---|
| Intercept | −22.019 | <0.001 | −33.424 | −10.613 | |
| % Change of DBP | 0.986 | 0.322 | 0.037 | 0.061 | 1.911 |
Multivariate stepwise regression analysis with percentage change in log urinary albumin level as the dependent variable and log urinary albumin at baseline, percentage change in bodyweight, blood pressure, lipid metabolism, glucose metabolism and hemoglobin A1c. CI, confidence interval; DBP, diastolic blood pressure.
Discussion
The results of the present study showed that sitagliptin reduces urinary albumin excretion in patients with type 2 diabetes mellitus. Urinary albumin excretion at 6 months was significantly lower compared with that at baseline, without any change in other medications, including statins and angiotensin receptor blockers. Urinary albumin excretion decreased by 26.7 mg/gCre. Other studies reported falls in urinary albumin excretion from 11.6 ± 8.4 to 4.5 ± 5.0 mg/gCre15, and from 76.2 ± 95.6 to 33.0 ± 48.1 mg/gCre after 6‐month treatment with sitagliptin in patients with type 2 diabetes mellitus16; however, these studies were uncontrolled studies.
In the present study, patients with normoalbuminuria showed a reduction in urinary albumin excretion, suggesting that sitagliptin can prevent the development of microalbuminuria. Furthermore, a fall in urinary albumin excretion was also noted in patients with microalbuminuria, suggesting the beneficial effect of sitagliptin in the early stage of diabetic nephropathy. Patients with type 2 diabetes mellitus and micro‐ or macroalbuminuria are at high risk of cardiovascular death (2–12 times higher than that observed in patients with less serious albuminuria)17. Furthermore, in patients with type 2 diabetes mellitus and normoalbuminuria, any degree of measurable urinary albumin bears a significant risk for cardiovascular events. The association between albuminuria and risk is continuous, and there is no threshold level that distinguishes patients at risk from those who are protected from cardiovascular disease19.
Albuminuria can be reduced by amelioration of insulin sensitivity20, weight loss21, and by blood pressure and blood glucose reduction22. The mechanism of sitagliptin‐induced improvement of albuminuria is unknown. In the present study, sitagliptin did not reduce insulin sensitivity level, weight or blood pressure, but reduced blood glucose and HbA1c. One of the mechanisms responsible for the reduction of albuminuria might be the control of blood sugar level. However, there was no correlation between the percentage change in urinary albumin excretion and the percentage change in blood glucose. Attenuating glucose swing by reducing not only fasting blood sugar, but also postprandial blood sugar, might lead to inhibition of vascular inflammation23. We measured fasting glucose level only, but did not measure postprandial glucose. Percentage changes in fasting glucose and HbA1c in other oral glucose‐lowering agents, and in sitagliptin were similar. However, the decrease in urinary albumin excretion was only significant in the sitagliptin group. Therefore, there is no relationship between the reduction in urinary albumin excretion and reduction in glucose metabolism in the sitagliptin group. Another mechanism might be the control of blood pressure. The antihypertensive effect of GLP‐1 is attributed to the GLP‐1 dependent increases in salt and water excretion11. In the present study, multivariate analysis identified percentage change in urinary albumin excretion as the only significant determinant of the percentage change in DBP. However, the percentage change in urinary albumin excretion did not correlate significantly with the percentage change in SBP. SBP and DBP remained unchanged, relative to the baseline.
Another possible mechanism of induction of urinary albumin excretion might be the direct effect of sitagliptin through increased levels of active GLP‐1. High levels of GLP‐1 inhibit advanced glycation end‐product‐induced upregulation of messenger ribonucleic acid levels of vascular cell adhesion molecule 1 (VCAM‐1) in vascular endothelial cells12. In another report, exendin‐4, a GLP‐1 agonist, prevented macrophage infiltration, and reduced the levels of intercellular adhesion molecule‐1 (ICAM‐1) and type IV collagen, and also reduced the level of oxidative stress in renal tissues, and directly attenuated the release of pro‐inflammatory cytokines from macrophages and ICAM‐1 production from glomerular endothelial cells13. Sitagliptin might also have anti‐inflammatory effects in the kidney through the GLP‐1 receptor by increasing the level of active GLP‐1, possibly leading to alleviation of albuminuria. The other anti‐inflammatory property of GLP‐1 involving the cyclic adenosine monophosphate/protein kinase A pathway might also contribute to the reduction in urinary albumin level24. Thus, sitagliptin might increase active GLP‐1 levels, which in turn decrease urinary albumin excretion. In contrast, sitagliptin also decreased the eGFR level. This possible scenario is based on previous findings that GLP‐1 enhances sodium excretion and reduces H+ secretion and glomerular hyperfiltration in obese men25, and that excendin‐4 ameliorates glomerular hyperfiltration and glomerular hypertrophy23.
The present study had several limitations. The number of participants was small, the study duration was short and the study design was not a double‐blind study. We used sitagliptin in the present study, and the effects of other DPP‐4 inhibitors on albuminuria are unknown at present.
In conclusion, the present data provided evidence that DPP‐4 inhibitors can prevent progression of diabetic nephropathy by reducing the severity of proteinuria and albuminuria. Sitagliptin is effective for albuminuria in Japanese patients with type 2 diabetes mellitus.
Acknowledgements
The authors thank Ms N Sakaguchi for excellent technical assistance. This study was supported in part by a Research Grant‐In‐Aid for Scientific Research from the Ministry of Health, Labor and Welfare of Japan; the Ministry of Education, Culture, Sports, Science and Technology of Japan; the Joint Research Association for Japanese Diabetes; and the University of Occupational and Environmental Health, Japan. Dr Tanaka has received consulting fees, speaking fees, and/or honoraria from Mitsubishi‐Tanabe, Eisai, Chugai, Abbott Japan, Astellas, Daiichi‐Sankyo, Abbvie, Janssen, Pfizer, Takeda, Astra‐Zeneca, Eli Lilly Japan, GlaxoSmithKline, Quintiles, MSD and Asahi‐Kasei, and has received research grants from Bristol‐Myers, Mitsubishi‐Tanabe, Abbvie, MSD, Chugai, Astellas and Daiichi‐Sankyo. Dr Okada has received consulting fees and speaking fees from Takeda Industrial Pharma, MSD, and Novartis Pharma.
J Diabetes Invest 2014; 5: 313–319
References
- 1.Haffner SM, Lehto S, Rönnemaa T, et al Mortality from coronary heart disease in subjects with type 2 diabetes and non diabetic subjects with and without prior myocardial infarction. N Engl J Med 1998; 339: 229–234 [DOI] [PubMed] [Google Scholar]
- 2.Stamler J, Vaccaro O, Neaton JD, et al Diabetes, other risk factors, and 12‐yr cardiovascular mortality for men screened in the Multiple Risk Factor Intervention Trial. Diabetes Care 1993; 16: 434–444 [DOI] [PubMed] [Google Scholar]
- 3.Abbott RD, Donahue RP, MacMahon SW, et al Diabetes and the risk of stroke. The Honolulu Heart Program. JAMA 1987; 257: 949–952 [PubMed] [Google Scholar]
- 4.Kramer H, Molitch ME. Screening for kidney disease in adults with diabetes. Diabetes Care 2005; 28: 1813–1816 [DOI] [PubMed] [Google Scholar]
- 5.Go AS, Chertow GM, Fan D, et al Chronic kidney disease and the risks of death, cardiovascular events, and hospitalization. N Engl J Med 2004; 351: 1296–1305 [DOI] [PubMed] [Google Scholar]
- 6.Herman GA, Stein PP, Thornberry NA, et al Dipeptidyl peptidase‐4 inhibitors for the treatment of type 2 diabetes: focus on sitagliptin. Clin Pharmacol Ther 2007; 81: 761–767 [DOI] [PubMed] [Google Scholar]
- 7.Tahrani AA, Bailey CJ, Del Prato S, et al Management of type 2 diabetes: new and future developments in treatment. Lancet 2011; 378: 182–197 [DOI] [PubMed] [Google Scholar]
- 8.Drucker DJ. Dipeptidyl peptidase‐4 inhibition and the treatment of type 2 diabetes: preclinical biology and mechanisms of action. Diabetes Care 2007; 30: 1335–1343 [DOI] [PubMed] [Google Scholar]
- 9.Baggio LL, Drucker DJ. Biology of incretins: GLP‐1 and GIP. Gastroenterology 2007; 132: 2131–2157 [DOI] [PubMed] [Google Scholar]
- 10.Bullock BP, Heller RS, Habener JF. Tissue distribution of messenger ribonucleic acid encoding the rat glucagon‐like peptide‐1 receptor. Endocrinology 1996; 137: 2968–2978 [DOI] [PubMed] [Google Scholar]
- 11.Yu M, Moreno C, Hoagland KM, et al Antihypertensive effect of glucagon‐like peptide 1 in Dahl salt‐sensitive rats. J Hypertens 2003; 21: 1125–1135 [DOI] [PubMed] [Google Scholar]
- 12.Ishibashi Y, Matsui T, Takeuchi M, et al Glucagon‐like peptide‐1 (GLP‐1) inhibits advanced glycation end product (AGE)‐induced up‐regulation of VCAM‐1 mRNA levels in endothelial cells by suppressing AGE receptor (RAGE) expression. Biochem Biophys Res Commun 2010; 391: 1405–1408 [DOI] [PubMed] [Google Scholar]
- 13.Kodera R, Shikata K, Kataoka HU, et al Glucagon‐like peptide‐1 receptor agonist ameliorates renal injury through its anti‐inflammatory action without lowering blood glucose level in a rat model of type 1 diabetes. Diabetologia 2011; 54: 965–978 [DOI] [PubMed] [Google Scholar]
- 14.Seino Y, Nanjo K, Tajima N, et al Report of the Committee on the Classification and Diagnostic Criteria of Diabetes Mellitus. J Diabetes Invest 2010; 1: 212–228 [DOI] [PMC free article] [PubMed] [Google Scholar]
- 15.Hattori S. Sitagliptin reduces albuminuria in patients with type 2 diabetes. Endocr J 2011; 58: 69–73 [DOI] [PubMed] [Google Scholar]
- 16.Harashima SI, Ogura M, Tanaka D, et al Sitagliptin add‐on to low dosage sulphonylureas: efficacy and safety of combination therapy on glycaemic control and insulin secretion capacity in type 2 diabetes. Int J Clin Pract 2012; 66: 465–476 [DOI] [PubMed] [Google Scholar]
- 17.Adler AI, Stevens RJ, Manley SE, et al Development and progression of nephropathy in type 2 diabetes: the United Kingdom Prospective Diabetes Study (UKPDS 64). Kidney Int 2003; 63: 225–232 [DOI] [PubMed] [Google Scholar]
- 18.Dinneen SF, Gerstein HC. The association of microalbuminuria and mortality in non‐insulin‐dependent diabetes mellitus. A systematic overview of the literature. Arch Intern Med 1997; 157: 1413–1418 [PubMed] [Google Scholar]
- 19.Ruggenenti P, Porrini E, Motterlini N, et al Measurable urinary albumin predicts cardiovascular risk among normoalbuminuric patients with type 2 diabetes. J Am Soc Nephrol 2012; 23: 1717–1724 [DOI] [PMC free article] [PubMed] [Google Scholar]
- 20.Pistrosch F, Herbrig K, Kindel B, et al Rosiglitazone improves glomerular hyperfiltration, renal endothelial dysfunction, and microalbuminuria of incipient diabetic nephropathy in patients. Diabetes 2005; 54: 2206–2211 [DOI] [PubMed] [Google Scholar]
- 21.Chagnac A, Weinstein T, Herman M, et al The effects of weight loss on renal function in patients with severe obesity. J Am Soc Nephrol 2003; 14: 1480–1486 [DOI] [PubMed] [Google Scholar]
- 22.UK Prospective Diabetes Study Group . Tight blood pressure control and risk of macrovascular and microvascular complications in type 2 diabetes: UKPDS 38. Lancet 1998; 352: 854–865 [PMC free article] [PubMed] [Google Scholar]
- 23.Horváth EM, Benko R, Kiss L, et al Rapid ‘glycaemic swings’ induce nitrosative stress, activate poly (ADP‐ribose) polymerase and impair endothelial function in a rat model of diabetes mellitus. Diabetologia 2009; 52: 952–961 [DOI] [PubMed] [Google Scholar]
- 24.Dozier KC, Cureton EL, Kwan RO, et al Glucagon‐like peptide‐1 protects mesenteric endothelium from injury during inflammation. Peptides 2009; 30: 1735–1741 [DOI] [PMC free article] [PubMed] [Google Scholar]
- 25.Gutzwiller JP, Tschopp S, Bock A, et al Glucagon‐like peptide 1 induces natriuresis in healthy subjects and in insulin‐resistant obese men. J Clin Endocrinol Metab 2004; 89: 3055–3061 [DOI] [PubMed] [Google Scholar]