

Abstract
Aims/Introduction
It is thought that adipocytokines contribute to the increased risk of vascular complications in type 2 diabetes. However, there is still limited information on the relationship between microangiopathies and adipocytokines, such as adiponectin, leptin and tumor necrosis factor‐α (TNF‐α) in patients with type 2 diabetes.
Materials and Methods
The present study examined the relationship between fasting serum adiponectin, leptin, and TNF‐α levels and microangiopathies in Korean type 2 diabetes. A total of 153 patients were recruited and evaluated for diabetic nephropathy, retinopathy and neuropathy. Serum adiponectin, TNF‐α and leptin levels were measured.
Results
Serum adiponectin levels were significantly lower in patients with nephropathy than in those without nephropathy (P = 0.017), and were significantly higher in patients with retinopathy or neuropathy than those without retinopathy or neuropathy (P = 0.01 and P = 0.002, respectively). The mean levels of leptin were significantly higher in patients with neuropathy than in those without neuropathy (P = 0.002). The mean levels of TNF‐α were not significantly different according to any of the three microangiopathies. Multivariate logistic regression analysis showed that the odds ratio for the presence of neuropathy in the highest tertile of adiponectin was 4.3 (95% confidence interval 1.59–11.62), as compared with the patients in the lowest tertile of adiponectin level.
Conclusions
Levels of adipocytokines were significantly different according to the presence of each microangiopathy. In particular, higher serum adiponectin was independently associated with increased odds for the presence of neuropathy. Future prospective studies with larger numbers of patients are required to establish a direct relationship between plasma adipocytokine concentrations and the development or severity of diabetic microangiopathies.
Keywords: Adipocytokines, Diabetic microangiopathies
Introduction
Adipose tissue secretes adipocytokines, which influence glucose and lipid metabolism, inflammatory processes, and other bioactivities1. It is thought that adipocytokines contribute to the increased risk of vascular complications in patients with type 2 diabetes by modulating vascular function and affecting inflammatory processes2.
Adiponectin, the most abundant adipocytokine, was found to be decreased in conditions such as obesity, insulin resistance, type 2 diabetes, macrovascular complications and coronary artery disease (CAD)3. In addition, adiponectin, by improving insulin sensitivity and hyperglycemia, might affect the development or progression of diabetic microvascular complications. However, the relationship between microvascular complications and serum adiponectin level is controversial4.
Leptin has been suggested as a sensitive marker for the diagnosis of obesity‐related disease9. Also, leptin exerts atherogenic and angiogenetic effects, and is associated with the development of type 2 diabetes and cardiovascular disease (CVD)10. However, only a few studies have addressed the relationship between plasma leptin levels and diabetic microvascular complications, and showed contradictory results4.
Tumor necrosis factor‐α (TNF‐α) is a pro‐inflammatory cytokine with a wide range of biological effects including immuno‐inflammatory activation and stimulating expression of vascular adhesion molecules, which promotes the atherogenic process14. Diabetes includes an inflammatory component thought to be related to diabetic complications, and studies support the hypothesis that dysregulation of the TNF superfamily might be involved in the development of diabetic vascular complications4.
We previously published data showing the associations between adipocytokine levels and cardiac autonomic neuropathy19. To further evaluate the possible role of adipocytokines in other microangiopathies, we also examined associations between serum adiponectin, leptin and TNF‐α and diabetic microangiopathies in Korean patients with type 2 diabetes in the present study.
Materials and Methods
Patients
We recruited 170 diabetic patients who underwent evaluation of diabetic complications at the diabetes clinic of Soonchunhyang University Bucheon Hospital, Bucheon, Korea, from January 2009 to May 2011 as described previously19. Among the patients, those with type 1 diabetes and for whom fasting serum samples and evaluation of microangiopathies were not available were excluded. Finally, 153 type 2 diabetes patients (100 men and 53 women) remained for current analyses. The study was approved by the institutional review board of our hospital, and was carried out according to the recommendations of the Declaration of Helsinki. We collected demographic data, biochemical data, clinical and treatment history using medical records.
Measurement of Serum Adipocytokines
Blood samples were taken after overnight fasting. The serum was separated and stored –80°C until analyzed. Serum adiponectin and TNF‐α levels were measured using a commercially available enzyme‐linked immunosorbent assay (ELISA; R&D Systems, Minneapolis, MN, USA). Serum leptin levels were measured using a commercial radioimmunoassay (Millipore, Billerica, MA, USA).
Glycated hemoglobin was measured using an ion‐exchange high performance liquid chromatography (Bio‐Rad, Hercules, CA, USA). The methodology was aligned with the Diabetes Control and Complications Trial and National Glycohemoglobin Standardization Program standards20.
Diabetic Microvascular Complications
Diabetic nephropathy was defined using albuminuria, which was measured by radioimmunoassay (Immunotech, Prague, Czech Republic). Albumin excretion rate (AER) <20 μg/min or urine albumin <30 mg/g creatinine was categorized as normoalbuminuria, AER in the range of 20–200 μg/min or urine albumin 30–300 mg/g creatinine as microalbuminuria, and AER >200 μg/min or urine albumin ≥300 mg/g creatinine as overt proteinuria. Patients were considered to have nephropathy if they showed microalbuminuria or overt proteinuria. Estimated glomerular filtration rate (eGFR) was calculated by the Modification of Diet in Renal Disease Study equation.
Diabetic retinopathy (DR) was defined based on findings of dilated pupils by fundoscopy carried out by an ophthalmologist. DR was classified as normal, non‐proliferative (NPDR) and proliferative retinopathy (PDR). NPDR was diagnosed on the basis of one or more of the following findings: hard or soft exudates, intraretinal microvascular abnormalities, hemorrhage, microaneurysm and venous beading in at least one eye. The diagnosis of PDR required the presence of one or more of the following abnormalities: new vessels and fibrous tissue on disc, fibrous proliferations, and preretinal or vitreous hemorrhages, or both, in at least one eye8.
Diabetic peripheral neuropathy was diagnosed with recommendation by the Expert Committee of Korean Diabetes Neuropathy Study Group, as: the presence of typical symptoms using the Michigan Neuropathy Screening Instrument (MNSI) and compatible findings on neurological screening examinations or electrophysiological studies22. The MNSI consists of 15 self‐administered “yes” or “no” questions on foot sensation including pain, numbness and temperature sensitivity24. A score greater than 2 points out of a maximum of 13 points are considered positive. A 10‐g monofilament test, vibration test with 128‐Hz tuning fork, and ankle reflex examination were used as neurological screening examinations. Although electrophysiological studies are not essential, current perception threshold (CPT) test was carried out in all patients using a Neurometer CPT/C (Neurotron, Inc., Baltimore, MD, USA)25.
An automated device (VP‐1000; Colin, Komaki, Japan) was used to measure arterial pulse wave velocity (PWV) and ankle‐brachial index (ABI). The insulin resistance status was evaluated by the homeostasis model assessment of insulin resistance (HOMA‐IR) index calculated by the formula: (fasting insulin [uIU/mL] × fasting blood glucose [mmol/L])/22.5. Serum C‐peptide levels were measured by radioimmunoassay (Immunotech, Prague, Czech Republic).
Statistical Analysis
Statistical analyses were carried out using spss 14.0 (SPSS, Chicago, IL, USA). Descriptive data are shown as means ± standard deviation or number of participants (percentages). The categorical variables of the groups were compared by χ2‐test. The significance of the mean differences between patients with microangiopathies and those without microangiopathies were evaluated by Student's t‐test or the non‐parametric Mann–Whitney U‐test. Correlations between serum levels of adipocytokines and other clinical parameters were analyzed by Spearman's rank correlation analysis. The association between adipocytokines or other variables and the presence of microangiopathies was analyzed by multivariate logistic regression analysis.
Results
Clinical Characteristics of the Participants
The general characteristics of the study participants are presented in Table 1. The mean age and duration of diabetes were 52.5 ± 10 years and 6.2 ± 5.2 years, respectively. The body mass index (BMI) was 24.7 ± 3.7 kg/m2. The prevalence of nephropathy, retinopathy and neuropathy was 14.8%, 14.0% and 57.6%, respectively.
Table 1. Clinical characteristics of the participants.
| Age (years) | 52.5 ± 10.0 |
| Men/women, n (%) | 100/53 (65.4/34.6) |
| Smoking, n (%) | 48 (31.4) |
| Body mass index (kg/m2) | 24.7 ± 3.7 |
| Duration of DM (year) | 6.2 ± 5.2 |
| Hypertension, n (%) | 53 (35.1) |
| Systolic BP (mm Hg) | 127.1 ± 14.5 |
| Diastolic BP (mm Hg) | 78.2 ± 8.5 |
| HbA1c (%) | 7.9 ± 1.9 |
| Creatinine (mg/dL) | 1.0 ± 0.4 |
| eGFR (mL/min/1.73 m2) | 79.9 ± 16.2 |
| Total cholesterol (mg/dL) | 167.9 ± 31.6 |
| LDL‐cholesterol (mg/dL) | 94.8 ± 27.8 |
| HDL‐cholesterol (mg/dL) | 47.4 ± 14.9 |
| Triglycerides (mg/dL) | 160.4 ± 118.5 |
| Apolipoprotein B (mg/dL) | 78.6 ± 21.9 |
| hsCRP (ng/dL) | 0.3 ± 1.2 |
| C‐peptide (fasting) (ng/ml) | 2.4 ± 1.4 |
| Insulin (fasting) (uIU/ml) | 9.7 ± 8.6 |
| HOMA‐IR | 3.85 ± 3.97 |
| ABI | 1.11 ± 0.11 |
| PWV (cm/s) | 1517 ± 249 |
| Treatment modality | |
| Diet and exercise, n (%) | 35 (23) |
| OHA, n (%) | 103 (67.8) |
| OHA + insulin, n (%) | 7 (4.6) |
| Insulin, n (%) | 7 (4.6) |
| Nephropathy, n (%) | 20 (14.8) |
| Retinopathy, n (%) | 18 (14) |
| Neuropathy, n (%) | 87 (57.6) |
Data are shown as mean ± standard deviation, or as n (%). ABI, ankle‐brachial index; BP, blood pressure; DM, diabetes mellitus; eGFR, estimated glomerular filtration rate; HbA1c, glycated hemoglobin; HDL, high density lipoprotein; HOMA‐IR, homeostasis model of assessment for insulin resistance; hsCRP, high‐sensitivity C‐reactive protein; LDL, low density lipoprotein; OHA, oral hypoglycemic agent; PWV, pulse wave velocity.
Comparison of Mean Adipocytokine Levels According to the Presence of Diabetic Microangiopathies
The mean levels of adiponectin were significantly lower in patients with nephropathy than in patients without nephropathy (P = 0.017). In contrast, the mean levels of adiponectin were significantly higher in patients with retinopathy or neuropathy (P = 0.01 and P = 0.002, respectively). The mean levels of leptin were significantly higher in patients with neuropathy than in patients without neuropathy (P = 0.002). However, the mean levels of leptin were not different according to the presence of nephropathy or retinopathy. The mean levels of TNF‐α were not significantly different according to any of the three microvascular complications (Figure 1).
Figure 1.
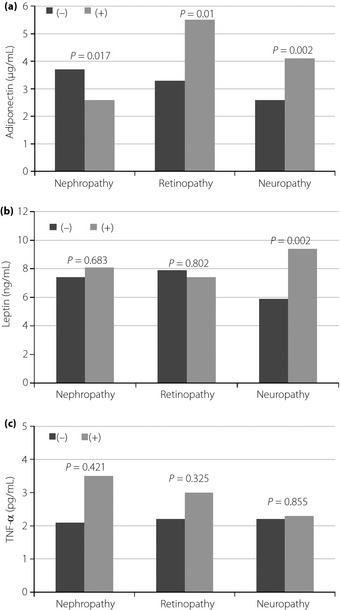
The comparisons of mean levels of adipocytokines according to the presence or absence of microvascular complications. (a) Adiponectin. (b) Leptin. (c) Tumor necrosis factor‐α (TNF‐α).
A total of 13 patients had two or more microangiopathies together with nephropathy. The levels of adiponectin were not significantly different according to the number of microangiopathies (≥2 vs <2 microangiopathies) including nephropathy (P = 0.710; data not shown). Also, when we compared the mean levels of adiponectin between groups with two or more microangiopathies, including nephropathy, and those without any microangiopathy, serum adiponectin levels did not show a significant difference (P = 0.430).
Bivariate Correlation Between Adiponectin, Leptin, TNF‐α and Clinical Parameters
Bivariate correlation analyses between leptin, TNF‐α, adiponectin and various clinical parameters are shown in Table 2. Serum adiponectin levels showed significant negative correlations with BMI, triglycerides (TG), creatinine, high sensitivity C‐reactive protein (hsCRP), apolipoprotein B (apoB), serum fasting insulin, fasting C‐peptide and HOMA‐IR. Also, serum adiponectin level showed marginally significant positive correlations with high‐density lipoprotein cholesterol (HDL‐C). After adjustment for age and sex, adiponectin level showed a significant positive correlation with HDL‐C (r = 0.402, P = 0.025), and a negative correlation with apoB and HOMA‐IR (r = –0.424, P = 0.017 and, r = –0.185, P = 0.05, respectively).
Table 2. Correlation of serum adiponectin, leptin and tumor necrosis factor‐α with clinical variables.
| Adiponectin | Leptin | TNF‐α | ||||
|---|---|---|---|---|---|---|
| r | P | R | P | r | P | |
| Age | 0.151 | 0.063 | 0.135 | 0.097 | 0.246 | 0.002 |
| Duration of DM | 0.132 | 0.103 | −0.017 | 0.832 | 0.076 | 0.348 |
| Body mass index | −0.161 | 0.047 | 0.498 | <0.001 | 0.085 | 0.296 |
| Systolic BP | −0.072 | 0.375 | 0.232 | 0.004 | 0.059 | 0.466 |
| Diastolic BP | −0.099 | 0.223 | 0.048 | 0.560 | −0.054 | 0.509 |
| HbA1c | −0.009 | 0.916 | −0.064 | 0.436 | 0.065 | 0.426 |
| eGFR | −0.032 | 0.703 | −0.161 | 0.052 | −0.197 | 0.017 |
| Creatinine | −0.250 | 0.003 | −0.265 | 0.001 | 0.158 | 0.06 |
| Total cholesterol | −0.108 | 0.196 | 0.104 | 0.213 | 0.022 | 0.795 |
| LDL‐cholesterol | −0.049 | 0.550 | 0.001 | 0.989 | −0.002 | 0.980 |
| HDL‐cholesterol | 0.162 | 0.054 | −0.046 | 0.587 | −0.014 | 0.872 |
| Triglycerides | −0.363 | <0.001 | 0.177 | 0.03 | 0.008 | 0.923 |
| hsCRP | −0.341 | <0.001 | 0.250 | 0.006 | 0.308 | 0.001 |
| Apolipoprotein B | −0.441 | <0.001 | 0.094 | 0.347 | 0.059 | 0.556 |
| C‐peptide (fasting) | −0.219 | 0.007 | 0.438 | <0.001 | 0.001 | 0.995 |
| Insulin (fasting) | −0.182 | 0.05 | 0.471 | <0.001 | 0.047 | 0.615 |
| Mean ABI | 0.132 | 0.111 | 0.068 | 0.414 | −0.08 | 0.338 |
| Mean PWV | −0.006 | 0.943 | 0.204 | 0.013 | 0.121 | 0.147 |
| HOMA‐IR | −0.238 | 0.011 | 0.347 | <0.001 | 0.015 | 0.872 |
| Adiponectin | – | – | −0.009 | 0.907 | −0.115 | 0.158 |
| Leptin | −0.009 | 0.907 | – | – | 0.059 | 0.469 |
| TNF‐α | −0.115 | 0.158 | 0.059 | 0.471 | – | – |
Spearman's correlation analysis was used for the statistical analyses. ABI, ankle‐brachial index; BP, blood pressure; DM, diabetes mellitus; eGFR, estimated glomerular filtration rate; HbA1c, glycated hemoglobin; HDL, high density lipoprotein; HOMA‐IR, homeostasis model of assessment for insulin resistance; hsCRP, high‐sensitivity C‐reactive protein; LDL, low density lipoprotein; OHA, oral hypoglycemic agent; PWV, pulse wave velocity.
Regarding serum leptin levels, a significant positive correlation was found with BMI, systolic blood pressure (SBP), TG, hsCRP, fasting insulin, serum fasting C‐peptide, mean PWV and HOMA‐IR. Serum leptin levels showed a significant negative correlation with creatinine, and a borderline correlation with eGFR. Furthermore, the positive correlation between serum leptin with TG and HOMA‐IR remained significant after adjustment for age and sex (r = 0.595, P < 0.001 and r = 0.321, P = 0.001, respectively).
Serum TNF‐α levels showed a negative correlation with eGFR, and a positive correlation with age and hsCRP. After adjustment for age and sex, serum TNF‐α level consistently showed a positive correlation with hsCRP (r = 0.454, P = 0.01).
Multiple Logistic Regression Analysis for the Relationship of Adipocytokines with the Presence of Microangiopathies
To examine the relationship of serum adipocytokines with the presence of microangiopathies, a multiple logistic regression analysis was carried out (Table 3).
Table 3. Multiple logistic regression analysis with the presence or absence of neuropathy as the dependent variable.
| Independent variable | Odds ratio (95% CI) |
|---|---|
| Age | 0.98 (0.94–1.02) |
| Sex | 0.80 (0.29–2.18) |
| Adiponectin (μg/mL)a | |
| First tertile (1.12, 1.11, [0.35‐1.67]) | 1 |
| Second tertile (2.5, 2.41, [1.68~3.49]) | 1.97 (0.81–4.80) |
| Third tertile (6.71, 5.24, [3.56~18.11]) | 4.30 (1.59–11.62) |
| Leptin (ng/mL)a | |
| First tertile (2.21, 2.36, [0.43~3.25]) | 1 |
| Second tertile (5.2, 5.15, [3.27~7.93]) | 2.01 (0.81–4.99) |
| Third tertile (16.1, 14.92, [7.99~49.15]) | 3.17 (1.06–9.42) |
| eGFR | 0.97 (0.94–0.99) |
Levels of mean, median, range of adiponectin and leptin for each tertile are shown in parenthesis. CI, confidence interval; eGFR, estimated glomerular filtration rate.
In multivariate analysis, serum adiponectin and leptin were independently associated with the presence of neuropathy. The odds ratio (OR) for the presence of neuropathy in the highest tertile of the adiponectin levels was 4.3 (95% confidence interval [CI] 1.59–11.62), as compared with the patients in the lowest tertile. The OR for the presence of neuropathy in the highest tertile of the leptin level was 3.2 [95% CI 1.06–9.42], as compared with the lowest tertile. Increased eGFR was associated with decreased odds for the presence of neuropathy (OR 0.97, 95% CI 0.94–0.99; Table 3).
In multivariate relationships between adiponectin, microalbuminuria, age, eGFR and retinopathy, only microalbuminuria remained significantly associated with retinopathy. Regarding the odds ratios for the presence of nephropathy, among SBP, PWV and adiponectin, none of the variables were independently related to the presence of nephropathy (data not shown).
Discussion
In the present study, serum adiponectin levels were significantly higher in type 2 diabetes patients with neuropathy and retinopathy, but significantly lower in those with nephropathy. In addition, multiple logistic regression analysis showed that higher serum adiponectin levels were independently associated with increased odds for the presence of neuropathy.
Although a few studies have been carried out to evaluate the relationship between diabetic neuropathy and serum adiponectin, the results were controversial. Matsuda et al.4 analyzed the relationship between plasma adiponectin, leptin and TFN‐α, and neuropathy using nerve conduction velocity in 105 patients of type 2 diabetes. They reported that, among adipocytokines, only TNF‐α was significantly related to corrected sensory conduction velocity. In a study by Kato et al.7, serum adiponectin was not correlated with neuropathy. The reasons for the discrepancy of results between the present and previous studies are not clear. One of the possible explanations is that the diagnosis of neuropathy was based on different criteria. In the aforementioned studies, the diagnosis of neuropathy was based on only one detection method, such as nerve conduction velocity by electric stimulation or physical examination. In contrast, in the present study, assessment of peripheral neuropathy was based on typical symptoms and current perception threshold or nerve conduction study.
The results of previous studies about the relationship between adiponectin and diabetic retinopathy are also contradictory. Consistent with the results of the present study, Kato et al.7 found that adiponectin level is increased in the advanced stages of diabetic retinopathy of type 2 diabetes. Also, in patients with type 1 diabetes, adiponectin level is correlated positively with the progression of diabetic retinopathy26. In contrast, Yilmaz et al.8 reported that plasma adiponectin concentrations are lower in patients with diabetic retinopathy than those without it. Compared with other studies, the prevalence of diabetic retinopathy in the present study population was lower, and the severity of retinopathy was milder. These differences could have contributed to the discrepancy of the results. Previous studies have shown that diabetic retinopathy has features of chronic and subclinical inflammation27. Therefore, in response to inflammation promoting diabetic retinopathy, serum adiponectin might be increased as a compensatory process. Conversely, another possible explanation is that adiponectin could worsen diabetic retinopathy, although this appears to be contrary to the general concept of adiponectin as a beneficial hormone. It remains to be determined whether serum adiponectin level is causally associated with the development and progression of retinopathy or increased as a compensatory response.
In addition, serum adiponectin levels were lower in patients with nephropathy than in those without nephropathy in the present study. Several studies have found that adiponectin was significantly increased in the presence of advanced diabetic nephropathy5. Kato et al.7 reported that serum adiponectin levels are significantly higher in subjects with macroalbuminuria or chronic renal failure than those with normoalbuminuria and microalbuminuria. Saito et al.28 reported that serum adiponectin levels were significantly higher in those with stage IV (elevated serum creatinine) and stage V (under dialysis treatment) of nephropathy, but were lower in diabetic patients with normal serum creatinine compared with control subjects. Although the reason why the serum adiponectin level is higher in chronic kidney disease (CKD) patients than in subjects without CKD remains unclear, cystatin C could be one of the suggested causes. Hosokawa et al.29 found that serum adiponectin level was correlated with serum cystatin C level in patients with type 2 diabetes. They suggested that the elevation of serum adiponectin in advanced CKD might not only be as a result of the decrease of eGFR, but also partly attributed to the binding of cystatin C with adiponectin, which would delay the clearance of adiponectin from the blood.
In contrast, a significant inverse association was reported between adiponectin and renal dysfunction, consistent with the present study30. Furthermore, whether lesser degrees of renal impairment influence adiponectin concentrations is unclear. In the present study, the mean eGFR and serum creatinine between patients with nephropathy and those without nephropathy (79.7 vs 82.5 mL/min per 1.73 m2, P = 0.641; 1.0 vs 1.2 mg/dL, P = 0.441, respectively) were not significantly different, indicating mild renal impairment. Therefore, the present data suggest that serum adiponectin level might be negatively associated with renal dysfunction in mild nephropathy.
Also, in the present study, the multiple links of adiponectin to several metabolic risk factors, such as triglycerides, HDL‐C, apoB, hsCRP, insulin and HOMA‐IR, are all consistent with the hypothesis that adiponectin is a protective factor31.
It is well‐known that thiazolidinediones (TZDs) increase plasma adiponectin levels32. Also, hypolipidemic drugs, such as fibrates and niacin, can raise adiponectin levels33. The proportions of patients using TZDs were not significantly different between groups with or without neuropathy (16% vs 21%, P = 0.244) and retinopathy (27% vs 20%, P = 0.312). Therefore, it is less likely that the adiponectin levels in groups with or without neuropathy and retinopathy were affected by TZDs differently. Regarding nephropathy, the proportion of patients using TZDs was relatively smaller in patients with nephropathy compared with those without nephropathy, although statistically insignificant (5% vs 20%, P = 0.075). Therefore, we could not exclude the possibility that the difference in adiponectin levels between patients with and without nephropathy was influenced by the effects of TZDs. In case of other hypolipidemic agents, just 4.5% of the patients were treated with fibrate, and no patient was treated with niacin. Therefore, we think that the effects of these drugs were negligible.
We observed that the mean levels of leptin were not different between patients with and without diabetic nephropathy or retinopathy. In contrast, the mean levels of leptin were significantly higher in patients with neuropathy than those without neuropathy. Results of the relationship between serum leptin and diabetic microangiopathies are inconsistent. Sari et al.11 showed that leptin levels were not different between patients with and without diabetic nephropathy, retinopathy and neuropathy. In addition, Asakawa et al.34 reported that the leptin level was not associated with microangiopathies in Japanese patients of type 2 diabetes. In contrast to the present study, the study of Freuhwald‐Schultes et al.12 showed elevated serum leptin concentrations in type 2 diabetes patients with early stages of renal disease, (i.e., microalbuminuric and macroalbuminuric nephropathy), whereas serum leptin level did not show significant association with diabetic neuropathy.
The kidney plays a substantial role in leptin removal from the plasma by absorbing and degrading the peptide35. Some authors suggested that renal leptin degradation is already impaired in patients with mild to moderate renal insufficiency36. Regarding retinopathy, Uckaya et al.13 reported that plasma levels of leptin are elevated in type 2 diabetes patients with retinopathy, proportionate to the severity of retinopathy. Leptin‐induced promotion of angiogenesis and neovascularization lends support to the possibility that leptin might play a role in the progression of diabetic retinopathy to a proliferative phase13. Leptin has been shown to be associated with insulin resistance and inflammatory factors37. In agreement with previous studies34, a significant positive correlation was observed in the present study with BMI, SBP, creatinine, TG, hsCRP, mean PWV, HOMA‐IR and a significant negative correlation with eGFR.
The reasons why previous published studies have been inconsistent regarding the effects of adipocytokines on different diabetic microangiopathies are not clear. Some possible explanations can be suggested. First, the discrepancy might be a result of differences of study populations according to the various diagnostic criteria. Second, different distributions of severity of microangiopathies in the study participants could be another reason. In the present study, the number of participants with advanced microangiopathies might have been too small to detect significant differences. Third, ethnic differences could have affected the relationship between diabetic microvascular complications and serum adipocytokines levels.
Several limitations of the present study should be addressed. First, because of the cross‐sectional design, we cannot determine the causative relationship between adiponectin and diabetic microvascular complications. Prospective studies are required to address this important question. Second, because the present study population consisted of individuals who received comprehensive examinations for the complications of diabetes, we can assume that these patients had relatively good compliance. Therefore, some characteristics of the present study population might be substantially different from those of other patients who did not undergo complication studies. Therefore, the generalizability of the present study could be limited. Third, the numbers of the participants who had nephropathy and/or retinopathy were too small. The strength of the present study would be greater if a larger number of patients with various stages of microvascular complications were analyzed. Finally, we could not exclude the possibility that confounding factors related to treatments, especially medications such as TZDs or hypolipidemic drugs, could have affected the adipocytokine levels in our patients.
In conclusion, serum adiponectin levels were elevated in patients with diabetic retinopathy or neuropathy, and serum leptin levels were significantly higher in patients with neuropathy. In particular, the present study suggests that higher serum adiponectin levels could be associated with diabetic neuropathy. Future prospective studies with larger numbers of patients are required to establish a direct relationship between plasma adipocytokine concentrations and the development or severity of diabetic microvascular complications.
Acknowledgements
This work was supported by grants from the Soonchunhyang University.
All of the authors have contributed significantly to the collection and analysis of data, have reviewed and edited the manuscript, and have agreed to its content and submission for publication, and none have any financial relationships or support that might pose a conflict of interest.
J Diabetes Invest 2014; 5: 333–339
References
- 1.Meier U, Gressner AM. Endocrine regulation of energy metabolism. Review of pathobiochemical and clinical chemical aspects of leptin, ghrelin, adiponectin, and resistin. Clin Chem 2004; 50: 1511–1525 [DOI] [PubMed] [Google Scholar]
- 2.Matsuda M, Shimomura I, Sato M, et al Role of adiponectin in preventing vascular stenosis. J Biol Chem 2002; 277: 27487–27491 [DOI] [PubMed] [Google Scholar]
- 3.Hotta K, Funahashi T, Arita Y, et al Plasma concentrations of a novel, adipose‐specific protein, adiponectin, in type 2 diabetic patients. Arterioscler Thromb Vasc Biol 2000; 20: 1595–1599 [DOI] [PubMed] [Google Scholar]
- 4.Matsuda M, Kawasaki F, Inoue H, et al Possible contribution of adipocytokines on diabetic neuropathy. Diabetes Res Clin Pract 2004; 66: S121–S123 [DOI] [PubMed] [Google Scholar]
- 5.Looker HC, Krakoff J, Funahashi T, et al Adiponectin concentrations are influenced by renal function and diabetes duration in Pima Indians with type 2 diabetes. J Clin Endocrinol Metab 2004; 89: 4010–4017 [DOI] [PubMed] [Google Scholar]
- 6.Ran J, Xiong X, Liu W, et al Increased plasma adiponectin closely associates with vascular endothelial dysfunction in type 2 diabetic patients with diabetic nephropathy. Diabetes Res Clin Pract 2010; 88: 177–183 [DOI] [PubMed] [Google Scholar]
- 7.Kato K, Osawa H, Ochi M, et al Serum total and high molecular weight adiponectin levels are correlated with the severity of diabetic retinopathy and nephropathy. Clin Endocrinol 2008; 68: 442–449 [DOI] [PubMed] [Google Scholar]
- 8.Yilmaz MI, Sonmez A, Acikel C, et al Adiponectin may play a part in the pathogenesis of diabetic retinopathy. Eur J Endocrinol 2004; 151: 135–140 [DOI] [PubMed] [Google Scholar]
- 9.Considine RV, Sinha MK, Heiman ML, et al Serum immunoreactive‐leptin concentration in normal‐weight and obese humans. N Engl J Med 1996; 334: 292–295 [DOI] [PubMed] [Google Scholar]
- 10.Krasnodebski P, Bak MI, Opolski G, et al Leptin in acute myocardial infarction and period of convalescence in patients with type 2 diabetes mellitus. Kardiol Pol 2010; 68: 648–653 [PubMed] [Google Scholar]
- 11.Sari R, Balci MK, Apaydin C. The relationship between plasma leptin levels and chronic complications in patients with type 2 diabetes mellitus. Metab Syndr Relat Disord 2010; 8: 499–503 [DOI] [PubMed] [Google Scholar]
- 12.Freuhwald‐Schultes B, Kern W, Beyer J, et al Elevated serum leptin concentrations in type 2 diabetic patients with microalbuminuria and macroalbuminuria. Metabolism 1999; 48: 1290–1293 [DOI] [PubMed] [Google Scholar]
- 13.Uckaya G, Ozata M, Bayraktar Z, et al Is leptin associated with diabetic retinopathy? Diabetes Care 2000; 23: 371–376 [DOI] [PubMed] [Google Scholar]
- 14.Mariano F, Bussolati B, Piccoli G, et al Renal vascular effects of cytokines. Blood Purif 1997; 15: 262–272 [DOI] [PubMed] [Google Scholar]
- 15.Flyvbjerg A. Diabetic angiopathy, the complement system and tumor necrosis factor superfamily. Nat Rev Endocrinol 2010; 6: 94–101 [DOI] [PubMed] [Google Scholar]
- 16.Navarro JF, Mora C, Macia M, et al Inflammatory parameters are independently associated with urinary albumin excretion in type 2 diabetes mellitus. Am J Kidney Dis 2003; 42: 53–61 [DOI] [PubMed] [Google Scholar]
- 17.Hasegawa G, Nakano K, Sawada M, et al Possible role of tumor necrosis factor and interleukin‐1 in the development of diabetic nephropathy. Kidney Int 1991; 40: 1007–1012 [DOI] [PubMed] [Google Scholar]
- 18.Zorena K, Mysliwska J, Mysliwiec M, et al Serum TNF‐α level predicts nonproliferative diabetic retinopathy in children. Mediators Inflamm 2007; 2007: 92196–92200 [DOI] [PMC free article] [PubMed] [Google Scholar]
- 19.Jung CH, Kim BY, Kim CH, et al Association of serum adipocytokine levels with cardiac autonomic neuropathy in type 2 diabetic patients. Cardiovasc Diabetol 2012; 11: 24. [DOI] [PMC free article] [PubMed] [Google Scholar]
- 20.National Glycohemoglobin Standardization Program (NGSP): List of NGSP certified methods. Available at: http://www.ngsp.org/docs/methods.pdf [accessed 2011, August 10].
- 21.Watkins PJ. ABC of diabetes; retinopathy. British Med J 2003; 326: 924–926 [Google Scholar]
- 22.Expert Committee of Korean Diabetes Neuropathy Study Group . Diabetic neuropathy management guidebook, 3rd edn Gold Planning and Development, Seoul, 2010. (Korean). [Google Scholar]
- 23.Chun SW, Ko KS. Summary of the update to the diabetic neuropathy management guidebook. J Korean Diabetes 2012; 13: 115–123 (Korean). [Google Scholar]
- 24.Feldman EL, Stevens MJ, Thomas PK, et al A practical two‐step quantitative clinical and electrophysiological assessment for the diagnosis and staging of diabetic neuropathy. Diabetes Care 1994; 17: 1281–1289 [DOI] [PubMed] [Google Scholar]
- 25.Pitei DL, Watkins PJ, Stevens MJ, et al The value of the Neurometer in assessing diabetic neuropathy by measurement of the current perception threshold. Diabet Med 1994; 11: 872–876 [DOI] [PubMed] [Google Scholar]
- 26.Imagawa A, Funahashi T, Nakamura T, et al Elevated serum concentration of adipose‐derived factor, adiponectin, in patients with type 1 diabetes. Diabetes Care 2002; 25: 1665–1666 [DOI] [PubMed] [Google Scholar]
- 27.Zhang W, Liu H, Al‐Shabrawey M, et al Inflammation and diabetic retinal microvascular complications. J Cardiovasc Dis Res 2011; 2: 96–103 [DOI] [PMC free article] [PubMed] [Google Scholar]
- 28.Saito T, Saito O, Kawano T, et al Elevation of serum adiponectin and CD146 levels in diabetic nephropathy. Diabetes Res Clin Pract 2007; 78: 85–92 [DOI] [PubMed] [Google Scholar]
- 29.Hosokawa Y, Yamada Y, Obata Y, et al Relationship between serum cystatin C and serum adiponectin level in type 2 diabetic patients. Clin Exp Nephrol 2012; 16: 399–405 [DOI] [PubMed] [Google Scholar]
- 30.Lin J, Hu EB, Curhan G. Serum adiponectin and renal dysfunction in men with type 2 diabetes. Diabetes Care 2007; 30: 239–244 [DOI] [PubMed] [Google Scholar]
- 31.Diez JJ, Iglesias P. The role of the novel adipocyte‐derived hormone adiponectin in human disease. Eur J Endocrinol 2003; 148: 293–300 [DOI] [PubMed] [Google Scholar]
- 32.Bjaj M, Suraamornkul S, Piper P, et al Decreased plasma adiponectin concentrations are closely related to hepatic fat content and hepatic insulin resistance in pioglitazone‐treated type 2 diabetic patients. J Clin Endocrinol Metab 2004; 89: 200–206 [DOI] [PubMed] [Google Scholar]
- 33.Perelas A, Tsoulkani K, Perrea D. Effects of lipid‐lowering drugs on adiponectin. Curr Vasc Pharmacol 2010; 8: 836–848 [DOI] [PubMed] [Google Scholar]
- 34.Asakawa H, Tokunaga K, Kawakami F. Relationship of leptin level with metabolic disorders and hypertension in Japanese type 2 diabetes mellitus patients. J Diabetes Complications 2001; 15: 57–62 [DOI] [PubMed] [Google Scholar]
- 35.Meyer C, Robson D, Rackovsky N, et al Role of the kidney in human leptin metabolism. Am J Physiol 1997; 273: E903–E907 [DOI] [PubMed] [Google Scholar]
- 36.Sharma K, Considine RV, Michael B, et al Plasma leptin is partly cleared by the kidney and is elevated in hemodialysis patients. Kidney Int 1997; 51: 1980–1985 [DOI] [PubMed] [Google Scholar]
- 37.Jung CH, Rhee EJ, Choi JIH, et al The relationship of adiponectin/leptin ratio with homeostasis model assessment insulin resistance index and metabolic syndrome in apparently healthy Korean male adults. Diabet Metab J 2010; 34: 237–243 [DOI] [PMC free article] [PubMed] [Google Scholar]