Abstract
There has been an overall decline in the United States incidence of Primary CNS Lymphoma (PCNSL) from 1998 to 2008. This study’s intent was to characterize the cohorts contributing to it. First, calculated the PCNSL incidence rates from nine Surveillance, Epidemiology, and End Results (SEER) registries for time period 1973 to 2008. Second, examined the time trends overall and by age and gender. Third, used 1992–2008 SEER data from the same registries to obtain overall trends for diffuse large B-cell lymphoma (DLBCL). Last, rates were age-adjusted to the 2000 US standard population and reported per 100,000 person-years. Rates continued to increase in women at all ages and men aged 65 and older. In men aged 20–39 and 40–64 years incidence rates peaked in 1995 and then declined dramatically, stabilizing after 1998. The trends in the incidence of PCNSL over this time frame were significantly different from DLBCL for ages 20–39 (P < 0.001) and 40–64 (P < 0.001) years but were not different for the 65 years and older age group (P = 0.99). The overall PCNSL incidence rate declined since 1995 and was driven primarily by the changing incidence in young and middle-aged men. The rate has continued to increase in men aged 65 years and older and in women. The trends in incidence in the younger age groups over this time period did not parallel those observed for DLBCL.
Introduction
An updated analysis of the Surveillance, Epidemiology, and End Results (SEER) data through 2008 found that Pri-mary central nervous system (CNS) Lymphoma (PCNSL) incidence peaked in 1995 and then declined in all age groups under the age of 65 years, while rates continued to increase in those aged 65–74 years and most strongly in those aged 75+ years [1]. The aim of the present study was to use SEER data to evaluate trends by age group and sex and to compare these to overall trends for systemic diffuse large B-cell lymphoma (DLBCL). We used the same methods and nine SEER registries as in our prior study of PCNSL incidence in the US [2]. We also conducted the same sensitivity analyses (exclusion of data from the San Francisco registry and never married men) as in our prior report [2]. Lastly, we compared PCNSL rates to time trends for Kaposi sarcoma (KS) (as a surrogate for impact of the HIV epidemic) and systemic DLBCL (to determine if PCNSL trends were unique or part of a broader pattern).
Materials and Methods
Data sources
Incidence data from 1973 to 2008 were derived from the original nine databases (SEER 9) used in the Olson et al. [2] report—Connecticut, Hawaii, Iowa, New Mexico, Utah, Atlanta, Detroit, Seattle, and San Francisco-Oakland. PCNSL was classified using the third edition of the International Classification of Disease-Oncology (ICD-O-3) [3]. PCNSL was defined by cancer diagnoses in anatomic sites of spinal cord, cranial nerves, and other parts of the CNS (ICD-O-3 codes C70.0-C72.9) and specified non-Hodgkin’s lymphoma (NHL) morphologies (ICD-O-3 codes 9590–9595 and 9670–9723). We also obtained data on KS (ICD-O-3 codes 9140) from the nine SEER registries [3]. We used the approach of Morton et al. for DLBCL incidence rates in the nine SEER registries over the time span 1992–2008 [4].
Statistical methods
Age-adjusted incidence rates for male and female patients were calculated by calendar year using the SEER*STAT program. Rates were age-adjusted to the 2000 US standard population and reported per 100,000 person-years. All analyses were restricted to persons aged ≥ 20 years. Age-adjusted rates were examined from the original nine registries. Trends over time and group comparisons were assessed using Poisson regression. P-values were two-sided and P < 0.05 was considered statistically significant. As in the Olson et al. article [2], due to a historically high prevalence of HIV in the San Francisco-Oakland area, the data from this registry and never-married men and women in any registry were excluded in sensitivity analyses as an indirect approach to assess the impact of the HIV epidemic on the overall results. As a test of the validity of this exclusion, we also compared the impact of the exclusion on the rates for KS, a cancer strongly associated with HIV [5].
Results
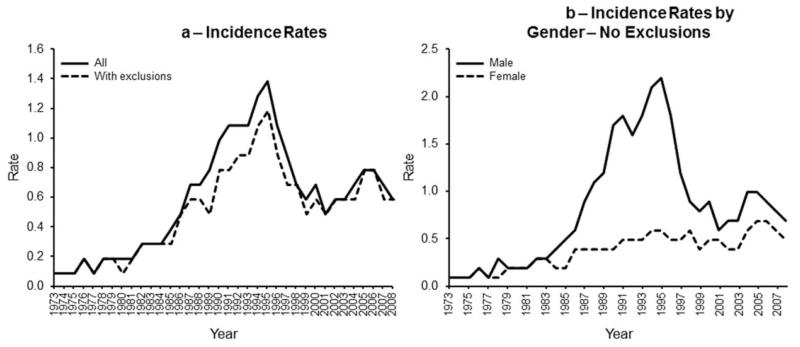
Table I reports the incidence rates for the 1998–2008 update along with rates for 1973–1984 and 1985–1997 [2]. The rates reported in Table I are age-adjusted to the 2000 US standard population; our previous publication used the 1970 US standard population. Figure 1a depicts PCNSL incidence for all age groups derived from the original nine SEER registries. The overall incidence of PCNSL in the general population increased from 1973 to a peak in 1995 (P < 0.001), and has decreased and stabilized since that time point (p < 0.001). Figure 1b shows that the incidence inflection was seen only in men. When we excluded the San Francisco-Oakland SEER Registry and never-married men and women, the incidence rates were somewhat lower, but the pattern remained. The validity of this exclusion approach was assessed by examining the annual incidence of KS with and without the same exclusion criteria. KS incidence increased dramatically from 1982 and peaked in 1989 (5 years earlier than for PCNSL), followed by a dramatic decrease and leveling off in 1997.
TABLE I.
Primary Central Nervous System Lymphoma (PCNSL) Surveillance, Epidemiology, and End Results (SEER) Program Incidencea
| Incidence rates (per 100,000)b |
|||
|---|---|---|---|
| Populations | 1973–1984 | 1985–1997 | 1998–2008 |
| All SEER registries | 0.2 | 0.9 | 0.7 |
| Male | 0.2 | 1.5 | 0.8 |
| Female | 0.2 | 0.5 | 0.5 |
| All SEER registries | |||
| 20–39 years | 0 | 0.7 | 0.2 |
| Male | 0.1 | 1.4 | 0.3 |
| Female | 0 | 0.1 | 0.1 |
| 40–64 years | 0.2 | 0.9 | 0.6 |
| Male | 0.2 | 1.5 | 0.8 |
| Female | 0.2 | 0.4 | 0.4 |
| 65 years or older | 0.5 | 1.4 | 1.8 |
| Male | 0.5 | 1.7 | 2.0 |
| Female | 0.5 | 1.3 | 1.7 |
| Non-San Francisco registries with marital exclusions |
0.2 | 0.8 | 0.6 |
| Male | |||
| Female | 0.2 | 1.1 | 0.7 |
| Non-San Francisco registries with marital exclusions |
|||
| 20–39 years | 0 | 0.5 | 0.2 |
| Male | 0.1 | 0.9 | 0.3 |
| Female | 0 | 0.1 | 0.1 |
| 40–64 years | 0.2 | 0.7 | 0.5 |
| Male | 0.2 | 1.0 | 0.7 |
| Female | 0.2 | 0.4 | 0.4 |
| 65 years or older | 0.4 | 1.5 | 1.8 |
| Male | 0.5 | 1.7 | 2.0 |
| Female | 0 | 1.3 | 2.0 |
Data excluded never-married cases and those cases in which the marital status was unknown. Calculated from SEER.
STAT 3.0.14.
Figure 1.
(a) Incidence rates derived from the original nine registries. The overall incidence in the general population increased from 1973 to a peak in 1995 (P < 0.001) and then decreased and stabilized since that time point (P < 0.001) [solid line]. Exclusion criteria (see text) resulted in a slightly lower rate, but the pattern remained (dotted line). (b) Incidence rates (with exclusions). Shows incidence rates by age group. PCNSL incidence rates increased in 1995 and then decreased in the 20- to 39-year-old age group and 40- to 64-year-old age group (P < 0.00) in each comparison). In contrast, incidence steadily increased in the 65+ year old age group.
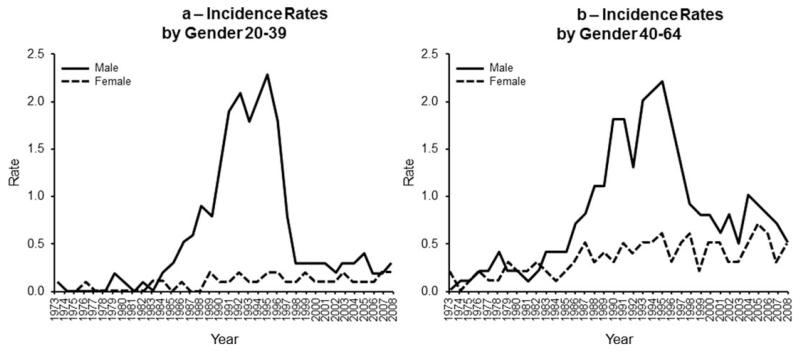
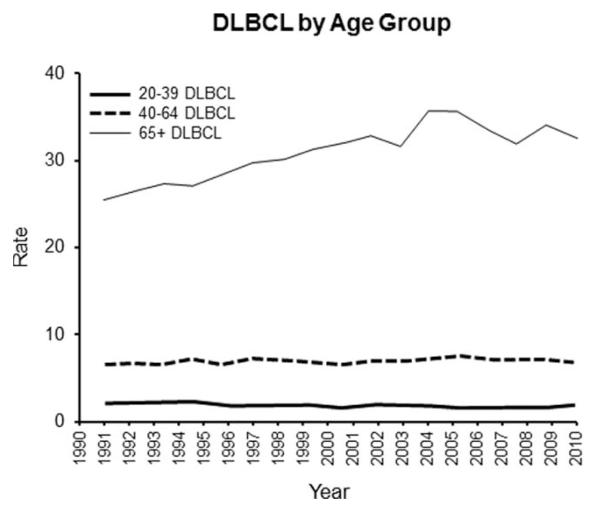
PCNSL incidence rates increased to 1995 and then decreased in the 20–39 and 40–64 age groups (P < 0.001 in each comparison). In contrast, PCNSL incidence steadily increased in the 65 and older age group. Using the 1995 inflection point, the trend up to 1995 was statistically significant (P < 0.001) and then the increase was only marginally significant (P = 0.058). When incidence rates were assessed by sex and age groups, the incidence inflection point only occurred for men 20–39 (Fig. 2a) and 40–64 years of age (Fig. 2b). Lastly, we compared these rates to the SEER data for systemic DLBCL (Fig. 3). For the total and for each age group, the DLBCL and PCNSL incidence rates are significantly different from each other (P < 0.001 in each case). The rate change over time was also significantly different for the total, age 20–39, and age 40–64 (P < 0.001 in each case). The rate change over time was similar for the two diseases in the 65 years and older age group (P = 0.99).
Figure 2.
(a) Incidence rates by gender (20- to 39-years old). Demonstrates incidence rates assessed by sex and age groups. Shows that the dramatic peak in incidence only occurred for men 20–39 years of age. (b) Incidence rates by gender (40- to 64-years old). Demonstrates incidence rates assessed by sex and age groups. Shows that the dramatic peak in incidence only occurred for men 40–64 years of age.
Figure 3.
DLBCL by age group. Shows incidence rates for systemic DLBCL. For the total in each age group, the DLBCL and PCNSL incidence rates are significantly different from each other (P < 0.001 in each case). Please note that the absolute values do not allow PCNSL and DLBCL rates to be shown in the same figure.
Discussion
The current analysis confirmed the observations of Villano et al. that PCNSL incidence rates, which were increasing prior to 1995, have leveled off [1]. Our data extend those observations and add four key points. First, when data was analyzed as a whole, important age and sex differences were obscured. Specifically, we documented a dramatic rise and then decline in the 1980s–1990s among men <65 years of age (and most striking for <40 years of age) which was not observed for women or for men 65 years and older. The pattern remained even after exclusions designed to limit the impact of the HIV epidemic. Second, rates were only slightly higher for men compared to women in the 65 years and older age group, and for both sexes in this group there was a steady increase in incidence over time. Third, the trends in incidence in young age groups in this time period were significantly different from DLBCL for ages 20–39 (P < 0.001) and 40–64 (P < 0.001) years, but there was no difference for the 65 years and older age group (P 5 0.99). Fourth, the pattern remained even after a “sensitivity analysis [2] was used as an indirect approach to assess the impact of HIV infection on the overall results.
Since PCNSL is an “AIDS-defining tumor” it is assumed that the increase and then decrease among younger male patients was driven mostly by HIV infection. HIV infection data are not uniformly recorded in SEER but in Norway, where AIDS status is defined, an increasing incidence of PCNSL was demonstrated in the years 1989–2003 [6]. Following that, the absolute incidence rate of PCNSL per 1,000 person-years decreased during the consecutive 5-year periods. Thus, a partial explanation for the slowing in the increase of PCNSL rates overall might be the reduction in the number of AIDS cases in younger male patients. Besson et al. [7] showed that the incidence of AIDS-related lymphomas (ARL) before and after the use of highly active retroviral therapies (HAART) in HIV-infected patients in the French HIV Hospital Database decreased between 1993–1994 and 1997–1998 from 86.0 per 10,000 to 42.9 per 10,000 person-years.
Nevertheless, the use of HAART cannot explain the drop in incidence of Kaposi’s since its inflection point predated its availability. What alternate explanations might be considered? First, the “inflection” could relate to inherent differences in immunocompetence of younger versus older patients. If one considers CD4 counts as a valid surrogate for immunocompetency, an expanding literature suggests that CD4 lymphocytopenia is not unusually rare in the elderly [8]. Such potentially valuable paraclinical information is not available in SEER. Second, the “inflection” could relate to a decrease in HIV infection among younger patients but not in older person where there has been an increased incidence of HIV/AIDS in patients over the age of 50 [9]. However if the observed changes in incidence among younger patients were due to HAART, one would have expected to see the same differential in PCNSL incidence before and after the mid-1990s in the older male patients. Third, the continuing rise in PCNSL incidence in older patients was unaffected by the use of the “Exclusion Criteria” as a HIV infection surrogate [2]. Since SEER doesn’t record HIV status, better surrogates will need to be developed and validated. Fourth, since PCNSL is generally regarded as a unique extranodal DLBCL, the slowing of overall incidence and the decrease in incidence in younger male patients might relate to a decline in incidence of lymphoma in general. Our data for younger men and women do not support this interpretation. Last, DLBCL that occur in immune-privileged sites such as the brain and testis may have a distinct biology. Braggio et al. [10] demonstrated genomic differences between samples from 17 PCNSL patients and 59 systemic DLBCL patients in four distinct domains, while Booman et al. [11] showed that genomic alterations and gene expression differ between testicular and nodal DLBCL.
In summary, our data demonstrated that first, the overall PCNSL incidence rate has declined since 1996; second, the rate has continued to increase in men and women over age 651; and the rapid-rise peak in the mid-1990s and then sudden decline in incidence in younger patients was specific to male patients.
Acknowledgment
Special thanks to Sean Altekruse, DVM, MPH, PhD of NCI SEER, and Ingfrid Haldorsen, MD, PhD of the University of Bergen and the Norwegian Cancer Registry.
Contract grant sponsor: Mayo SPORE in Brain Cancer; Contract grant number: P50 CA108961; Contract grant sponsor: Brain SPORE Supplement; Contract grant number: P50CA108961-03S; Contract grant sponsor: Iowa/Mayo Clinic Lymphoma SPORE; Contract grant numbers: P50 CA97274, R03 CA137757; Contract grant sponsor: “Steve’s Run,” Dowagiac MI.
Footnotes
Conflict of interest: Nothing to report
Presented in part at the 11th International Conference on Malignant Lymphoma, June 15, 2011 Lugano, Switzerland.
Author Contribution
Contribution: BPO: concept, design, analysis, interpretation, manuscript completion, corresponding author; PAD: analysis, interpretation, manuscript review; CT: data acquisition, manuscript preparation; JRC: interpretation, manuscript review.
References
- 1.Villano JL, Koshy M, Shaikh H, et al. Age, gender, and racial differences in incidence and survival in primary CNS lymphoma. Br J Cancer. 2011;105:1414–1418. doi: 10.1038/bjc.2011.357. [DOI] [PMC free article] [PubMed] [Google Scholar]
- 2.Olson JE, Janney CA, Rao RD, et al. The continuing increase in the incidence of primary central nervous system non-Hodgkin lymphoma: a surveillance, epidemiology, and end results analysis. Cancer. 2002;95:1504–1510. doi: 10.1002/cncr.10851. [DOI] [PubMed] [Google Scholar]
- 3.Site Recode ICD-O-3 (1/27/2003) Definition. Available at: http://seer.cancer.gov/siterecode/icdo3_d01272003/
- 4.Morton LM, Wang SS, Devesa SS, et al. Lymphoma incidence patterns by WHO subtype in the United States, 1992-2001. Blood. 2006;107:265–276. doi: 10.1182/blood-2005-06-2508. [DOI] [PMC free article] [PubMed] [Google Scholar]
- 5.Uldrick TS, Whitby D. Update on KSHV epidemiology, Kaposi Sarcoma pathogenesis, and treatment of Kaposi Sarcoma. Cancer Lett. 2011;305:150–162. doi: 10.1016/j.canlet.2011.02.006. [DOI] [PMC free article] [PubMed] [Google Scholar]
- 6.Haldorsen IS, Krakenes J, Goplen AK, et al. AIDS-related primary central nervous system lymphoma: A Norwegian national survey 1989–2003. BMC Cancer. 2008;8:225. doi: 10.1186/1471-2407-8-225. [DOI] [PMC free article] [PubMed] [Google Scholar]
- 7.Besson C, Goubar A, Gabarre J, et al. Changes in AIDS-related lymphoma since the era of highly active antiretroviral therapy. Blood. 2001;98:2339–2344. doi: 10.1182/blood.v98.8.2339. [DOI] [PubMed] [Google Scholar]
- 8.Wikby A, Maxson P, Olsson J, et al. Changes in CD8 and CD4 lymphocyte subsets, T cell proliferation responses and non-survival in the very old: The Swedish longitudinal OCTO-immune study. Mech Ageing Dev. 1998;102:187–198. doi: 10.1016/s0047-6374(97)00151-6. [DOI] [PubMed] [Google Scholar]
- 9.Statistics Overview. Available at: http://www.cdc.gov/hiv/topics/surveillance/basic.htm.
- 10.Braggio E, McPhail ER, Macon W, et al. Primary central nervous system lymphomas: A validation study of array-based comparative genomic hybridization in formalin-fixed paraffin-embedded tumor specimens. Clin Cancer Res. 2011;17:4245–4253. doi: 10.1158/1078-0432.CCR-11-0395. [DOI] [PMC free article] [PubMed] [Google Scholar]
- 11.Booman M, Szuhai K, Rosenwald A, et al. Genomic alterations and gene expression in primary diffuse large B-cell lymphomas of immune-privileged sites: The importance of apoptosis and immunomodulatory pathways. J Pathol. 2008;216:209–217. doi: 10.1002/path.2399. [DOI] [PubMed] [Google Scholar]


