

Abstract
The National Cancer Institute’s NCI-60 cell line panel, the most extensively characterized set of cells in existence and a public resource, is frequently used as a screening tool for drug discovery. Since many laboratories around the world rely on data from the NCI-60 cells, confirmation of their genetic identities represents an essential step in validating results from them. Given the consequences of cell line contamination or misidentification, quality control measures should routinely include DNA fingerprinting. We have, therefore, used standard DNA microsatellite short tandem repeats to profile the NCI-60, and the resulting DNA fingerprints are provided here as a reference. Consistent with previous reports, the fingerprints suggest that several NCI-60 lines have common origins: the melanoma lines MDA-MB-435, MDA-N, and M14; the central nervous system lines U251 and SNB-19; the ovarian lines OVCAR-8 and OVCAR-8/ADR (also called NCI/ADR); and the prostate lines DU-145, DU-145 (ATCC), and RC0.1. Those lines also demonstrate that the ability to connect two fingerprints to the same origin is not affected by stable transfection or by the development of multidrug resistance. As expected, DNA fingerprints were not able to distinguish different tissues-of-origin. The fingerprints serve principally as a barcodes.
Keywords: DNA fingerprinting, NCI-60, cell contamination
INTRODUCTION
The first human cell line, HeLa, was established in 1951, and, by 1956, mycoplasma contamination had been detected in it (1). As other cell lines have been established, contamination with microorganisms, contamination with other cell types, and misidentification have grown in importance as hindrances to incisive research with those cells. In particular, over the past decade, inter- and intra-species cross contaminations have been reported in 18 – 36% of the lines deposited in worldwide cell banks (2, 3), and repeated occurrences of cell misidentification have underscored the necessity of regular assessment of the origin of cell line DNA. In recent years, therefore, new techniques have been developed for identifying contaminated and misidentified lines by DNA microsatellite fingerprinting (4, 5). Given the low cost, high efficiency, and high reproducibility of the assays, the scientific community is expected to move toward a model in which manuscript submission and grant application processes require researchers to provide DNA fingerprinting data for their cell lines. Toward that end, we here describe a DNA fingerprinting analysis of the NCI-60 human cancer cell line panel as a reference for research with those widely used cells.
The NCI-60 panel, originally assembled to screen for anticancer agents (6–8), has been profiled more extensively at the molecular level than any other set of cells in existence (9). That molecular characterization, a central subject of this journal’s Spotlight on Molecular Profiling Series (9–18), provided motivation for the present study. The 60 lines include cancers of breast, central nervous system, colon, lung, ovary, prostate, and renal origin, plus leukemias and melanomas. Drug discovery with the panel has recently been reviewed by Shoemaker (8) and by Holbeck (7). More than 100,000 chemically defined compounds as well as a large number of natural product extracts have been screened for activity. The panel has also been molecularly profiled using array-based platforms (9) and small-molecule profiling techniques (unpublished data). Those data can be accessed through several databases: the NCI Developmental Therapeutics Program website (http://dtp.nci.nih.gov/); CellMiner (http://discover.nci.nih.gov/cellminer) (9, 17); the SKY/M-FISH/CGH Database (http://www.ncbi.nlm.nih.gov/sky/); and the Gene Expression Omnibus (http://www.ncbi.nlm.nih.gov/geo/). Those data sets have provided the foundation for many translational discoveries (e.g., (15)), but misidentification has been reported for several of the lines: OVCAR-8/ADR was initially thought to be a doxorubicin (Adriamycin)-resistant derivative of MCF7 breast cancer. However, we observed that it bore no relation in phenotype to those cells, hence it was renamed, agnostically, NCI/ADR. We later found, on the basis of spectral karyotyping and comparative genomic hybridization (12, 19, 20), that it is actually a derivative of OVCAR-8. MDA-MB-435 and its HER2/ERBB2-transfectant MDA-N were previously thought to be of breast origin. However, we found on the basis of transcript expression profiles and other characteristics that they are melanomas (21, 22). Re-sequencing (12) and genotyping (23) then showed the two to be direct relatives of the melanoma line M14. Likewise, SNB-19 was found (by re-sequencing) to be a direct relative of U251 (12).
DNA fingerprinting takes advantage of hypervariable regions within DNA (24). An inexpensive, standardized technique was developed for forensic and paternity applications based on short tandem repeat (STR) profiling of those hypervariable DNA regions (25), and it is now commonly employed for cell line characterization (26, 27). The kit used in this study included the 13 combined DNA index system (CODIS) loci, the amelogenin gender-determining marker used in forensics, and 2 additional loci for a total of 16 loci (32 alleles). Those loci have been selected based on desirable properties: they are discrete, they behave according to known principles of population genetics, and STR profiles can be determined with very small amounts of DNA. The multiplexed assay uses PCR to amplify tetranucleotide repeat sequences for those 16 loci. The resulting data indicate the number of STRs at each locus surveyed. These data provide a reference fingerprint for the cell lines.
MATERIALS AND METHODS
Cell culture
Cell lines were maintained in RPMI-1640 (Lonza) containing 5% fetal bovine serum, 2 mM L-glutamine, and no antibiotics. All cell lines were tested for mycoplasma using the MycoAlert assay (Lonza) at the commencement of this study and found to be negative. Sources and patient donor information are described elsewhere (28), updated and expanded at http://discover.nci.nih.gov/cellminer. The abbreviation before each cell line name denotes tissue-of-origin (BR = breast, CNS = central nervous system, CO = colon, ME = melanoma, OV = ovarian, PR = prostate, RE = renal). Additional DNA samples from BT-549, MCF7, and MDA-MB-231 cell lines were kindly provided by Natasha Caplen and Kristen Gehlhaus. Michael Birrer and Laurent Ozbun provided additional OVCAR-3 and SK-OV-3 cell samples, and Christina Annunziata and Elise Kohn provided additional DNA samples of OVCAR-3, OVCAR-4, OVCAR-5, OVCAR-8, and SK-OV-3.
DNA Fingerprinting
DNA was prepared from cells using the Qiagen Blood & Cell Culture DNA Maxi Kit according to the manufacturer’s protocol (Qiagen). DNA fingerprints were obtained for all cell lines using the AmpF STR Identifiler PCR Amplification Kit (Applied Biosystems) according to the manufacturer’s protocol. The kit amplifies the amelogenin gender-determining marker and 15 tetranucleotide repeat loci (listed in Table 1) in a single PCR amplification using 33 primers (the extra one is a degenerate primer targeting a mutation at the D8S1179 locus). That combination of markers is consistent with worldwide database recommendations for identity testing. Each of the STRs used in this study has a tetranucleotide repeat sequence. Allele calls were made from peak plots by comparing peaks to known fragment sizes using GeneMapper 4.0 (Applied Biosystems). Intermediate-sized alleles were observed for D19S433, D21S11, D7S820, FGA, and TH01 (Table 1), and, accordingly, a decimal followed by an integer indicates additional alleles at those loci.
Table 1.
DNA fingerprints for NCI-60 cell lines (DTP source)
 |
|---|
 |
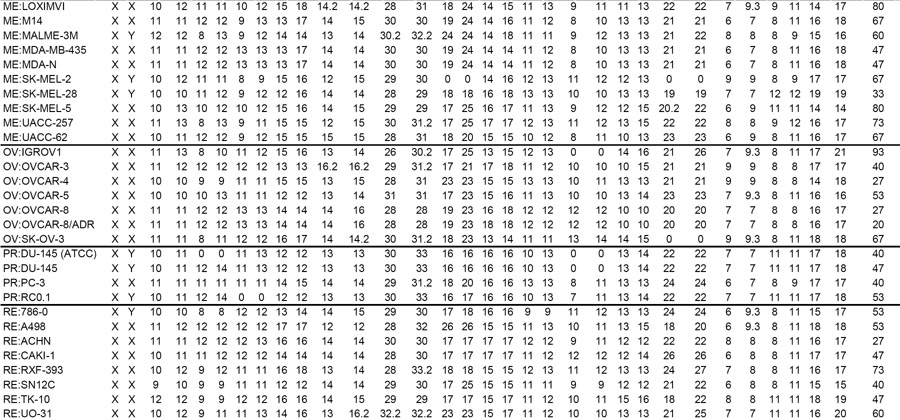 |
Number of STRs at each of the sixteen surveyed loci (two alleles, designated by _1 and _2, per locus). Numbers following a decimal indicate the number of bases in an incomplete final STR.
A genomic mixture; values shown for reference purposes only. A comma separates allele calls for multiple peaks.
Overall heterozygosity calculated within each cell line over 15 surveyed loci (AMEL excluded).
Comparative analysis
The STR data from all possible combinations of cell line pairs were compared using a similarity metric previously reported by Masters et al. (27). Percent similarity was computed by dividing the number of identical alleles by 32 (the total number of surveyed alleles) then multiplying by 100 (Supplementary Table S1), where “identical” means same number of STRs. Since technical repeats suggested that a difference of one STR at one site probably does not indicate a different allele (data not shown), we computed a second set of comparisons in which the definition of “identical” was relaxed to include a difference of one STR at one site (Table 2). The algorithm used to compute those similarity metrics and instructions for using it are provided on our website (http://discover.nci.nih.gov). Both sets of calculations used 80% similarity as a cutoff for “same” (27).
Table 2.
Percent similarity of each pair of cell lines (allowing a difference of one STR at one locus)
 |
|---|
 |
 |
DNA fingerprinting techniques normally assume two alleles; the presence of more than two alleles in DNA from normal cells indicates genomic heterogeneity, which is typically equated with “contamination.” For the cancer cells profiled here, we defined genomic heterogeneity as the presence of more than two alleles at three or more of the 16 loci. Since insertions, deletions, and translocations are a hallmark of cancer, though, one must be careful about concluding “contamination” upon the observation of genomic heterogeneity, especially if there is no evidence that the cell line has ever exhibited a clean fingerprint. In the NCI-60, only the MOLT-4 cell line was observed to exhibit genomic heterogeneity, but since numerous MOLT-4 stocks dating back as far as possible were found to exhibit the same fingerprint, we cannot apply the “contaminated” label to MOLT-4.
Heterozygosity (i.e., different alleles at a locus) was quantitated in two ways. First, overall heterozygosity was determined within each cell line over the 15 surveyed loci (amelogenin excluded) by dividing the number of loci with different alleles (i.e., at least one peak exhibiting a different number of STRs) by 15. Second, heterozygosity was determined within each of the 15 surveyed loci over the 61 successfully analyzed samples by dividing the number of loci with different alleles by 61.
RESULTS AND DISCUSSION
Molecular profiling of the NCI-60 lines at the DNA, RNA, protein, chromosomal, and pharmacological levels has been a central focus of the Spotlight on Molecular Profiling series in this journal (9–18). To minimize the chance that such profiling studies by our own and other laboratories in the future will be confounded by contamination or misidentification of lines, we undertook DNA fingerprinting of the cells. All but one (MOLT-4) of the NCI-60 cell lines were successfully analyzed. The fingerprints are shown in Table 1, which includes those of two additional cell lines—DU-145 (ATCC) and its camptothecin-resistant derivative, RC0.1. We first analyzed the fingerprints to determine whether cell lines from the same origin (i.e., same patient) could be identified. Similarly, we wondered whether cell lines from the same tissue-of-origin (not necessarily the same patient) would co-cluster. In addition we asked, “What effect does stable transfection have on DNA fingerprint?” and “What effect does the development of drug resistance have on DNA fingerprint?” As loss of heterozygosity is common in cancer, we also asked, “What degree of heterozygosity is exhibited by each cell line and by each of the loci surveyed?” Finally, we surveyed the fingerprints for cell lines that exhibit more than two alleles at a given locus, an indication of genomic contamination.
Matching Profiles
From the 61 fingerprints (MOLT-4 excluded), 1830 pairwise comparisons were made to compute all possible similarity indices (Supplementary Table S1) using a stringent definition of “identical,” as described in Materials and Methods. By that analysis, 55 of the 61 fingerprints were unique (i.e., exhibited less than 80% similarity). Two observations, however, suggested that perfect identity was too stringent a criterion. First, a technical replicate of the OVCAR-8 cell line yielded a one-STR difference at the vWA_1 allele (changed from 16 to 17). Second, the DU-145 (ATCC)|RC0.1 and U251|SNB-19 cell line pairs yielded 78% similarity (Supplementary Table S1), despite the fact that the latter in each case is now known on the basis of other information to have been derived from the former (12, 29). Hence, a practical solution was to maintain a strict 80% cutoff but to relax the definition of “identical” to include a difference of up to one STR. That new algorithm did indeed bump the two aforementioned pairs from 78% to 81% similar (Table 2), so those similarity metrics will be considered the accepted calculations for the remainder of this discussion.
The eight cell line pairs found to be at least 80% similar were: M14|MDA-MB-435, M14|MDA-N, MDA-MB-435|MDA-N, U251|SNB-19, OVCAR-8|OVCAR-8/ADR, DU-145|DU-145 (ATCC), DU-145 (ATCC)|RC0.1, and DU-145|RC0.1. The first three of those pairs were expected based on re-sequencing (12) and genotyping (23), which showed that the MDA-MB-435 melanoma and its HER2/ERBB2-transfectant MDA-N were derived from the M14 melanoma line. Similarly, re-sequencing indicated that the SNB-19 line is derived from U251 (12). The OVCAR-8|OVCAR-8/ADR similarity was also expected since the latter was found, on the basis of spectral karyotyping and comparative genomic hybridization, to be close to identical to the former (12, 19, 20). The DU-145|DU-145 (ATCC) similarity was expected since they are the same prostate line. The absence of 100% similarity appeared to be due to deletion of the D13S317 locus in the latter (Table 1), but array-based comparative genomic hybridization data from the two DU-145 lines suggested that D13S317 was not deleted in either line (data not shown), suggesting that the marker failed to amplify in the Identifiler PCR. After 81%, the next highest similarity metric was 59% for the renal lines ACHN|CAKI-1 (Table 2). The relaxed similarity algorithm in combination with an 80% cutoff therefore identified all pairs known to be similar, and there was a large fall-off to the next highest similarity.
To determine whether DNA fingerprinting could potentially distinguish tissues of origin, we assessed whether similarity indices within each tissue-of-origin were greater than similarity indices across different tissues of origin (Table 1). Mean similarity indices (after eliminating the eight cell line pairs discussed in the previous paragraph, since they would falsely inflate the calculated indices) were 28% for breast, 28% for CNS, 27% for colon, 32% for lung, 32% for leukemia, 32% for melanoma, 29% for ovarian, 31% for prostate, and 36% for renal subsets. In comparison, the overall mean similarity index (including both same and different tissue-of-origin comparisons) was 31% (± 2 SD). It was not possible, therefore, to identify tissue of origin on the basis of the DNA fingerprints.
Interestingly, the amelogenin marker indicated only X chromosomes for the prostate line PC-3. However, amelogenin has been reported to type some males as females incorrectly due to deletion of the Y copy of amelogenin (30). Consistent with that report, cytogenetic analysis has shown that 13 NCI-60 cell lines, including PC-3 (19), have been reported to be of male origin but exhibit Y deletions. In that regard, PC-3 does not appear to be a misidentified cell line.
To determine the effect of culture conditions on DNA fingerprinting, we analyzed a subset of NCI-60 lines from multiple users in three additional laboratories (Table 3). One sample (an OVCAR-3 culture) was only 28% similar to the DTP version. All of the other comparisons showed at least 80% similarity with the DTP counterpart. Possible explanations for that extreme observation include misidentification of an OVCAR-3 derivative selected for resistance to a particular treatment (31). Aside from that one sample, the smaller differences observed in most of the samples from different laboratories were likely due to differences in culture conditions or genetic drift due to differences in passage number. Such effects can be monoclonal or polyclonal in nature (19). For example, despite 97% similarity between the other OVCAR-3 sample and the DTP version of OVCAR-3, the two lines exhibit large differences in asparagine synthetase (ASNS) protein but not ASNS mRNA expression (14). In addition, the DTP version is ten-fold less sensitive to doxorubicin and expresses significantly lower levels of the transporter TRPM2 (Calcagno et al., manuscript in preparation). Hence, since differences in culture conditions can lead to different phenotypes, our laboratory has focused on using the same culture reagents (e.g., matched batches of fetal bovine serum) for every cell line and on minimizing passage crawl (our frozen stocks are believed to be at passage numbers below 30 since incorporation into the DTP screen).
Table 3.
DNA fingerprints for NCI-60 cell lines (other sources)
 |
Number of STRs at each of the sixteen surveyed loci (two alleles, designated by _1 and _2, per locus). Numbers following a decimal indicate the number of bases in an incomplete final STR.
Stable Transfection
As expected based on previous work (12, 21–23), MDA-MB-435 was 100% similar (i.e., the same fingerprint) to its HER2/ERBB2-transfectant, MDA-N, and both of those lines were 94% similar to M14 (Table 2), from which both are believed to have originated. Hence, consistent with previous reports (27), stable transfection appears to have had little or no effect on the fingerprint results.
Drug Resistance
The ovarian line OVCAR-8/ADR is a doxorubicin (Adriamycin)-resistant derivative of OVCAR-8 (12, 19, 20). Those two lines differed at only one site, yielding a 97% similarity (Table 2). The two versions of DU-145, one from DTP and one from ATCC, were 94% similar to each other, as discussed above. The latter was only 81% similar to its camptothecin-resistant derivative RC0.1, whereas the former was 88% similar, suggesting the possibility that RC0.1 was actually derived from the DTP version of DU-145. That possibility is moot, however, in light of our observation (discussed above) that the D13S317 deletion in the ATCC version of DU-145 appears to be attributable to failure of the D13S317 primers to amplify. That is, if the D13S317 site amplified as expected, there would be no difference between the two DU-145 lines; both would exhibit 88% similarity to RC0.1.
Loss of Heterozygosity
Whereas heterozygosity among normal, non-cancerous human samples (e.g., those analyzed forensically by crime laboratories) is reported to range from 79 to 88% (27), heterozygosity in this study ranged from 7 to 93% for a given cell line (excluding MOLT-4) over the 15 surveyed loci (excluding amelogenin) (Table 1) and from 39 to 69% for a given locus over the 61 successfully fingerprinted samples (Table 4). In the former case, the median was 53% heterozygosity, and the extremes were 7% heterozygosity in BT-549 and 93% heterozygosity in both SF-295 and IGROV1. In the latter case, the median was 56% heterozygosity, and the extremes were 39% heterozygosity at the D13S317 locus and 69% heterozygosity at the D7S820 locus.
Table 4.
Heterozygosity within each surveyed locus across the NCI-60
| Locus | Heterozygosity (%) 1 |
|---|---|
| CSF1PO | 57 |
| D13S317 | 39 |
| D16S539 | 56 |
| D18S51 | 46 |
| D19S433 | 56 |
| D21S11 | 57 |
| D2S1338 | 59 |
| D3S1358 | 46 |
| D5S818 | 57 |
| D7S820 | 69 |
| D8S1179 | 48 |
| FGA | 44 |
| TH01 | 54 |
| TPOX | 62 |
| vWA | 59 |
Calculated within each locus over the 61 samples from Table 1
More than Two Alleles at a Locus
MOLT-4 was the only cell line observed to have more than two alleles at multiple loci. That genomic heterogeneity (i.e., “contamination”) was repeatable in follow-up analyses (data not shown) and has been shown for MOLT-4 by other laboratories (27). In our analysis of MOLT-4, two loci (D21S11 and FGA) gave four peaks, and four loci (D7S8S0, CSF1PO, D19S433, and vWA) gave three peaks (Supplementary Table S2 and Supplementary Figure S1). Interestingly, the heterogeneity is not detected at five of those six loci by spectral karyotyping (19), suggesting that the PCR-based Identifiler assay is more sensitive than spectral karyotyping at detecting multiple alleles at a given locus.
What is the molecular basis for the heterogeneity? It could be 1) intra-cellular due to genomic instability (i.e., rapid structural rearrangement), or 2) inter-cellular due to different cell populations. The first possibility is unlikely since MOLT-4 exhibits a high degree of genomic stability (19). The second hypothesis can be addressed by single-cell subcloning, which is currently underway in our laboratory and will be the topic of a future report.
Another line, SK-OV-3, was previously reported to have three alleles at three loci (27). Contrary to that report, we found no evidence of more than two peaks at any locus for SK-OV-3, suggesting that the previously fingerprinted version of SK-OV-3 was contaminated with another culture.
Conclusion
We report reference DNA fingerprints for the NCI-60 cell line panel in expectation that many other laboratories can use the information (Table 1). We suggest that each laboratory using NCI-60 cell lines should perform the same analysis to confirm the identities of their lines. Any culture that shows a serious deviation from the reference profile should be replaced with a cryopreserved stock of the original line.
Supplementary Material
Acknowledgments
We thank Casey L. Dagnall, Talisa Creavalle, and Tabassum Bandey of the NCI Core Genotyping Facility Production Team for running the Identifiler assay and analyzing the data, We also thank Natasha Caplen, Kristen Gehlhaus, Christina Annunziata, Elise Kohn, Michael Birrer, and Laurent Ozbun for additional samples. PLL is supported by a Pharmacology Research Associate Fellowship from NIGMS, NIH. This research was also supported in part by the Intramural Research Program of the NIH, National Cancer Institute, Center for Cancer Research, and in part under contract N01-CO-12400.
Financial support: This research was supported in part by the Intramural Research Program of the NIH, National Cancer Institute, Center for Cancer Research, and in part under contract N01-CO-12400. PLL is supported by a Pharmacology Research Associate Fellowship from NIGMS, NIH.
Abbreviations
- DTP
Developmental Therapeutics Program
- NCI
National Cancer Institute
- STR
short tandem repeat
Footnotes
Competing Interests Statement: The authors declare no competing interests.
References
- 1.Robinson LB, Wichelhausen RH. Contamination of human cell cultures by pleuropneumonialike organisms. Science. 1956;124:1147–8. doi: 10.1126/science.124.3232.1147. [DOI] [PubMed] [Google Scholar]
- 2.MacLeod RA, Dirks WG, Matsuo Y, Kaufmann M, Milch H, Drexler HG. Widespread intraspecies cross-contamination of human tumor cell lines arising at source. Int J Cancer. 1999;83:555–63. doi: 10.1002/(sici)1097-0215(19991112)83:4<555::aid-ijc19>3.0.co;2-2. [DOI] [PubMed] [Google Scholar]
- 3.Masters J. Re: false cell lines. Experimental Cell Res. 2002;272:216. doi: 10.1006/excr.2001.5439. [DOI] [PubMed] [Google Scholar]
- 4.Nelson-Rees WA, Flandermeyer RR, Hawthorne PK. Banded marker chromosomes as indicators of intraspecies cellular contamination. Science. 1974;184:1093–6. doi: 10.1126/science.184.4141.1093. [DOI] [PubMed] [Google Scholar]
- 5.Nelson-Rees WA, Zhdanov VM, Hawthorne PK, Flandermeyer RR. HeLa-like marker chromosomes and type-A variant glucose-6-phosphate dehydrogenase isoenzyme in human cell cultures producing Mason-Pfizer monkey virus-like particles. J Natl Cancer Inst. 1974;53:751–7. doi: 10.1093/jnci/53.3.751. [DOI] [PubMed] [Google Scholar]
- 6.Boyd MR, Paull KD. Some practical considerations and applications of the National Cancer Institute in vitro anticancer drug discovery screen. Drug Development Research. 1995;34:91–109. [Google Scholar]
- 7.Holbeck SL. Update on NCI in vitro drug screen utilities. Eur J Cancer. 2004;40:785–93. doi: 10.1016/j.ejca.2003.11.022. [DOI] [PubMed] [Google Scholar]
- 8.Shoemaker RH. The NCI60 human tumour cell line anticancer drug screen. Nat Rev Cancer. 2006;6:813–23. doi: 10.1038/nrc1951. [DOI] [PubMed] [Google Scholar]
- 9.Weinstein JN. Spotlight on molecular profiling: “Integromic” analysis of the NCI-60 cancer cell lines. Mol Cancer Ther. 2006;5:2601–5. doi: 10.1158/1535-7163.MCT-06-0640. [DOI] [PubMed] [Google Scholar]
- 10.Blower PE, Chung JH, Verducci JS, et al. MicroRNAs modulate the chemosensitivity of tumor cells. Mol Cancer Ther. 2008;7:1–9. doi: 10.1158/1535-7163.MCT-07-0573. [DOI] [PubMed] [Google Scholar]
- 11.Blower PE, Verducci JS, Lin S, et al. MicroRNA expression profiles for the NCI-60 cancer cell panel. Mol Cancer Ther. 2007;6:1483–91. doi: 10.1158/1535-7163.MCT-07-0009. [DOI] [PubMed] [Google Scholar]
- 12.Ikediobi ON, Davies H, Bignell G, et al. Mutation analysis of 24 known cancer genes in the NCI-60 cell line set. Mol Cancer Ther. 2006;5:2606–12. doi: 10.1158/1535-7163.MCT-06-0433. [DOI] [PMC free article] [PubMed] [Google Scholar]
- 13.Ikediobi ON, Reimers M, Durinck S, et al. In vitro differential sensitivity of melanomas to phenothiazines is based on the presence of codon 600 BRAF mutation. Mol Cancer Ther. 2008;7:1337–46. doi: 10.1158/1535-7163.MCT-07-2308. [DOI] [PMC free article] [PubMed] [Google Scholar]
- 14.Lorenzi PL, Llamas J, Gunsior M, et al. Asparagine synthetase is a predictive biomarker of L-asparaginase activity in ovarian cancer cell lines. Mol Cancer Ther. 2008 doi: 10.1158/1535-7163.MCT-08-0589. in press. [DOI] [PMC free article] [PubMed] [Google Scholar]
- 15.Lorenzi PL, Reinhold WC, Rudelius M, et al. Asparagine synthetase as a causal, predictive biomarker for L-asparaginase activity in ovarian cancer cells. Mol Cancer Ther. 2006;5:2613–23. doi: 10.1158/1535-7163.MCT-06-0447. [DOI] [PubMed] [Google Scholar]
- 16.Reinhold WC, Reimers MA, Maunakea AK, et al. Detailed DNA methylation profiles of the E-cadherin promoter in the NCI-60 cancer cells. Mol Cancer Ther. 2007;6:391–403. doi: 10.1158/1535-7163.MCT-06-0609. [DOI] [PubMed] [Google Scholar]
- 17.Shankavaram UT, Reinhold WC, Nishizuka S, et al. Transcript and protein expression profiles of the NCI-60 cancer cell panel: an integromic microarray study. Mol Cancer Ther. 2007;6:820–32. doi: 10.1158/1535-7163.MCT-06-0650. [DOI] [PubMed] [Google Scholar]
- 18.Stevens EV, Nishizuka S, Antony S, et al. Predicting cisplatin and trabectedin drug sensitivity in ovarian and colon cancers. Mol Cancer Ther. 2008;7:10–8. doi: 10.1158/1535-7163.MCT-07-0192. [DOI] [PubMed] [Google Scholar]
- 19.Roschke AV, Tonon G, Gehlhaus KS, et al. Karyotypic complexity of the NCI-60 drug-screening panel. Cancer Res. 2003;63:8634–47. [PubMed] [Google Scholar]
- 20.Bussey KJ, Chin K, Lababidi S, et al. Integrating data on DNA copy number with gene expression levels and drug sensitivities in the NCI-60 cell line panel. Mol Cancer Ther. 2006;5:853–67. doi: 10.1158/1535-7163.MCT-05-0155. [DOI] [PMC free article] [PubMed] [Google Scholar]
- 21.Ross DT, Scherf U, Eisen MB, et al. Systematic variation in gene expression patterns in human cancer cell lines. Nat Genet. 2000;24:227–35. doi: 10.1038/73432. [DOI] [PubMed] [Google Scholar]
- 22.Scherf U, Ross DT, Waltham M, et al. A gene expression database for the molecular pharmacology of cancer. Nat Genet. 2000;24:236–44. doi: 10.1038/73439. [DOI] [PubMed] [Google Scholar]
- 23.Garraway LA, Widlund HR, Rubin MA, et al. Integrative genomic analyses identify MITF as a lineage survival oncogene amplified in malignant melanoma. Nature. 2005;436:117–22. doi: 10.1038/nature03664. [DOI] [PubMed] [Google Scholar]
- 24.Jeffreys AJ, Wilson V, Thein SL. Individual-specific ‘fingerprints’ of human DNA. Nature. 1985;316:76–9. doi: 10.1038/316076a0. [DOI] [PubMed] [Google Scholar]
- 25.Butler JM. Genetics and genomics of core short tandem repeat loci used in human identity testing. J Forensic Sci. 2006;51:253–65. doi: 10.1111/j.1556-4029.2006.00046.x. [DOI] [PubMed] [Google Scholar]
- 26.Oldroyd NJ, Urquhart AJ, Kimpton CP, et al. A highly discriminating octoplex short tandem repeat polymerase chain reaction system suitable for human individual identification. Electrophoresis. 1995;16:334–7. doi: 10.1002/elps.1150160155. [DOI] [PubMed] [Google Scholar]
- 27.Masters JR, Thomson JA, Daly-Burns B, et al. Short tandem repeat profiling provides an international reference standard for human cell lines. Proc Natl Acad Sci U S A. 2001;98:8012–7. doi: 10.1073/pnas.121616198. [DOI] [PMC free article] [PubMed] [Google Scholar]
- 28.Stinson SF, Alley MC, Kopp WC, et al. Morphological and immunocytochemical characteristics of human tumor cell lines for use in a disease-oriented anticancer drug screen. Anticancer Res. 1992;12:1035–53. [PubMed] [Google Scholar]
- 29.Urasaki Y, Laco GS, Pourquier P, et al. Characterization of a novel topoisomerase I mutation from a camptothecin-resistant human prostate cancer cell line. Cancer Res. 2001;61:1964–9. [PubMed] [Google Scholar]
- 30.Santos FR, Pandya A, Tyler-Smith C. Reliability of DNA-based sex tests. Nat Genet. 1998;18:103. doi: 10.1038/ng0298-103. [DOI] [PubMed] [Google Scholar]
- 31.Yuan ZQ, Sun M, Feldman RI, et al. Frequent activation of AKT2 and induction of apoptosis by inhibition of phosphoinositide-3-OH kinase/Akt pathway in human ovarian cancer. Oncogene. 2000;19:2324–30. doi: 10.1038/sj.onc.1203598. [DOI] [PubMed] [Google Scholar]
Associated Data
This section collects any data citations, data availability statements, or supplementary materials included in this article.