

Abstract
BACKGROUND
There is increased interest in combining nutritional modalities with pharmacological therapies for managing patients with diarrhea-predominant IBS (IBS-D).
AIM
A randomized, double-blind, placebo-controlled study to evaluate the impact of oral serum-derived bovine immunoglobulin/protein isolate (SBI) on gastrointestinal symptom scores and quality of life (QoL) in subjects with IBS-D.
METHODS
Study subjects previously diagnosed with IBS-D according to ROME II criteria were recruited from London, Ontario, Canada and assigned to receive 5 g/day SBI, 10 g/day SBI, or placebo for 6 weeks. Daily symptom frequency and severity scores and a modified IBS-36 questionnaire assessed the impact of nutritional intervention. Laboratory assessments were performed at screening and end of treatment (EOT) to evaluate safety. Within-group comparisons of changes in number of days per week with symptoms and symptom severity were conducted on the per-protocol population of subjects using a t-test.
RESULTS
Subjects who received SBI at 10 g/day (N = 15) had statistically significant within-group reductions in abdominal pain (p < 0.01), loose stools (p < 0.01), bloating (p < 0.05), flatulence (p < 0.01), urgency (p < 0.05) and any symptom (p < 0.01) at EOT vs. baseline. Subjects receiving 5 g/day of SBI (N = 15) realized statistically significant within-group reductions in days with flatulence (p < 0.035), incomplete evacuation (p < 0.05), and any symptom (p < 0.01). There were no significant changes in QoL scores or in hematology or clinical chemistry among treatment groups.
CONCLUSIONS
This pilot study showed that nutritional therapy with either 10 g/day or 5 g/day of SBI in 30 patients was well tolerated and resulted in statistically significant within group improvements in both symptom days and in daily symptom scores in subjects with IBS-D. Additional studies are underway with larger numbers of subjects to validate these findings.
Keywords: irritable bowel syndrome, bovine serum immunoglobulin, diarrhea-predominant
Introduction
Irritable bowel syndrome (IBS) is a chronic relapsing and remitting gastrointestinal (GI) disorder characterized by recurrent abdominal pain or discomfort associated with altered bowel habits with a negative endoscopic examination. Symptoms may include abnormal stool form or frequency, defecation straining, bloating, urgency, feelings of incomplete bowel movement, and passing mucus.1 IBS is categorized according to predominant bowel habit and stool form: constipation-predominant (IBS-C), diarrhea-predominant (IBS-D), and mixed IBS (IBS-M), individuals with both constipation and diarrhea. Population-based studies indicate that the prevalence of symptoms consistent with IBS worldwide is approximately 10% to 20%.1–4 IBS is the most commonly diagnosed GI condition that negatively impacts a patient’s quality of life and generates a significant economic burden due to direct health-care costs and impaired work productivity.5,6
Standardized diagnosis of IBS has relied primarily on symptom-based criteria, in part because of the absence of reliable biomarkers that would improve the ability to diagnose and categorize individuals with clinical manifestations of the disorder. The innate complexity and heterogeneity of IBS is further exacerbated by the range of subgroups diagnosed with the disorder; subgroups include post-infectious, inflammatory, food intolerance, food allergy, non-celiac gluten sensitivity, bile acid malabsorption, and psychological distress.7 While the understanding of the pathogenesis of IBS is still incomplete, a variety of factors have been implicated such as genetic susceptibility, infections and other environmental exposures, deficiencies in tight junction proteins, intestinal abnormalities with bile acid metabolism, changes in GI motility, visceral hypersensitivity, dysregulation of the interaction between the central and enteric nervous system (brain-gut axis), and psychosocial factors.8 Recent studies have highlighted the potential role of low grade inflammation often in association with alterations in the microbiota composition or metabolism, which may cause changes in the epithelial mucosa leading to increased permeability and subsequent malabsorption of water, electrolytes, and nutrients.8–12 This increase in GI permeability may also increase antigenic exposure with additional immune activation leading to further inflammation and gastrointestinal symptoms.9,12–15
Historically, medical management of IBS has been based on patient symptoms. Recent developments in the understanding of the complex interactions between the gut, immune system, and nervous system have increased interest in multi-modal therapeutic approaches aimed at restoring epithelial barrier function and inhibiting intestinal immune activation which could be beneficial in IBS. A number of clinical and non-clinical studies suggest a potential role for serum-derived bovine immunoglobulin/protein isolate (SBI) administered alongside traditional medications through nutritional support of the gastrointestinal mucosal barrier.16–18 The combination of a nutritional agent and pharmaceutical therapy may lead to better long-term maintenance of chronic enteropathies like IBS. Non-clinical and clinical studies have demonstrated that orally-administered plasma proteins containing high levels of immunoglobulins provide distinct nutritional support for epithelial barrier function, including reduced gut barrier permeability and increased nutrient absorption to help restore a proper homeostasis to the gut.19–23 In nonclinical studies, oral administration of plasma proteins also decreases mucosal cytokines in intestinal inflammation and alters immune activation.18,23
The objective of this randomized, double-blind, placebo-controlled, preliminary study was to evaluate the impact of SBI on GI symptom scores in subjects with IBS-D. The research hypothesis explored was that daily consumption of SBI by patients with IBS-D would decrease the frequency and severity of GI-related symptoms and improve their quality of life.
Material and Methods
Study design
This randomized, double-blind, placebo-controlled study enrolled subjects previously diagnosed with IBS-D to receive placebo (soy protein) or SBI at either 5 g/day or 10 g/day for 6 weeks following a 1 week screening phase (Fig. 1). The study was conducted at a single site in London, Ontario, Canada in accordance with ICH Guidelines on Good Clinical Practice and the ethical principles of the Declaration of Helsinki. The study protocol and materials were approved by Institutional Review Board Services (Aurora, Ontario, Canada).
Figure 1.
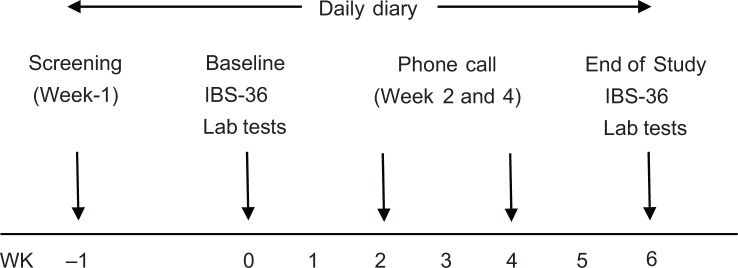
Study design.
Study patients
Eligible study participants were adults between the ages of 18 and 65 years who had received a diagnosis of IBS-D at least 6 months prior to enrollment into the study and continued to experience symptoms according to the ROME II diagnostic criteria for IBS24 (particularly increased stool frequency). Exclusion criteria included constipation-predominant IBS (according to the definition in the ROME II criteria),24 a history of any serious GI, hepatic, renal, cardiovascular, neurological or hematological disorder, history of drug or alcohol abuse, history of psychiatric disorders, or history of allergy to study-related products. All patients provided written informed consent before study-related procedures were initiated.
Nutritional therapy
Following the one week screening period, subjects were randomly assigned to 1 of 3 treatment groups: placebo (10 g/day soy protein isolate), SBI 5 g/day + 5 g/day placebo, or SBI 10 g/day. Subjects in the SBI 5 g/day group received soy protein isolate at 5 g/day in addition to SBI 5 g/day to ensure that participants in all 3 groups received equivalent amounts of protein. SBI was provided as a protein powder (>90% w/w) composed of over 50% immunoglobulin (IgG) along with other serum proteins similar to those found in colostrum and milk. SBI also contains trace amounts of sunflower lecithin but does not contain lactose, casein, whey, gluten or soy protein. Experimental products were provided by Entera Health, Inc., (Cary, NC) in matched capsules containing either 500 mg soy protein isolate, 250 mg SBI + 250 mg soy protein isolate, or 500 mg SBI. Patients were instructed to take 5 capsules, 4 times per day for 6-weeks. Criteria for removal of patients from the study included adverse event, clinical judgment of physician, personal reasons, or protocol violation
Efficacy and safety data
Subjects recorded gastrointestinal symptoms using a daily diary assessing the presence and severity of symptoms on a scale of 0 to 3 (0 = none; 1 = mild; 2 = moderate; 3 = severe). The symptom diary captured the following 10 symptoms: abdominal pain, loose stools, bloating, flatulence, hard stools, straining, incomplete evacuation, mucus, urgency, and nausea. The primary endpoint for the study was change in number of days per week with symptoms from week 2 of treatment to week 6 (end of treatment; EOT), based on an assumption that at least 3 weeks of SBI treatment would be required before benefits could be observed. Subjects also completed an IBS-36 questionnaire at the clinic on Day 0 (Baseline) and Week 6 (EOT) visits.25 The IBS-36 questionnaire was modified as a recall over the past 6 weeks. Hematology and clinical chemistry measurements, including glucose, bilirubin, total protein, uric acid, creatinine, SGOT, SGPT, and electrolytes, were conducted at screening and Week 6 to assess safety.
Statistical analysis
All efficacy and safety analyses were performed on a per-protocol (PP) population, which included all subjects who completed the study and were compliant with the visit schedule. Safety analysis was performed on the modified intent-to-treat (ITT) population, which included all patients who were randomized and provided any post-baseline data.
Daily symptom diaries were used to calculate the number of days per week with symptoms and the mean daily score for each symptom for each 1-week period during the study for each subject; mean scores were based on the number of days with available data. For calculation of the mean daily score, where symptom scores were missing for some parameters but present for others on a given day, the missing data were assumed to be “none” and was assigned a value of “0”. Where data were missing for all symptoms on a given day, the data were treated as missing and excluded from the calculations.
IBS-36 total scores were calculated as the sum of scores of all questions.25 Eight domains were analyzed within the IBS-36: food-related; symptoms; family relations; emotional impact; work, school, and activities of daily living; social impact; sleep/fatigue; and sexual relations. The study was not sufficiently powered for statistical comparison between groups and therefore results are treated as exploratory.
Within-group comparisons of baseline characteristics, change from baseline in symptom scores and number of days per week with symptoms, were made using a t-test. SAS version 9.1 was used to conduct the statistical analysis. Probability values P < 0.05 are considered statistically significant.
Results
Disposition
A total of 66 subjects diagnosed with IBS-D were enrolled in the study and underwent randomization: 25 in the 10 g/day SBI group, 19 in the 5 g/day SBI group, and 22 in the placebo group (Fig. 2). All patients who underwent randomization took at least one dose of assigned investigational product.
Figure 2.

Subject disposition.
Fifty-one subjects completed the 1-week screening period and 6-week study. Of those who withdrew prematurely from the study, 5 were lost to follow-up, 1 due to lack of efficacy, 2 at the Principal Investigator’s discretion, 4 due to adverse events (AEs), and 3 due to noncompliance. The proportion of subjects who withdrew was not significantly different between treatment groups. All of the subjects who withdrew due to an AE withdrew due to nausea: 2 subjects in the 10 g/day SBI group, 1 subject in the 5 g/day SBI group, and 1 subject in the placebo group.
Analysis of the modified ITT population included 17 subjects in the 10 g/day SBI group, 18 subjects in the 5 g/day SBI group, and 16 subjects in the placebo group. Forty-five subjects completed the study per protocol and were included in the PP analysis set: 15 subjects in the 10 g/day SBI group, 16 subjects in the 5 g/day SBI group, and 14 subjects in the placebo group.
Demographics and baseline characteristics
The baseline characteristics were similar across therapy groups (Table 1). The majority of the subjects in the PP analysis set were female (SBI 10 g/day group, 66.7%; SBI 5 g/day group, 50.0%; placebo group, 71.4%).
Table 1.
Demographics and baseline characteristics (per protocol population).
| CHARACTERISTIC | 10 g/day SBI (N = 15) |
5 g/day SBI (N = 16) |
PLACEBO (N = 14) |
|---|---|---|---|
| Sex | |||
| Female (n, %) | 10 (66.7) | 8 (50.0) | 10 (71.4) |
| Male (n, %) | 5 (33.3) | 8 (50.0) | 4 (28.6) |
| Age, Mean ± SD (years) | 49.1 ± 10.5 | 44.9 ± 8.7 | 47.8 ± 10.4 |
| Weight, Mean ± SD (kg) | 77.9 ± 18.8 | 86.6 ± 24.9 | 79.0 ± 10.9 |
| BMI, Mean ± SD (kg/m2) | 27.9 ± 4.8 | 29.0 ± 9.2 | 29.7 ± 5.0 |
Abbreviations: BMI, body mass index; kg, kilogram; m2, meters squared; n, number of subjects with characteristic; N, number of subjects in analysis population; SD, standard deviation.
Daily symptom scores
While the study was not powered to determine between-group differences for daily symptom scores, the within-group analyses showed significant improvements in the 5 g/day and 10 g/day SBI groups as compared to results seen with the placebo group which showed no improvement (Table 2). The 10 g/day SBI group had fewer days with any symptom (P < 0.01), abdominal pain (P < 0.01), loose stools (P = 0.01), bloating (P < 0.05), flatulence (P < 0.01), and urgency (P = 0.05) at EOT vs. Baseline. The 5 g/day SBI group exhibited fewer days with flatulence (P = 0.035), incomplete evacuation (P < 0.05), and any symptom (P = 0.010) at EOT vs. Baseline. There were no statistically significant differences observed within the placebo group with respect to the change in number of days where any of the GI symptoms were experienced from Baseline to EOT.
Table 2.
Mean number of days with symptoms and mean change in number of days with symptoms from week 2 to week 6 (per protocol analysis set).
| SYMPTOM | NUMBER OF DAYS (MEAN ± SD) | ||
|---|---|---|---|
| 10 g/day SBI (N = 15) |
5 g/day SBI (N = 15)* |
PLACEBO (N = 13)* |
|
| Any symptom | |||
| Week 2 | 7.00 ± 0.00 | 7.00 ± 0.00 | 7.00 ± 0.00 |
| Week 6 | 5.40 ± 2.03 | 5.64 ± 1.78 | 6.33 ± 2.02 |
| Change | −1.60 ± 2.03 | −1.36 ± 1.78 | −0.67 ± 2.02 |
| Within-group difference (p-value) | P = .009 | P = .014 | P = .276 |
| Nausea | |||
| Week 2 | 2.33 ± 2.58 | 1.67 ± 2.38 | 2.08 ± 2.60 |
| Week 6 | 1.67 ± 1.91 | 1.43 ± 2.71 | 1.75 ± 2.26 |
| Change | −0.67 ± 1.63 | −0.29 ± 1.14 | −0.42 ± 1.88 |
| Within-group difference (p-value) | P = .136 | P = .365 | P = .459 |
| Abdominal pain | |||
| Week 2 | 5.33 ± 1.72 | 4.40 ± 2.38 | 4.15 ± 2.91 |
| Week 6 | 3.33 ± 2.41 | 4.21 ± 2.49 | 3.58 ± 3.03 |
| Change | −2.00 ± 2.51 | −0.36 ± 1.86 | −0.92 ± 2.35 |
| Within-group difference (p-value) | P = .008 | P = .486 | P = .204 |
| Flatulence | |||
| Week 2 | 6.60 ± 0.74 | 4.93 ± 2.58 | 5.31 ± 2.81 |
| Week 6 | 4.27 ± 2.40 | 3.43 ± 2.98 | 5.00 ± 2.76 |
| Change | −2.33 ± 2.47 | −1.43 ± 2.28 | −0.17 ± 1.27 |
| Within-group difference (p-value) | P = .003 | P = .035 | P = .658 |
| Bloating | |||
| Week 2 | 4.40 ± 2.29 | 3.00 ± 3.12 | 4.62 ± 3.20 |
| Week 6 | 3.13 ± 2.80 | 2.64 ± 2.95 | 4.00 ± 3.22 |
| Change | −1.27 ± 2.22 | −0.14 ± 2.66 | −0.42 ± 2.50 |
| Within-group difference (p-value) | P = .044 | P = .844 | P = .576 |
| Hard stool | |||
| Week 2 | 1.60 ± 2.23 | 2.33 ± 2.77 | 3.38 ± 2.75 |
| Week 6 | 1.93 ± 2.43 | 2.00 ± 2.60 | 4.17 ± 3.21 |
| Change | 0.33 ± 3.52 | −0.50 ± 1.79 | 0.83 ± 2.37 |
| Within-group difference (p-value) | P = .719 | P = .314 | P = .248 |
| Loose stool | |||
| Week 2 | 5.27 ± 1.94 | 5.53 ± 2.33 | 4.08 ± 3.01 |
| Week 6 | 3.20 ± 2.48 | 4.64 ± 2.50 | 4.42 ± 3.20 |
| Change | −2.07 ± 2.71 | −0.79 ± 2.33 | 0.17 ± 3.16 |
| Within-group difference (p-value) | P = .011 | P = .229 | P = .858 |
| Urgency | |||
| Week 2 | 4.73 ± 2.69 | 3.33 ± 2.74 | 4.31 ± 2.93 |
| Week 6 | 3.27 ± 2.49 | 3.71 ± 3.07 | 4.42 ± 2.78 |
| Change | −1.47 ± 2.64 | 0.36 ± 1.98 | −0.25 ± 2.45 |
| Within-group difference (p-value) | P = .050 | P = .513 | P = .731 |
| Straining | |||
| Week 2 | 2.27 ± 2.71 | 3.00 ± 2.73 | 3.15 ± 2.91 |
| Week 6 | 2.53 ± 2.72 | 3.00 ± 3.28 | 3.50 ± 3.23 |
| Change | 0.27 ± 1.94 | −0.14 ± 2.18 | 0.08 ± 0.79 |
| Within-group difference (p-value) | P = .604 | P = .810 | P = .723 |
| Incomplete evacuation | |||
| Week 2 | 2.33 ± 2.47 | 3.20 ± 2.70 | 2.92 ± 3.04 |
| Week 6 | 1.87 ± 2.72 | 2.29 ± 2.70 | 3.25 ± 3.22 |
| Change | −0.47 ± 2.07 | −1.07 ± 1.64 | 0.08 ± 1.00 |
| Within-group difference (p-value) | P = .396 | P = .029 | P = .777 |
| Mucus | |||
| Week 2 | 1.20 ± 1.86 | 2.33 ± 2.94 | 1.54 ± 2.11 |
| Week 6 | 1.40 ± 2.29 | 1.79 ± 2.75 | 1.75 ± 2.09 |
| Change | 0.20 ± 1.15 | −0.71 ± 1.38 | 0.08 ± 1.16 |
| Within-group difference (p-value) | P = .510 | P = .075 | P = .809 |
Two subjects, 1 each in the 5 g/day SBI and placebo groups, did not return their daily symptom diaries and were excluded from this analysis.
Subjects in the SBI groups tended to show improvement in symptom severity scores from Week 2 to Week 6 for loose stools, hard stools, flatulence, nausea, urgency, straining and incomplete evacuation than subjects in the placebo group (Table 3). However, no statistically significant differences were observed between SBI groups and placebo with respect to severity score for any symptom.
Table 3.
Mean daily symptom severity scores and mean change in mean daily symptom severity scores from week 2 to week 6 (per protocol analysis set).
| DAILY SYMPTOM | MEAN SCORES* (MEAN ± SD) | |||
|---|---|---|---|---|
| 10 g/day SBI (N = 15) |
5 g/day SBI (N = 15)† |
PLACEBO (N = 13)† |
P VALUE | |
| Nausea | ||||
| Week 2 | 0.50 ± 0.61 | 0.31 ± 0.47 | 0.38 ± 0.50 | 0.617 |
| Week 4 | 0.43 ± 0.62 | 0.25 ± 0.35 | 0.35 ± 0.60 | 0.653 |
| Week 6 | 0.37 ± 0.41 | 0.40 ± 0.66 | 0.31 ± 0.45 | 0.912 |
| Difference from Wk 2 to Wk 6 | −0.13 ± 0.42 | 0.09 ± 0.33 | −0.10 ± 0.39 | 0.262 |
| Within-group difference (p-value) | 0.234 | 0.324 | 0.418 | |
| Abdominal pain | ||||
| Week 2 | 1.08 ± 0.57 | 0.93 ± 0.57 | 0.96 ± 0.79 | 0.812 |
| Week 4 | 0.85 ± 0.78 | 1.10 ± 0.55 | 0.74 ± 0.65 | 0.352 |
| Week 6 | 0.81 ± 0.65 | 1.32 ± 0.74 | 0.76 ± 0.71 | 0.082 |
| Difference from Wk 2 to Wk 6 | −0.26 ± 0.60 | 0.35 ± 0.67 | −0.27 ± 0.74 | 0.027 |
| Within-group difference (p-value) | 0.115 | 0.070 | 0.228 | |
| Flatulence | ||||
| Week 2 | 1.60 ± 0.68 | 1.15 ± 0.69 | 1.14 ± 0.74 | 0.146 |
| Week 4 | 1.37 ± 0.80 | 1.33 ± 0.94 | 1.15 ± 0.68 | 0.762 |
| Week 6 | 1.10 ± 0.79 | 1.11 ± 1.01 | 1.13 ± 0.71 | 0.996 |
| Difference from Wk 2 to Week 6 | −0.50 ± 0.78 | −0.01 ± 0.79 | −0.01 ± 0.37 | 0.109 |
| Within-group difference (p-value) | 0.027 | 0.966 | 0.913 | |
| Bloating | ||||
| Week 2 | 1.08 ± 0.98 | 0.83 ± 1.02 | 1.05 ± 0.91 | 0.748 |
| Week 4 | 1.05 ± 0.93 | 0.97 ± 0.93 | 0.90 ± 0.58 | 0.899 |
| Week 6 | 0.95 ± 0.96 | 0.88 ± 1.03 | 0.85 ± 0.80 | 0.962 |
| Difference from Wk 2 to Wk 6 | −0.13 ± 0.50 | 0.15 ± 0.85 | −0.21 ± 0.94 | 0.448 |
| Within-group difference (p-value) | 0.339 | 0.510 | 0.457 | |
| Hard stool | ||||
| Week 2 | 0.30 ± 0.40 | 0.42 ± 0.54 | 0.80 ± 0.72 | 0.059 |
| Week 4 | 0.36 ± 0.50 | 0.46 ± 0.52 | 0.75 ± 0.70 | 0.199 |
| Week 6 | 0.55 ± 0.70 | 0.40 ± 0.54 | 0.92 ± 0.83 | 0.162 |
| Difference from Wk 2 to Wk 6 | 0.25 ± 0.75 | −0.05 ± 0.39 | 0.10 ± 0.45 | 0.359 |
| Within-group difference (p-value) | 0.215 | 0.618 | 0.482 | |
| Loose stool | ||||
| Week 2 | 1.19 ± 0.66 | 1.45 ± 0.91 | 1.10 ± 0.92 | 0.515 |
| Week 4 | 1.00 ± 0.79 | 1.52 ± 0.96 | 0.96 ± 0.71 | 0.137 |
| Week 6 | 0.89 ± 0.80 | 1.51 ± 0.94 | 1.07 ± 0.82 | 0.151 |
| Difference from Wk 2 to Wk 6 | −0.30 ± 0.78 | 0.10 ± 0.61 | −0.10 ± 0.86 | 0.383 |
| Within-group difference (p-value) | 0.164 | 0.566 | 0.709 | |
| Urgency | ||||
| Week 2 | 1.11 ± 0.74 | 0.71 ± 0.61 | 1.00 ± 0.76 | 0.290 |
| Week 4 | 1.01 ± 0.72 | 1.14 ± 1.00 | 1.01 ± 0.70 | 0.881 |
| Week 6 | 0.87 ± 0.75 | 1.12 ± 1.02 | 0.93 ± 0.71 | 0.717 |
| Difference from Wk 2 to Wk 6 | −0.24 ± 0.88 | 0.41 ± 0.69 | −0.15 ± 0.56 | 0.051 |
| Within-group difference (p-value) | 0.303 | 0.045 | 0.379 | |
| Straining | ||||
| Week 2 | 0.60 ± 0.83 | 0.63 ± 0.71 | 0.77 ± 0.84 | 0.838 |
| Week 4 | 0.62 ± 0.95 | 0.73 ± 0.69 | 0.78 ± 0.79 | 0.864 |
| Week 6 | 0.70 ± 0.83 | 0.65 ± 0.76 | 0.85 ± 0.91 | 0.830 |
| Difference from Wk 2 to Wk 6 | 0.10 ± 0.49 | −0.01 ± 0.51 | 0.01 ± 0.27 | 0.775 |
| Within-group difference (p-value) | 0.441 | 0.930 | 0.881 | |
| Incomplete evacuation | ||||
| Week 2 | 0.66 ± 0.89 | 0.73 ± 0.76 | 0.70 ± 0.83 | 0.968 |
| Week 4 | 0.52 ± 0.83 | 0.75 ± 0.66 | 0.59 ± 0.68 | 0.686 |
| Week 6 | 0.49 ± 0.75 | 0.58 ± 0.83 | 0.68 ± 0.78 | 0.818 |
| Difference from Wk 2 to Wk 6 | −0.17 ± 0.55 | −0.17 ± 0.45 | −0.08 ± 0.38 | 0.860 |
| Within-group difference (p-value) | 0.251 | 0.169 | 0.461 | |
| Mucus | ||||
| Week 2 | 0.18 ± 0.28 | 0.46 ± 0.62 | 0.30 ± 0.48 | 0.295 |
| Week 4 | 0.28 ± 0.47 | 0.54 ± 0.80 | 0.35 ± 0.48 | 0.476 |
| Week 6 | 0.25 ± 0.38 | 0.42 ± 0.83 | 0.40 ± 0.64 | 0.749 |
| Difference from Wk 2 to Wk 6 | 0.07 ± 0.24 | −0.07 ± 0.42 | 0.08 ± 0.25 | 0.371 |
| Within-group difference (p-value) | 0.258 | 0.538 | 0.281 | |
Mean scores from data collected in 2-week period based on severity scale of 0 = none; 1 = mild; 2 = moderate; 3 = severe.
Two subjects, 1 each in the 5 g/day SBI and placebo groups, did not return their daily symptom diaries and were excluded from this analysis.
IBS-36 scores
At baseline, mean total scores for the IBS-36 were comparable for each of the groups and not significantly different at EOT (Table 4). Review of the total IBS-36 scores showed that female subjects in the SBI groups had a greater improvement in symptom scores compared to males (Table 5).
Table 4.
Total and domain scores for IBS-36 questionnaire (per protocol analysis set).
| SCORE (MEAN ± SD) | |||
|---|---|---|---|
| 10 g/day SBI (N = 15) |
5 g/day SBI (N = 16)* |
PLACEBO (N = 14)* |
|
| IBS total score (Range 0–216) | |||
| Baseline (Day 0) | 126.38 ± 39.75 | 115.25 ± 31.08 | 132.06 ± 47.86 |
| Week 6 | 79.04 ± 45.34 | 92.14 ± 39.78 | 76.00 ± 45.92 |
| Food related domain (Range 0–12) | |||
| Baseline (Day 0) | 6.87 ± 1.88 | 5.70 ± 1.25 | 5.79 ± 1.89 |
| Week 6 | 6.33 ± 1.84 | 6.10 ± 2.47 | 6.00 ± 2.65 |
| Symptoms domain (Range 0–48) | |||
| Baseline (Day 0) | 33.88 ± 8.56 | 29.00 ± 8.21 | 33.61 ± 8.70 |
| Week 6 | 21.11 ± 9.62 | 23.86 ± 8.00 | 20.92 ± 10.69 |
| Family relations domain (Range 0–12) | |||
| Baseline (Day 0) | 5.16 ± 3.42 | 6.22 ± 2.93 | 6.32 ± 4.34 |
| Week 6 | 3.17 ± 2.46 | 3.33 ± 2.65 | 3.50 ± 3.69 |
| Emotional impact domain (Range 0–42) | |||
| Baseline (Day 0) | 23.59 ± 10.05 | 24.16 ± 6.61 | 25.15 ± 10.20 |
| Week 6 | 16.05 ± 11.62 | 19.31 ± 9.74 | 12.81 ± 8.00 |
| Work/school/activities of daily living domain (Range 0–36) | |||
| Baseline (Day 0) | 21.00 ± 10.82 | 18.14 ± 6.93 | 23.46 ± 10.25 |
| Week 6 | 11.29 ± 10.92 | 15.65 ± 10.42 | 11.46 ± 9.36 |
| Social impact domain (Range 0–42) | |||
| Baseline (Day 0) | 23.68 ± 9.88 | 22.62 ± 7.55 | 26.25 ± 10.90 |
| Week 6 | 13.74 ± 10.78 | 15.70 ± 9.35 | 15.71 ± 11.12 |
| Sleep/fatigue domain (Range 0–12) | |||
| Baseline (Day 0) | 6.41 ± 4.54 | 4.29 ± 3.35 | 6.72 ± 4.30 |
| Week 6 | 4.00 ± 4.47 | 5.35 ± 4.12 | 2.90 ± 3.38 |
| Sexual relations domain (Range 0–12) | |||
| Baseline (Day 0) | 5.40 ± 3.77 | 4.33 ± 2.71 | 3.91 ± 3.48 |
| Week 6 | 3.23 ± 3.94 | 2.90 ± 3.53 | 2.00 ± 2.75 |
Two subjects, 1 each in the 5 g/day SBI and placebo groups, did not complete the week 6 IBS-36 questionnaire.
Table 5.
Total scores and change from baseline in total scores by sex (per protocol analysis set).
| IBS TOTAL SCORE (RANGE 0–216) | ||||||
|---|---|---|---|---|---|---|
| 10 g/day SBI (N = 15) |
5 g/day SBI (N = 16)* |
PLACEBO (N = 14)* |
||||
| FEMALE (N = 10) |
MALE (N = 5) |
FEMALE (N = 8) |
MALE (N = 8) |
FEMALE (N = 10) |
MALE (N = 4) |
|
| Baseline (Day 0) |
138.59 ± 36.10 | 101.97 ± 38.48 | 122.10 ± 37.09 | 108.40 ± 24.22 | 141.40 ± 51.71 | 108.71 ± 29.82 |
| Week 6 | 83.88 ± 51.73 | 69.35 ± 31.58 | 86.00 ± 29.09 | 97.51 ± 48.67 | 77.69 ± 47.34 | 70.35 ± 50.04 |
| Change from Baseline | −54.71 ± 38.12 | −32.62 ± 53.84 | −36.40 ± 56.78 | −10.89 ± 47.64 | −63.71 ± 42.26 | −33.59 ± 29.70 |
Two subjects, 1 each in the 5 g/day SBI and placebo groups, did not complete the week 6 IBS-36 questionnaire.
Safety
The safety profile of SBI was similar to that of placebo. At the end of the study the placebo group had significant increase in blood glucose while the SBI 10 g/day and SBI 5 g/day groups remained at baseline levels. In the SBI 10 g/day group there was a significant increase (p = 0.019) in Mean Corpuscular Hemoglobin (MCH) between baseline and EOT; despite this increase the value was still within the normal range. A significant increase (p = 0.04) in lymphocytes was also observed in this group at week 6 compared to week 0, but the values were still lower than the other two groups (Table 6).
Table 6.
Clinical chemistry and hematology parameters (per-protocol analysis set).
| PARAMETER (NORMAL RANGE) |
SBI 10 g/day (N = 15) |
SBI 5 g/day (N = 16) |
PLACEBO (N = 14) |
|||
|---|---|---|---|---|---|---|
| WEEK 0 | WEEK 6 | WEEK 0 | WEEK 6 | WEEK 0 | WEEK 6 | |
| Glucose (3.3–5.8 mmol/L) | 5.99 (3.21) | 6.02 (2.61) | 5.27 (1.51) | 5.29 (1.58) | 5.14 (1.14) | 6.81 (2.75) |
| Creatinine (70–120 μmol/L males) 50–90 μmol/L females) | 70.0 (14.4) | 70.8 (13.7) | 74.3 (12.1) | 76.4 (16.0) | 68.3 (14.3) | 72.0 (17.2) |
| Protein (60–80 g/L) | 71.3 (3.7) | 70.7 (4.0) | 70.5 (3.4) | 70.0 (3.3) | 71.8 (5.6) | 71.0 (4.4) |
| Bilirubin (<26 μmol/L) | 7.60 (2.87) | 7.60 (3.92) | 7.53 (2.94) | 8.18 (2.32) | 7.69 (3.45) | 6.77 (2.05) |
| Urate (180–420 μmol/L) | 309.8 (119.4) | 322.3 (146.7) | 312.6 (76.5) | 309.1 (62.0) | 287.9 (79.6) | 297.5 (85.2) |
| Sodium (135–145 mmol/L) | 140.5 (3.5) | 140.1 (3.4) | 141.1 (1.3) | 140.8 (2.1) | 141.1 (2.3) | 140.6 (2.6) |
| Potassium (3.5–5.0 mmol/L) | 4.43 (0.53) | 4.26 (0.39) | 4.32 (0.41) | 4.45 (0.63) | 4.21 (0.44) | 4.21 (0.35) |
| Choride (98–106 mmol/L) | 103.1 (2.6) | 102.7 (2.9) | 103.6 (1.5) | 102.6 (2.1) | 104.6 (2.4) | 103.8 (2.2) |
| Aspartate amino-transferase (0–35 U/L) | 22.1 (5.2) | 20.5 (4.0) | 20.4 (4.9) | 20.7 (4.7) | 19.9 (4.1) | 20.4 (6.8) |
| Alanine aminotransferase (0–35 U/L) | 22.7 (8.7) | 20.6 (7.1) | 21.2 (10.7) | 19.9 (10.2) | 22.0 (8.1) | 23.9 (14.1) |
| Hemoglobin (140–174 g/L males) (123–157 g/L females) |
141.4 (12.8) | 141.5 (14.1) | 145.4 (17.4) | 147.6 (12.6) | 141.5 (10.2) | 140.9 (7.9) |
| Hematocrit (0.420–0.520 males) (0.370–0.460 females) |
0.42 (0.04) | 0.44 (0.09) | 0.41 (0.06) | 0.43 (0.04) | 0.41 (0.01) | 0.42 (0.02) |
| Red blood cells (4.4–5.7 × 10¹²/L males) (4.0–5.2 × 10¹²/L females) |
4.52 (0.50) | 4.54 (0.59) | 4.59 (0.56) | 4.65 (0.45) | 4.54 (0.51) | 4.52 (0.44) |
| Mean corpuscular volume (80–100 fL) | 92.5 (6.0) | 92.1 (5.9) | 92.5 (3.9) | 93.5 (3.9) | 92.8 (5.4) | 91.5 (4.6) |
| Mean corpuscular hemoglobin (27–34 pg) | 31.4 (2.0) | 31.6 (2.2)* | 31.6 (1.5) | 31.8 (1.5) | 31.4 (2.0) | 31.2 (2.0) |
| Mean corpuscular hemoglobin concentrate (310–370 g/L) | 340.1 (8.1) | 342.5 (6.9) | 341.2 (9.3) | 340.7 (5.3) | 337.1 (7.2) | 340.3 (7.7) |
| Red cell distribution width (11.5–14.5%) | 13.6 (0.6) | 13.0 (0.6) | 13.7 (0.7) | 13.1 (0.6) | 13.6 (1.1) | 13.4 (0.6) |
| White blood cells (4.0–10.0 × 10⁹/L) | 6.19 (1.59) | 6.36 (2.03) | 5.62 (1.98) | 7.38 (3.07) | 8.01 (1.38) | 8.1 (1.5) |
| Platelets (130–400 × 109/L) | 230.3 (44.2) | 251.3 (57.1) | 247.8 (64.8) | 254.6 (54.7) | 249.6 (76.1) | 250.4 (72.6) |
| Neutrophils (2–7 × 10⁹/L) | 3.89 (1.61) | 3.9 (1.4) | 3.31 (1.51) | 4.70 (2.48) | 4.21 (0.72) | 5.16 (1.39) |
| Lymphocytes (1.5–3.4 × 10⁹/L) | 1.70 (0.57) | 1.82 (0.66)* | 1.74 (0.64) | 1.92 (0.61) | 2.72 (0.56) | 2.22 (0.71) |
| Monocytes (0.14–0.86 × 10⁹/L) | 0.43 (0.09) | 0.50 (0.24) | 0.44 (0.20) | 0.57 (0.25) | 0.43 (0.13) | 0.52 (0.15) |
| Eosinophils (<0.45 × 10⁹/L) | 0.13 (0.06) | 0.12 (0.10) | 0.09 (0.07) | 0.18 (0.14) | 0.22 (0.12) | 0.21 (0.11) |
| Basophils (<0.1 × 10⁹/L) | 0.04 (0.05) | 0.03 (0.04) | 0.04 (0.02) | 0.05 (0.05) | 0.02 (0.04) | 0.02 (0.04) |
p < .05 for t-test comparison of change from week 0 to 6.
A total of four subjects withdrew from the study due to adverse events attributed to nausea: 1 subject in the placebo group, 2 subjects in the SBI 10 g/day group, and 1 subject in SBI 5 g/day group. No SBI-related changes in adverse events were reported. No serious adverse events were reported in the study.
Discussion
This randomized, double-blind, placebo-controlled pilot study demonstrated that nutritional therapy with SBI for 6 weeks led to improvements in the frequency and severity of symptoms in subjects with diarrhea-predominant IBS. Patients experienced fewer days with loose stools, abdominal pain, bloating, flatulence, and defecation urgency, with benefits tending to be greater for the SBI 10 g/day group compared to the SBI 5 g/day group. Mean total scores for the IBS-36 were comparable for each of the groups and not significantly different at EOT. The statistically significant improvement in the number of days with loose stools is consistent with previous observations in patients with HIV-associated enteropathy who received SBI.16,19
IBS is one of the most common GI disorders seen in clinical practice. The pathophysiological mechanisms involved, however, are still not entirely clear. A complex combination of biological and psychosocial factors appears to contribute to the condition which may involve environmental factors (infections, diet, etc.), dysfunction in GI motility, intestinal inflammation, stress, or genetic predisposition.8,9 Recent studies have also focused on dysregulation of brain–gut axis, alterations of small bowel and colonic microflora, as well as altered serotonin metabolism and degradation of tryptophan through the kynurenine pathway as emerging factors in the pathogenesis of IBS.26,27 While management of patients with IBS has traditionally been symptom-based, recent developments in understanding of the complex interactions between GI barrier function, the immune system, and the enteric nervous system have increased interest in multimodal therapeutic approaches for managing IBS based on different causes of symptoms experienced by patients.
In our study we found that IBS patients who ingested 10 g/day SBI for 6 weeks reported a significant decrease in the number of days with abdominal pain, flatulence, bloating, urgency, loose stools and total days with symptoms, from week two to end of study, while control patients ingesting an equivalent amount of soy protein showed no improvement. In addition, subjects reported improved symptom scores for loose stools, flatulence, urgency, nausea, hard stools and incomplete evacuation, suggesting an improvement in the quality of life of the subjects compared to the placebo group. These findings are consistent with results from another trial evaluating SBI in patients with HIV-associated enteropathy, where eight weeks of SBI administration led to a decrease in bowel movements/day from 5.8 to 2.0 (p = 0.008) and a decrease in stool consistency scores (1-formed to 6-watery) from 5.3 to 3.0 (p = 0.008).16 Patients in this study also completed GI symptom questionnaires [assessed cramping, urgency, incontinence, and nocturnal diarrhea] which showed a decrease in GI symptom scores from 17 to 8.0 (p = 0.008) over the 8 week treatment period. Additional findings in the HIV-enteropathy study showed that SBI was well-tolerated in the eight study subjects and five of the subjects remained on therapy for 48 weeks after a 4 week washout period, demonstrating excellent tolerance and continued management of their condition.
There is a developing body of evidence indicating that intermittent or even relatively minor inflammation can lead to changes in intestinal structure and function in IBS.28 Under normal conditions, tight junctions in the intestinal epithelium provide an effective barrier that prevents microbial translocation and paracellular transport of luminal antigens.29 In diseased states, however, the tight junction barrier can be defective allowing bacterial translocation or antigenic penetration into underlying intestinal tissues that can lead to increased production and secretion of pro-inflammatory cytokines, including TNF-a, IFN-g, and interleukins.29,30 Increased cytokine production can promote an increase in enteric epithelial tight junction permeability by degrading the structural tight junction protein occludin,31 leading to additional antigenic penetration of the gut barrier which contributes further to the symptoms associated with enteropathy.
A state of heightened immune activation that underlies a condition of ongoing low-grade inflammation may be present in IBS, particularly in post-infectious IBS where inflammation may persist for months after the initial resolution of infection.32–34 Though controversial, even patients diagnosed with IBS not associated with an infectious agent appear to experience low grade inflammation which results in histological changes, decreased barrier function and increased permeability.10,12,35 In addition, other studies have found a higher intestinal permeability correlating with a lower number of tight junction proteins in the intestinal epithelial of IBS patients compared to healthy controls.9,36,37
SBI protein isolates may work to decrease symptoms in IBS patients by discouraging inflammation, strengthening gut barrier function, or possibly both. Nonclinical studies have documented that consumption of plasma proteins containing the SBI protein composition aids growth in weaned pigs and prevents expression of various pro-inflammatory cytokines, including TNF-α, IFN-γ and several interleukins (e.g., IL-1β, IL-6, IL-8, IL-17), in a number of different animal models.23,38–42 Other research studies have shown benefits for plasma proteins in recovering intestinal barrier function following intestinal infection23,43 or exposure to enterotoxins,44 and provided evidence that plasma proteins can ameliorate intestinal barrier dysfunction, mucosal inflammation, and diarrhea in weaned pigs.18,45 Reductions in gut permeability may prevent the passage of microbial and food antigens to the interstitial space, thereby blocking local inflammation.44 Immunofluorescence analysis of transmembrane proteins found claudin-1, an integral membrane protein and a component of mucosal epithelium tight junction strands, was more highly expressed in the ileum and colon from pigs experiencing weaning-related stress and fed plasma proteins containing the SBI protein composition relative to controls.18 Pérez-Bosque et al found that rats challenged with Staphylococcus aureus enterotoxin B had reduced expression of ZO-1 and β-catenin tight junction proteins, increasing the permeability of the intestinal epithelium.44 Inclusion of plasma proteins in the diet blocked these effects. In the study by Asmuth et al,16 patients with HIV-associated enteropathy showed increases in CD4+ counts, reduced levels of intestinal fatty acid binding protein (I-FABP), a protein associated with enterocyte damage, decreased ratios of matrix metalloproteinase-9 to tissue inhibitor of metalloproteinase (MMP-9/TIMP-1), and decreases in monocyte chemoattractant protein-1 (MCP-1) following long term consumption of SBI. Collectively, these findings indicate that SBI may improve symptoms associated with various enteropathic conditions by providing nutritional support or key nutrients or immunoglobulins needed to suppress inflammation and improve mucosal barrier function. It is conceivable that specific immunoglobulins could play a protective role by binding LPS46 or other luminal proinflammatory substances.
It is also thought that the distinct nutritional composition of SBI contributed to the improvement in symptoms reported by IBS-D subjects in this study. For example, SBI may provide specific peptides, amino acids, or other nutrients that support restoration of gut barrier function and decrease permeability in the intestinal tract as well as maintain lean body mass. SBI contains high levels of glutamic acid which is converted to glutamine, a conditionally essential amino acid during catabolic states of injury and illness. Glutamine serves as a preferential energy source for rapidly proliferating immune cells and enterocytes, is a nontoxic transporter of ammonia, and has been linked with maintenance of gut barrier function and cell differentiation.47 In addition, plasma amino acid levels and specifically leucine levels were elevated one to two hours after SBI consumption.48 Similar to the results observed with plasma proteins or SBI, arginine-rich protein fractions have been shown to decrease small intestine permeability in vivo in lactulose uptake assays in rats.49,50
Additionally, the specially formulated composition of SBI may help by providing key nutrients for the intestinal microbiota that supports beneficial microbiome activity. Host factors that cause dysbiosis of the intestinal microbiota leading to alterations in the microbiome have been implicated in several chronic health disorders (e.g., metabolic diseases, IBS, autoimmune and allergic diseases, etc.).51–53 Fecal bacteria composition has been found to be significantly altered in patients with IBS compared to healthy controls.11,54,55 Researchers have speculated that such changes in the composition of the intestinal microbiota may cause changes in intestinal barrier function and inflammation in patients with IBS that contributes to disease manifestations.9,10,12 Pimentel et al has shown that alterations in dietary protein using a commercially available elemental diet can lead to significant improvements in bowel symptoms associated with normalization of lactulose breath test, suggesting a stabilization of GI microbiota.56 While changes in the intestinal microbiota were not evaluated in the present study, results from another study in patients with severe HIV-associated enteropathy showed decreases in pro-inflammatory and potentially pathogenic gamma proteobacteria and several other bacterial groups, which occurred concurrently with improvements in bowel function after consuming SBI for 6 weeks.19 Clostridium spp. decreased from 6.5% to 3.4% in the stool and correlated with duodenal CD4+/CD3+ density (r = −0.63; p < 0.01). Changes in gut microbiota also correlated with local lymphocyte populations that increased significantly with short-term SBI administration over a 6 week period. These results suggest that some component(s) in the SBI formulation may be normalizing gut bacteria in ways that benefit the intestinal mucosa.
Results from this pilot study suggest that adjunct nutritional therapy with SBI can help manage various symptoms associated with IBS-D. Clinical and nonclinical studies have documented that plasma proteins and SBI can decrease inflammation and improve intestinal barrier function caused by inflammation.18,23,43,44 Collectively, the results from this study and others suggests that SBI provides distinct nutrients in the form of a protein mixture containing immunoglobulins that accounts for management of various enteropathies compared to outcomes with other high quality protein sources. Additional studies will be undertaken to expand evaluation of SBI in patients with IBS and to further understand the mechanisms of action involved in improving symptoms associated with the disorder.
Acknowledgements
Bryon Petschow, PhD, took part in the editing of the manuscript.
Footnotes
FUNDING: This study was funded by Entera Health Inc (Cary, North Carolina, USA).
COMPETING INTERESTS: DW and ME declare no potential conflicts of interest. ALS, EW and GLK are employees of Entera Health, Inc.
Author Contributions
DW and EW conceived and directed the project. ME collected data and supervised the project. DW, ME, EW, ALS and GLK analyzed the data. ME and ALS wrote the manuscript. DW, EW and GLK edited the manuscript. GLK is guarantor of the article. All authors reviewed and approved of the final manuscript.
DISCLOSURES AND ETHICS
As a requirement of publication the authors have provided signed confirmation of their compliance with ethical and legal obligations including but not limited to compliance with ICMJE authorship and competing interests guidelines, that the article is neither under consideration for publication nor published elsewhere, of their compliance with legal and ethical guidelines concerning human and animal research participants (if applicable), and that permission has been obtained for reproduction of any copyrighted material. This article was subject to blind, independent, expert peer review. The reviewers reported no competing interests.
REFERENCES
- 1.Longstreth GF, Thompson WG, Chey WD, Houghton LA, Mearin F, Spiller RC. Functional bowel disorders. Gastroenterology. 2006;130(5):1480–1491. doi: 10.1053/j.gastro.2005.11.061. [DOI] [PubMed] [Google Scholar]
- 2.Saito YA, Schoenfeld P, Locke GR., 3rd The epidemiology of irritable bowel syndrome in North America: a systematic review. Am J Gastroenterol. 2002;97(8):1910–1915. doi: 10.1111/j.1572-0241.2002.05913.x. [DOI] [PubMed] [Google Scholar]
- 3.Andrews EB, Eaton SC, Hollis KA, et al. Prevalence and demographics of irritable bowel syndrome: results from a large web-based survey. Aliment Pharmacol Ther. 2005;22(10):935–942. doi: 10.1111/j.1365-2036.2005.02671.x. [DOI] [PubMed] [Google Scholar]
- 4.Gwee KA. Irritable bowel syndrome in developing countries—a disorder of civilization or colonization? Neurogastroenterol Motil. 2005;17(3):317–324. doi: 10.1111/j.1365-2982.2005.00627.x. [DOI] [PubMed] [Google Scholar]
- 5.Drossman DA, Li Z, Andruzzi E, et al. U.S. householder survey of functional gastrointestinal disorders. Prevalence, sociodemography, and health impact. Dig Dis Sci. 1993;38(9):1569–1580. doi: 10.1007/BF01303162. [DOI] [PubMed] [Google Scholar]
- 6.Drossman DA, Camilleri M, Mayer EA, Whitehead WE. AGA technical review on irritable bowel syndrome. Gastroenterology. 2002;123(6):2108–2131. doi: 10.1053/gast.2002.37095. [DOI] [PubMed] [Google Scholar]
- 7.Spiller R, Aziz Q, Creed F, et al. Guidelines on the irritable bowel syndrome: mechanisms and practical management. Gut. 2007;56(12):1770–1798. doi: 10.1136/gut.2007.119446. [DOI] [PMC free article] [PubMed] [Google Scholar]
- 8.Gasbarrini A, Lauritano EC, Garcovich M, Sparano L, Gasbarrini G. New insights into the pathophysiology of IBS: intestinal microflora, gas production and gut motility. Eur Rev Med Pharmacol Sci. 2008;12(Suppl 1):111–117. [PubMed] [Google Scholar]
- 9.Camilleri M, Lasch K, Zhou W. Irritable bowel syndrome: methods, mechanisms, and pathophysiology. The confluence of increased permeability, inflammation, and pain in irritable bowel syndrome. Am J Physiol Gastrointest Liver Physiol. 2012;303(7):G775–785. doi: 10.1152/ajpgi.00155.2012. [DOI] [PubMed] [Google Scholar]
- 10.Camilleri M. Peripheral mechanisms in irritable bowel syndrome. N Engl J Med. 2012;367(17):1626–1635. doi: 10.1056/NEJMra1207068. [DOI] [PubMed] [Google Scholar]
- 11.Simren M, Barbara G, Flint HJ, et al. Intestinal microbiota in functional bowel disorders: a Rome foundation report. Gut. 2013;62(1):159–176. doi: 10.1136/gutjnl-2012-302167. [DOI] [PMC free article] [PubMed] [Google Scholar]
- 12.Matricon J, Meleine M, Gelot A, et al. Review article: Associations between immune activation, intestinal permeability and the irritable bowel syndrome. Aliment Pharmacol Ther. 2012;36(11–12):1009–1031. doi: 10.1111/apt.12080. [DOI] [PubMed] [Google Scholar]
- 13.Barbara G, Zecchi L, Barbaro R, et al. Mucosal permeability and immune activation as potential therapeutic targets of probiotics in irritable bowel syndrome. J Clin Gastroenterol. 2012;46(Suppl):S52–55. doi: 10.1097/MCG.0b013e318264e918. [DOI] [PubMed] [Google Scholar]
- 14.Thabane M, Kottachchi DT, Marshall JK. Systematic review and meta-analysis: The incidence and prognosis of post-infectious irritable bowel syndrome. Aliment Pharmacol Ther. 2007;26(4):535–544. doi: 10.1111/j.1365-2036.2007.03399.x. [DOI] [PubMed] [Google Scholar]
- 15.Halvorson HA, Schlett CD, Riddle MS. Postinfectious irritable bowel syndrome—a meta-analysis. Am J Gastroenterol. 2006;101(8):1894–1899. doi: 10.1111/j.1572-0241.2006.00654.x. quiz 1942. [DOI] [PubMed] [Google Scholar]
- 16.Asmuth DM, Ma ZM, Albanese A, et al. Oral Serum-Derived Bovine Immunoglobulin Improves Duodenal Immune Reconstitution and Absorption Function in Patients with HIV Enteropathy. AIDS. 2013;27:2207–2217. doi: 10.1097/QAD.0b013e328362e54c. [DOI] [PMC free article] [PubMed] [Google Scholar]
- 17.Wilson D, Weaver EM, Klein GL, Shaw AL, Evans M, Cohn J. Efficacy of Serum-Derived Bovine Immunoglobulin Protein Isolate (SBI) in Patients with Diarrhea-Predominant Irritable Bowel Syndrome (IBS-D) Digestive Disease Week. 2013 May 18; doi: 10.4137/CGast.S13200. [DOI] [PMC free article] [PubMed] [Google Scholar]
- 18.Peace RM, Campbell J, Polo J, Crenshaw J, Russell L, Moeser A. Spray-dried porcine plasma influences intestinal barrier function, inflammation, and diarrhea in weaned pigs. J Nutr. 2011;141(7):1312–1317. doi: 10.3945/jn.110.136796. [DOI] [PubMed] [Google Scholar]
- 19.Asmuth DM, Stombaugh J, Ma ZM. Changes in stool microbiota, bacterial translocation and mucosal immunity after oral serum-derived bovine immunoglobulin (SBI) administration; 20th Conference on Retroviruses and Opportunistic Infections; 2013 Mar 3; Atlanta, GA. 2013. [Google Scholar]
- 20.Lembcke JL, Peerson JM, Brown KH. Acceptability, safety, and digestibility of spray-dried bovine serum added to diets of recovering malnourished children. J Pediatr Gastroenterol Nutr. 1997;25(4):381–384. doi: 10.1097/00005176-199710000-00003. [DOI] [PubMed] [Google Scholar]
- 21.Jiang R, Chang X, Stoll B, et al. Dietary plasma protein is used more efficiently than extruded soy protein for lean tissue growth in early-weaned pigs. J Nutr. 2000;130(8):2016–2019. doi: 10.1093/jn/130.8.2016. [DOI] [PubMed] [Google Scholar]
- 22.Jiang R, Chang X, Stoll B, et al. Dietary plasma protein reduces small intestinal growth and lamina propria cell density in early weaned pigs. J Nutr. 2000;130(1):21–26. doi: 10.1093/jn/130.1.21. [DOI] [PubMed] [Google Scholar]
- 23.Bosi P, Casini L, Finamore A, et al. Spray-dried plasma improves growth performance and reduces inflammatory status of weaned pigs challenged with enterotoxigenic Escherichia coli K88. J Anim Sci. 2004;82(6):1764–1772. doi: 10.2527/2004.8261764x. [DOI] [PubMed] [Google Scholar]
- 24.Thompson WG, Longstreth GF, Drossman DA, Heaton KW, Irvine EJ, Muller-Lissner SA. Functional bowel disorders and functional abdominal pain. Gut. 1999;45(Suppl 2):II43–47. doi: 10.1136/gut.45.2008.ii43. [DOI] [PMC free article] [PubMed] [Google Scholar]
- 25.Groll D, Vanner SJ, Depew WT, et al. The IBS-36: a new quality of life measure for irritable bowel syndrome. Am J Gastroenterol. 2002;97(4):962–971. doi: 10.1111/j.1572-0241.2002.05616.x. [DOI] [PubMed] [Google Scholar]
- 26.Clarke G, Fitzgerald P, Cryan JF, Cassidy EM, Quigley EM, Dinan TG. Tryptophan degradation in irritable bowel syndrome: evidence of indoleamine 2,3-dioxygenase activation in a male cohort. BMC Gastroenterol. 2009;9:6. doi: 10.1186/1471-230X-9-6. [DOI] [PMC free article] [PubMed] [Google Scholar]
- 27.Keszthelyi D, Troost FJ, Masclee AA. Understanding the role of tryptophan and serotonin metabolism in gastrointestinal function. Neurogastroenterol Motil. 2009;21(12):1239–1249. doi: 10.1111/j.1365-2982.2009.01370.x. [DOI] [PubMed] [Google Scholar]
- 28.Peuhkuri K, Vapaatalo H, Korpela R. Even low-grade inflammation impacts on small intestinal function. World J Gastroenterol. 2010;16(9):1057–1062. doi: 10.3748/wjg.v16.i9.1057. [DOI] [PMC free article] [PubMed] [Google Scholar]
- 29.Al-Sadi R, Boivin M, Ma T. Mechanism of cytokine modulation of epithelial tight junction barrier. Front Biosci. 2009;14:2765–2778. doi: 10.2741/3413. [DOI] [PMC free article] [PubMed] [Google Scholar]
- 30.Martin GR, Wallace JL. Gastrointestinal inflammation: a central component of mucosal defense and repair. Exp Biol Med (Maywood) 2006;231(2):130–137. doi: 10.1177/153537020623100202. [DOI] [PubMed] [Google Scholar]
- 31.Cummins PM. Occludin: one protein, many forms. Mol Cell Biol. 2012;32(2):242–250. doi: 10.1128/MCB.06029-11. [DOI] [PMC free article] [PubMed] [Google Scholar]
- 32.Spiller R, Garsed K. Infection, inflammation, and the irritable bowel syndrome. Dig Liver Dis. 2009;41(12):844–849. doi: 10.1016/j.dld.2009.07.007. [DOI] [PubMed] [Google Scholar]
- 33.Spiller RC. Role of infection in irritable bowel syndrome. J Gastroenterol. 2007;42(Suppl 17):41–47. doi: 10.1007/s00535-006-1925-8. [DOI] [PubMed] [Google Scholar]
- 34.Barbara G, Cremon C, Carini G, et al. The immune system in irritable bowel syndrome. J Neurogastroenterol Motil. 2011;17(4):349–359. doi: 10.5056/jnm.2011.17.4.349. [DOI] [PMC free article] [PubMed] [Google Scholar]
- 35.Ohman L, Simren M. Pathogenesis of IBS: role of inflammation, immunity and neuroimmune interactions. Nature Reviews Gastroenterology & Hepatology. 2010;7(3):163–173. doi: 10.1038/nrgastro.2010.4. [DOI] [PubMed] [Google Scholar]
- 36.Martinez C, Vicario M, Ramos L, et al. The jejunum of diarrhea-predominant irritable bowel syndrome shows molecular alterations in the tight junction signaling pathway that are associated with mucosal pathobiology and clinical manifestations. Am J Gastroenterol. 2012;107(5):736–746. doi: 10.1038/ajg.2011.472. [DOI] [PubMed] [Google Scholar]
- 37.Martinez C, Lobo B, Pigrau M, et al. Diarrhoea-predominant irritable bowel syndrome: an organic disorder with structural abnormalities in the jejunal epithelial barrier. Gut. 2013;62(8):1160–1168. doi: 10.1136/gutjnl-2012-302093. [DOI] [PubMed] [Google Scholar]
- 38.Perez-Bosque A, Miro L, Polo J, et al. Dietary plasma proteins modulate the immune response of diffuse gut-associated lymphoid tissue in rats challenged with Staphylococcus aureus enterotoxin B. J Nutr. 2008;138(3):533–537. doi: 10.1093/jn/138.3.533. [DOI] [PubMed] [Google Scholar]
- 39.Perez-Bosque A, Miro L, Polo J, et al. Dietary plasma protein supplements prevent the release of mucosal proinflammatory mediators in intestinal inflammation in rats. J Nutr. 2010;140(1):25–30. doi: 10.3945/jn.109.112466. [DOI] [PubMed] [Google Scholar]
- 40.Moretó M, Lluïsa MM, Polo J, et al. Dietary supplementation with porcine plasma proteins reduce lymphocyte recruitment and cytokine and chemokine expression in a mouse model of spontaneous colitis. Gastroenterology. 2010 [Google Scholar]
- 41.Jiang H, Becker C, Przybyszewski J, MacDonald RS. Dietary immunoglobulins affect colon cytokines in mouse model of inflammatory bowel disease. FASEB J. 2010;24(720):1. [Google Scholar]
- 42.Maijo M, Miro L, Polo J, et al. Dietary plasma proteins attenuate the innate immunity response in a mouse model of acute lung injury. Br J Nutr. 2012;107(6):867–875. doi: 10.1017/S0007114511003655. [DOI] [PubMed] [Google Scholar]
- 43.Corl BA, Harrell RJ, Moon HK, et al. Effect of animal plasma proteins on intestinal damage and recovery of neonatal pigs infected with rotavirus. The Journal of Nutritional Biochemistry. 2007;18(12):778–784. doi: 10.1016/j.jnutbio.2006.12.011. [DOI] [PubMed] [Google Scholar]
- 44.Perez-Bosque A, Amat C, Polo J, et al. Spray-dried animal plasma prevents the effects of Staphylococcus aureus enterotoxin B on intestinal barrier function in weaned rats. J Nutr. 2006;136(11):2838–2843. doi: 10.1093/jn/136.11.2838. [DOI] [PubMed] [Google Scholar]
- 45.Nofrarias M, Manzanilla E, Pujols J, et al. Effects of spray-dried porcine plasma and plant extracts on intestinal morphology and on leukocyte cell subsets of weaned pigs. J Anim Sci. 2006;84(10):2735–2742. doi: 10.2527/jas.2005-414. [DOI] [PubMed] [Google Scholar]
- 46.Weaver EM, GL K, DeVries BK, et al. Endotoxin neutralization activity (ENA) of bovine plasma and bovine Immunoglobulin (IgG)-rich fractions as compared to human plasma. FASEB J. 2013;27(1079):58. [Google Scholar]
- 47.Jian ZM, Cao JD, Zhu XG, et al. The impact of alanyl-glutamine on clinical safety, nitrogen balance, intestinal permeability, and clinical outcome in postoperative patients: a randomized, double-blind, controlled study of 120 patients. JPEN J Parenter Enteral Nutr. 1999;23(5 Suppl):S62–66. doi: 10.1177/014860719902300516. [DOI] [PubMed] [Google Scholar]
- 48.Hanning RM, Drew M. Bovine Immunoglobulin Feeding Trial. (data on file)
- 49.Shi X, Gisolfi CV. Paracellular transport of water and carbohydrates during intestinal perfusion of protamine in the rat. Am J Med Sci. 1996;311(3):107–112. doi: 10.1097/00000441-199603000-00001. [DOI] [PubMed] [Google Scholar]
- 50.Visser JT, Lammers K, Hoogendijk A, et al. Restoration of impaired intestinal barrier function by the hydrolysed casein diet contributes to the prevention of type 1 diabetes in the diabetes-prone BioBreeding rat. Diabetologia. 2010;53(12):2621–2628. doi: 10.1007/s00125-010-1903-9. [DOI] [PMC free article] [PubMed] [Google Scholar]
- 51.Cho I, Blaser MJ. The human microbiome: at the interface of health and disease. Nature Reviews Genetics. 2012;13(4):260–270. doi: 10.1038/nrg3182. [DOI] [PMC free article] [PubMed] [Google Scholar]
- 52.Romano-Keeler J, Weitkamp JH, Moore DJ. Regulatory properties of the intestinal microbiome effecting the development and treatment of diabetes. Curr Opin Endocrinol Diabetes Obes. 2012;19(2):73–80. doi: 10.1097/MED.0b013e3283514d43. [DOI] [PMC free article] [PubMed] [Google Scholar]
- 53.Lozupone CA, Stombaugh JI, Gordon JI, Jansson JK, Knight R. Diversity, stability and resilience of the human gut microbiota. Nature. 2012;489(7415):220–230. doi: 10.1038/nature11550. [DOI] [PMC free article] [PubMed] [Google Scholar]
- 54.Kassinen A, Krogius-Kurikka L, Makivuokko H, et al. The fecal microbiota of irritable bowel syndrome patients differs significantly from that of healthy subjects. Gastroenterology. 2007;133(1):24–33. doi: 10.1053/j.gastro.2007.04.005. [DOI] [PubMed] [Google Scholar]
- 55.Saulnier DM, Riehle K, Mistretta TA, et al. Gastrointestinal microbiome signatures of pediatric patients with irritable bowel syndrome. Gastroenterology. 2011;141(5):1782–1791. doi: 10.1053/j.gastro.2011.06.072. [DOI] [PMC free article] [PubMed] [Google Scholar]
- 56.Pimentel M, Constantino T, Kong Y, Bajwa M, Rezaei A, Park S. A 14-day elemental diet is highly effective in normalizing the lactulose breath test. Dig Dis Sci. 2004;49(1):73–77. doi: 10.1023/b:ddas.0000011605.43979.e1. [DOI] [PubMed] [Google Scholar]