

Abstract
OBJECTIVE
The purpose of this article is to investigate the imaging characteristics of pathologically proven thymic hyperplasia and to identify features that can differentiate true hyperplasia from lymphoid hyperplasia.
MATERIALS AND METHODS
Thirty-one patients (nine men and 22 women; age range, 20–68 years) with pathologically confirmed thymic hyperplasia (18 true and 13 lymphoid) who underwent preoperative CT (n = 27), PET/CT (n = 5), or MRI (n = 6) were studied. The length and thickness of each thymic lobe and the transverse and anterior-posterior diameters and attenuation of the thymus were measured on CT. Thymic morphologic features and heterogeneity on CT and chemical shift on MRI were evaluated. Maximum standardized uptake values were measured on PET. Imaging features between true and lymphoid hyperplasia were compared.
RESULTS
No significant differences were observed between true and lymphoid hyperplasia in terms of thymic length, thickness, diameters, morphologic features, and other qualitative features (p > 0.16). The length, thickness, and diameters of thymic hyperplasia were significantly larger than the mean values of normal glands in the corresponding age group (p < 0.001). CT attenuation of lymphoid hyperplasia was significantly higher than that of true hyperplasia among 15 patients with contrast-enhanced CT (median, 47.9 vs 31.4 HU; Wilcoxon p = 0.03). The receiver operating characteristic analysis yielded greater than 41.2 HU as the optimal threshold for differentiating lymphoid hyperplasia from true hyperplasia, with 83% sensitivity and 89% specificity. A decrease of signal intensity on opposed-phase images was present in all four cases with in- and opposed-phase imaging. The mean maximum standardized uptake value was 2.66.
CONCLUSION
CT attenuation of the thymus was significantly higher in lymphoid hyperplasia than in true hyperplasia, with an optimal threshold of greater than 41.2 HU in this cohort of patients with pathologically confirmed thymic hyperplasia.
Keywords: CT, CT attenuation, lymphoid hyperplasia, thymic hyperplasia, thymus
Reaching its maximum weight at puberty and subsequently undergoing involution, the thymus rarely catches attention on imaging studies of healthy adults [1, 2]. However, a variety of pathologic conditions can involve the gland, which then presents challenges to radiologists who aim to provide accurate diagnosis and aid patient management [3, 4]. Imaging characteristics of neoplastic processes of the thymus, especially thymic epithelial tumors, have been well studied and reported in cohorts of patients with pathologically proven disease [2, 5–11]. However, the imaging features of nonneoplastic conditions such as thymic hyperplasia have not been systematically studied in a cohort of patients with pathologically confirmed diagnoses.
Thymic hyperplasia consists of two sub-types, true hyperplasia and lymphoid hyperplasia (also known as follicular hyperplasia or lymphofollicular hyperplasia), which are clearly distinguished by pathologic analysis. True thymic hyperplasia indicates an enlarged thymus gland with an increase in normally organized thymus tissue, determined by weight and volume, beyond the upper limit of normal for that particular age [1]. True hyperplasia occurs in a patient who is recovering from recent stress, including anticancer chemotherapy, corticosteroid therapy, radiotherapy, or thermal burns [1, 2, 12, 13]. In response to these stressors, the thymus gland first becomes atrophic and then grows back when the stress is removed; the thymus sometimes continues to grow and become larger than its original size, which is referred to as “rebound hyperplasia” [2, 12]. Lymphoid hyperplasia, on the other hand, is characterized by the presence of an increased number of lymphoid follicles and germinal centers in the thymus [1]. In lymphoid hyperplasia, the thymus gland is not always enlarged, can be atrophic, or can be involved with a neoplasm [1, 2]. Lymphoid hyperplasia is associated with a variety of immunologically mediated diseases, most commonly myasthenia gravis. Thymectomy is often performed in patients with myasthenia gravis because of the improvement of myasthenic symptoms after thymectomy [8, 14, 15]. Despite the distinct pathologic and clinical features of two types of thymic hyperplasia, it has been considered to be difficult to distinguish true from lymphoid hyperplasia on the basis of imaging findings [13].
Although several prior studies described imaging findings of thymic hyperplasia on CT and MRI, those studies mostly based their patient selection on the clinical and radiologic criteria without requiring pathologic confirmation of the diagnosis of thymic hyperplasia [16–18]. Although those studies provided important information of thymic appearance associated with certain clinical conditions, they may not have fully characterized the spectrum of imaging findings of pathologically confirmed cases of thymic hyperplasia. Furthermore, the comparison of imaging characteristics of true hyperplasia from lymphoid hyperplasia has not been systematically performed. Although it is generally thought that it is difficult to distinguish true from lymphoid hyperplasia on imaging, a systematic investigation of qualitative and quantitative imaging findings in patients with pathologically confirmed thymic hyperplasia may identify some characteristics that can differentiate the two subtypes, especially given the distinct clinical and pathologic features associated with the two subtypes of hyperplasia.
Therefore, the purpose of the current study is to investigate the imaging characteristics of pathologically proven cases of thymic hyperplasia and to identify features that can help differentiate true hyperplasia from lymphoid hyperplasia.
Materials and Methods
Patients
In this institutional review board–approved study, the pathology patient database was reviewed to identify patients who underwent thymectomy and had a pathologic diagnosis of thymic hyperplasia confirmed by review at the Department of Pathology at our institution between 2001 and 2012. Forty-seven consecutive patients with pathologically proven thymic hyperplasia were identified. Of these, 31 patients had cross-sectional imaging studies of the chest before thymectomy using CT, MRI, and 18F-FDG PET/CT available for review in our system. The remaining 16 patients had no preoperative cross-sectional imaging available for review and were therefore excluded from this radiologic study. Therefore, the patient population of the current study included 31 patients (nine men and 22 women; age range, 20–68 years; median age, 37 years) with pathologically confirmed thymic hyperplasia who underwent CT, FDG PET/CT, or MRI before thymectomy available for review. CT studies were available for 27 patients, FDG PET/CT images were available for five patients, and MRI studies were available for six patients. Seven patients underwent imaging with more than one modality (two patients with CT and MRI, two patients with CT and PET/CT, two patients with PET/CT and MRI, and one patient with all three modalities). The imaging studies and clinical information of these patients were retrospectively reviewed.
Clinical and Pathologic Information
The medical records were reviewed for the patient demographics, indication for thymectomy, and the presence or absence of medical conditions associated with thymic hyperplasia, including myasthenia gravis [19, 20], thyroid disease [16], other autoimmune diseases, prior use of steroids, and history of carcinoma [21]. Pathologic records were reviewed to identify patients with true thymic hyperplasia and those with lymphoid hyperplasia. Pathologically, true hyperplasia is defined as enlargement of the thymus gland, as determined by weight and volume, beyond the upper limit of normal for that particular age [1]. Lymphoid hyperplasia refers to the presence of an increased number of lymphoid follicles, which may or may not be associated with enlargement of the thymus [1].
Qualitative and Quantitative Assessments of Imaging Characteristics
The qualitative features of the thymus on chest CT studies were evaluated by a consensus reading of two board-certified experienced radiologists with expertise in thoracic imaging who were aware that patients had pathologically confirmed thymic hyperplasia; however, the readers were blinded to the subtypes of hyperplasia (true vs lymphoid hyperplasia). The thymus was evaluated in terms of morphologic features (pyramidal with convex margin, pyramidal with straight margin, pyramidal with concave margin, round or oval, irregular, and indistinguishable from normal mediastinal fat tissue), heterogeneity (homogeneous or heterogeneous), fat content (present or absent), and other features, including calcification and nodular component within the thymic hyperplasia (present or absent). Quantitative measurements of the thymus were performed by a board-certified radiologist, who measured transverse and anteroposterior diameters of the gland, the length and thickness of the right and left lobes, and the attenuation of the thymus on CT images. The diameters, length, and thickness were measured according to the definitions published in prior studies of thymic measurements [16, 22, 23], as shown in Figure 1, using a caliper-type measurement tool on the PACS workstation (Centricity, GE Healthcare). The CT attenuation was measured using an oval region of interest covering the maximum area of thymus gland excluding the surrounding fat. All images were reviewed on a PACS, using a mediastinal window setting (level, 50 HU; width, 350 HU). In two patients who underwent PET/CT but not chest CT, the CT images from PET/CT studies were reviewed for the consensus assessment and measurements. Therefore, this part of the study was performed with a total of 29 patients, among whom 18 patients underwent contrast-enhanced CT and 11 patients underwent unenhanced CT (including the two patients with CT images from PET/CT).
Fig. 1.

Technique for thymic size measurements including length, thickness, and transverse and anteroposterior diameters.
For the six patients with MRI studies, signal intensity and heterogeneity on T1-weighted and T2-weighted images were visually evaluated by a consensus review. The presence or absence of the decrease in signal intensity of the thymus gland on the opposed-phase image relative to that on the in-phase image was also visually evaluated.
For the five patients who underwent FDG PET/CT, the maximum standardized uptake value (SUVmax) of the thymus was measured by an experienced nuclear medicine imaging scientist.
Statistical Analysis
Differences in imaging characteristics between the groups with true hyperplasia and lymphoid hyperplasia were compared using Fisher exact tests for categoric data and the Wilcoxon rank sum test for continuous data. The length, thickness, and diameters of the thymus measured on CT were compared with the mean diameters of normal thymus according to age in each patient by Wilcoxon signed rank test, using the mean values described in previous reports [22, 23]. Receiver operating characteristic (ROC) analysis was used to determine the optimal threshold for CT attenuation to distinguish lymphoid hyperplasia from true hyperplasia, using the Youden index. All tests conducted were two sided at the 0.05 significance level.
Results
Clinical Characteristics of the Patients
Among the 31 patients, 18 patients had true hyperplasia and 13 patients had lymphoid hyperplasia. The clinical characteristics of the patients in two groups are summarized in Table 1. Ten patients had myasthenia gravis (32%), including seven patients in the lymphoid hyperplasia group and three patients in the true hyperplasia group. Three patients had nonneoplastic thyroid disease (two with Graves disease in the lymphoid hyperplasia group and one with hypothyroidism in the true hyperplasia group), and one patient with true hyperplasia had a history of papillary thyroid cancer and had undergone thyroidectomy 5 years ago. A history of steroid use was noted in six patients, including four in the true hyperplasia group and two in the lymphoid hyperplasia group. The indication for surgery was “mediastinal mass” for 17 patients, treatment of myasthenia gravis for 11 patients, symptomatic enlarged thymus for two patients (acute pericarditis in one and chest pain in the other), and completion of total thymectomy after thoracoscopic left thymic lobe resection for thymoma (type B1) 6 months ago for one patient, who had true hyperplasia with no residual thymoma on pathologic analysis.
TABLE 1.
Demographic and Medical Characteristics of 31 Patients Who Underwent Cross-Sectional Imaging Before Thymectomy
| Characteristic | Total (n = 31) | True Hyperplasia (n = 18) |
Lymphoid Hyperplasia (n = 13) |
P |
|---|---|---|---|---|
|
| ||||
| Age (y), median (range) | 37 (20–68) | 43 (25–68) | 35 (20–68) | 0.25 |
| Sex | 0.24 | |||
| Male | 9 | 7 | 2 | |
| Female | 22 | 11 | 11 | |
| Medical conditions associated with hyperplasia |
||||
| Myasthenia gravis | 10 | 3a | 7 | 0.05b |
| Thyroid disease | 4 | 2 | 2 | 1.00 |
| Prior steroid use | 6 | 4 | 2 | 1.00 |
Note—Except where noted otherwise, data are number of patients.
All three patients had a history of steroid use.
Statistically significant.
CT Characteristics
Table 2 summarizes the qualitative CT features in 29 patients with CT images, including 17 patients with true hyperplasia and 12 patients with lymphoid hyperplasia. The morphologic feature was pyramidal in 24 of 29 patients (83%), round in one (3%) patient, and indistinguishable from mediastinal fat in four (14%) patients (Table 2). Hyperplasia was heterogeneous with fat content in 22 patients (76%). Calcification was noted in two patients with lymphoid hyperplasia, and nodular component within the thymic hyperplasia was noted in three patients with true hyperplasia. None of the qualitative features was significantly different between the true hyperplasia group and the lymphoid hyperplasia group (p > 0.16). In four patients whose thymus was indistinguishable from mediastinal fat by morphologic assessment, the thymus was considered nonmeasurable and the diameters and CT attenuation were not obtained.
TABLE 2.
Qualitative CT Features of Thymic Hyperplasia
| Feature | Total (n = 29) |
True Hyperplasia (n = 17) |
Lymphoid Hyperplasia (n = 12) |
P |
|---|---|---|---|---|
|
| ||||
| Morphologic feature | 0.45 | |||
| Pyramidal with convex margin | 20 | 10 | 10 | |
| Pyramidal with straight margin | 1 | 1 | 0 | |
| Pyramidal with concave margin | 3 | 3 | 0 | |
| Round or oval | 1 | 1 | 0 | |
| Irregular | 0 | 0 | 0 | |
| Indistinguishable from mediastinal fat | 4 | 2 | 2 | |
| Heterogeneity | 0.66 | |||
| Homogeneous | 7 | 5 | 2 | |
| Heterogeneous | 22 | 12 | 10 | |
| Fat content | 0.66 | |||
| Absent | 7 | 5 | 2 | |
| Present | 22 | 12 | 10 | |
| Calcification | 0.16 | |||
| Absent | 27 | 17 | 10 | |
| Present | 2 | 0 | 2 | |
| Nodular component | 0.25 | |||
| Absent | 26 | 14 | 12 | |
| Present | 3 | 3 | 0 | |
Note—Except where noted otherwise, data are number of thymus glands.
The summary of the size measurements in 25 patients with measurable thymus on CT is described in Table 3. The transverse and anteroposterior diameters as well as the length and thickness of right and left lobes were not significantly different between the true hyperplasia group and the lymphoid hyperplasia group (p > 0.21). When the size measurements on CT were compared with the mean values of normal gland in the corresponding age group [22], the transverse and anteroposterior diameters as well as the right and left lobe length and thickness in patients with thymic hyperplasia were significantly larger than the mean normal values (p < 0.001 for all measurement in a total of 25 patients; p = 0.001 for all measurements in 15 patients with true hyperplasia; p = 0.004 for transverse diameter, and p = 0.002 for all the other measurements in 10 patients with lymphoid hyperplasia). When the measurements were compared with the upper 95% limit of normal gland measurements (obtained as the mean + 2 SDs), the lobe length and thickness of thymic hyperplasia were significantly larger in a total of 25 patients as well as in the true and lymphoid hyperplasia groups (p < 0.05), except for the right lobe length in the lymphoid hyperplasia group (p = 0.5). The transverse and anteroposterior diameters of thymic hyperplasia were not significantly larger than the upper 95% limit of the diameters of the normal thymus glands including all age groups (p > 0.07). The transverse and anteroposterior diameters of thymic hyperplasia in patients 50 years old or older were significantly larger than the upper 95% limit of the normal values (p = 0.001 and p = 0.001, respectively).
TABLE 3.
Size Measurements of Thymic Hyperplasia on CT
| Dimension | Total (n = 25) |
True Hyperplasia (n = 15) |
Lymphoid Hyperplasia (n= 10) |
P |
|---|---|---|---|---|
|
| ||||
| Transverse diameter (mm) | 0.68 | |||
| Median (first quartile, third quartile) | 46 (37, 49) | 46 (36, 48) | 45 (38, 52) | |
| Mean (SD) | 46 (11) | 46 (10) | 46 (13) | |
| Anteroposterior diameter (mm) | 0.21 | |||
| Median (first quartile, third quartile) | 36 (28, 55) | 36 (27, 49) | 45 (30, 71) | |
| Mean (SD) | 43 (18) | 39 (15) | 48(21) | |
| Right lobe length (mm) | 0.86 | |||
| Median (first quartile, third quartile) | 36 (27, 40) | 36 (27, 40) | 36 (27, 40) | |
| Mean (SD) | 35 (12) | 35 (12) | 36 (12) | |
| Right lobe thickness (mm) | 0.62 | |||
| Median (first quartile, third quartile) | 16 (13, 19) | 15 (13, 18) | 18 (11, 21) | |
| Mean (SD) | 16 (7) | 16 (5) | 17 (9) | |
| Left lobe length (mm) | 0.22 | |||
| Median (first quartile, third quartile) | 42 (37, 60) | 43 (36, 49) | 52 (37, 72) | |
| Mean (SD) | 48 (16) | 44 (13) | 55 (18) | |
| Left lobe thickness (mm) | 0.56 | |||
| Median (first quartile, third quartile) | 15 (11, 19) | 15 (10, 20) | 17 (13, 19) | |
| Mean (SD) | 16 (6) | 15 (5) | 17 (7) | |
Note—The measurements were performed excluding one patient with round shape of the thymus located in the left side of the anterior mediastinum, whose round thymus was considered to represent the left lobe.
The CT attenuation values in 15 patients with measurable thymus on contrast-enhanced CT are summarized in Table 4. The CT attenuation of lymphoid hyperplasia was significantly higher than that of true hyperplasia (median, 47.9 vs 31.4 HU; p = 0.03) (Fig. 2A). The threshold value of CT attenuation was explored by ROC curve analysis, which yielded greater than 41.2 HU as the optimal threshold for differentiating lymphoid hyperplasia from true hyperplasia, with 83% sensitivity and 89% specificity (Youden index score, 0.72) (Figs. 2B, 3, and 4). The thymic CT attenuation of 10 patients with unenhanced CT did not differ significantly between the true and lymphoid hyperplasia groups (median, 1.5 vs −1.6 HU; p = 1.00).
TABLE 4.
CT Attenuation of Thymic Hyperplasia on Contrast-Enhanced Chest CT
| Attenuation Measurement | Total(n = 16) | True Hyperplasia (n = 9) | Lymphoid Hyperplasia (n = 6) |
|---|---|---|---|
|
| |||
| Median (first quartile, third quartile)a | 40.4 (9.2, 48.5) | 31.4 (1.7, 40.6) | 47.9 (47.3, 54.6) |
| Mean (SD) | 33.3 (23.9) | 23.7 (24.8) | 47.6 (14.4) |
Note—Data are Hounsfield units.
p = 0.03.
Fig. 2.
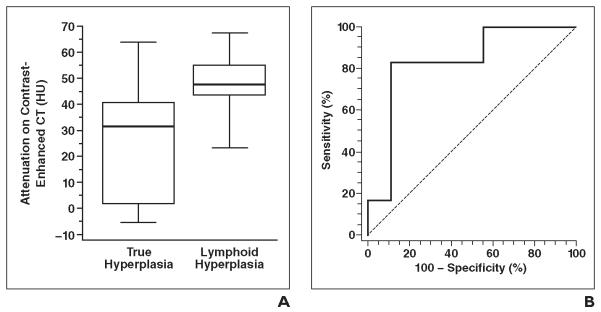
Thymic attenuation on CT in true hyperplasia and lymphoid hyperplasia.
A, Box-and-whisker plots represent CT attenuation of thymus in true and lymphoid hyperplasia. Box outlines represent values from lower to upper quartile (25th to 75th percentile), and horizontal line within each box represents median CT attenuation of each group. Vertical lines extend from minimum to maximum value. CT attenuation of lymphoid hyperplasia was significantly higher than that of true hyperplasia (p = 0.03).
B, Receiver operating characteristic curve analysis identified > 41.2 HU as optimal threshold for differentiating lymphoid hyperplasia from true hyperplasia, with 83% sensitivity and 89% specificity (Youden index score, 0.72).
Fig. 3.
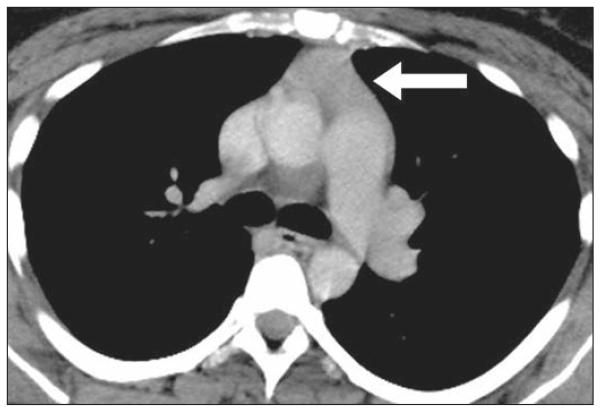
31-year-old woman with lymphoid thymic hyperplasia and Graves disease. Contrast-enhanced CT image shows pyramidal-shaped thymus gland (arrow) with CT attenuation of 67.7 HU.
Fig. 4.

51-year-old woman with true thymic hyperplasia. Contrast-enhanced CT image shows thymus gland (arrow) with attenuation of −5.0 HU. Patient had myasthenia gravis and history of steroid use for asthma.
MRI and PET Characteristics
In six patients who underwent MRI (four patients with true hyperplasia and two patients with lymphoid hyperplasia), the thymus was heterogeneous on T1- and T2-weighted imaging in four patients (two patients in each group) and was homogeneous in two patients with true hyperplasia. The signal intensity on T1-weighted images was slightly high in four patients (two patients in each group) and isointense in two patients (both with true hyperplasia), compared to the skeletal muscle. The signal intensity on T2-weighted images was high in one patient with true hyperplasia, slightly high in four patients (three with true hyperplasia and one with lymphoid hyperplasia), and isointense in one patient with lymphoid hyperplasia. The decrease in signal intensity of the thymus gland on the opposed-phase image relative to the in-phase image was present in all four cases with in-phase and opposed-phase images (three patients with true hyperplasia and one patient with lymphoid hyperplasia) (Fig. 5). All five patients with PET/CT images had true hyperplasia, with mean and median SUVmax of 2.66 and 2.62, respectively (range, 1.93–3.80; first quartile, 1.97; third quartile, 3.16) (Fig. 6).
Fig. 5.

31-year-old man with true hyperplasia.
A and B, Transaxial chemical-shift in-phase (TR/TE, 120/2.5) MRI (A) and opposed-phase (TR/TE, 3.1/1.1) gradient-echo T1-weighted MRI (B) show decreased signal intensity (arrows) on opposed-phase (B) compared with in-phase (A) imaging.
Fig. 6.

52-year-old man with true hyperplasia.
A–C, Axial CT (A), 18FDG PET (B), and fused FDG PET/CT (C) images show thymus gland (arrows) with maximum standardized uptake value of 2.62.
Discussion
The current study of imaging features of pathologically confirmed cases of thymic hyperplasia found that CT attenuation of lymphoid hyperplasia was significantly higher than that of true hyperplasia, with the optimal threshold of greater than 41.2 HU for differentiating lymphoid hyperplasia from true hyperplasia. Other measurements, including length, thickness, diameters, and qualitative features, did not significantly differ between the two subtypes of thymic hyperplasia. To our knowledge, such observation based on the detailed imaging assessment of pathologically proven cases of thymic hyperplasia has not been previously reported.
The most common morphologic feature of thymic hyperplasia was pyramidal shape, seen in 80% of the patients. Although several different terminologies have been used to describe the morphologic features of thymic hyperplasia, we applied the classification on the basis of the previous report of thymic hyperplasia in patients with thyroid cancer by Niendorf et al. [16], who reported that the enlarged thymus gland had a pyramidal configuration in all but one case among 24 patients. We also assessed the margins because it may help to evaluate the enlargement or fullness of the gland, and our preliminary observation suggested that the margins of pyramidal thymic glands can be classed into three categories as performed in the study. Thymus was indistinguishable from mediastinal fat in four patients, of whom three were older than 50 years, which consisted of 30% of the patients older than 50 years with CT studies available. The incidence of nonvisualization of thymus was much lower than that reported in a cohort of 154 patients with presumed normal thymus based on the clinical information, in which it was 83% for the age group older than 49 years [23]. The result is expected because our cohort consists solely of patients with pathologically proven thymic hyperplasia. All four patients with thymus indistinguishable from mediastinal fat on CT had myasthenia gravis (Fisher p = 0.016), as is expected, because these patients most likely underwent thymectomy as a treatment of myasthenia gravis, regardless of morphologic abnormalities of the thymus on imaging [8, 15, 19, 24–26].
The thymic size measurements, including length, thickness, and transverse and anteroposterior diameters, were not significantly different between the true hyperplasia group and the lymphoid hyperplasia group (p > 0.21). The results were somewhat counterintuitive because, per pathologic definitions, true hyperplasia is defined as enlargement of the thymus gland, determined by weight and volume, beyond the upper limit of normal for that particular age, whereas lymphoid hyperplasia refers to the presence of an increased number of lymphoid follicles and may or may not be associated with enlargement of the thymus [1]. Given the description, one might expect that the thymic gland with true hyperplasia is larger than the gland with lymphoid hyperplasia; however, our results showed no difference. In fact, when we compared the measurements of thymic hyperplasia cases with the mean measurements of the normal thymus gland in the corresponding age group described in the previous literature, the size measurements of glands with thymic hyperplasia were significantly larger than the mean normal values both in true hyperplasia and lymphoid hyperplasia. Our observations are concordant with the prior report of thymic hyperplasia in patients with thyroid cancer, in which the length and thickness of the lobes were significantly larger than the age-matched normal values [16]. Although the pathologic diagnosis of hyperplasia is not available in the report of Niendorf et al. [16], those authors suspected that the mechanism of hyperplasia in patients with thyroid cancer is likely similar to that involved in Graves disease and other benign thyroid conditions associated with lymphoid hyperplasia. Given these findings, it is likely that many lymphoid hyperplasia cases are also associated with thymic enlargement, at least on the basis of measurements on imaging.
For thymic measurements, it is important to assess the measurement results in comparison with the reported normal values in the corresponding age group, because the change in size and weight over time is one of the most unique features of thymus as an organ [1, 2]. We used the reported mean transverse and anteroposterior diameters and their SDs in normal thymus described by Francis et al. in 1985 [22] from a study of 309 patients and the mean length and thickness of right and left lobe and their SDs described by Baron et al. in 1982 [23] in their study of 154 patients. As expected, all the measurements of patients with thymic hyperplasia were larger than the mean values of normal glands. The length and thickness were also larger than the upper 95% limit of the normal values, whereas transverse and anteroposterior diameters were not, except for patients 50 years old or older. In the assessment of thymic hyperplasia, where the gland often diffusely enlarges with pyramidal configuration, the length and thickness of each lobe are more likely than the diameters to reflect pathologic conditions of the gland. Familiarity with the thymic measurement technique is important for radiologists to assess thymic pathologic abnormalities.
The present study also found that the CT attenuation of the thymus on contrast-enhanced CT is significantly higher in patients with lymphoid hyperplasia than in patients with true hyperplasia, with an optimal cutoff value for differentiating lymphoid hyperplasia from true hyperplasia being greater than 41.2 HU in our population. Although the patient population is small in this study and the threshold value needs to be validated in a larger cohort, the results provide a diagnostic clue in differentiating two types of thymic hyperplasia that have not been described previously, to our knowledge. Because it is known that the CT attenuation of the thymus decreases with aging [23], we also compared the ages of patients with true versus lymphoid hyperplasia with contrast-enhanced CT, which showed no significant difference (median age for both groups, 31 years; Wilcoxon p = 0.44). Therefore, the higher CT attenuation of patients with lymphoid hyperplasia is not due to age differences but likely reflects the histologic features of the entity composed of lymphoid follicles. Although they are preliminary, the results also suggest that the presence of enlarged thymus with CT attenuation higher than 41.2 HU on contrast-enhanced chest CT may indicate the possibility of lymphoid hyperplasia, prompting the clinical assessment for possible underlying autoimmune diseases in the appropriate setting.
The association between lymphoid hyperplasia and myasthenia gravis is well established and studied. Nicolaou et al. [8] studied 45 patients with myasthenia gravis who underwent thymectomy and reviewed CT findings of 22 patients with lymphoid hyperplasia. Among them, 10 had normal thymic tissue on CT, seven had a diffusely enlarged thymus (defined as > 1.3 cm thickness of the lobe for patients > 20 years old), and five had a focal mass [8]. In our study, seven of 10 patients with myasthenia gravis had lymphoid hyperplasia, whereas three had true hyperplasia. All three patients with myasthenia and true hyperplasia had a history of steroid use, which may explain the result. CT attenuation of the gland was not reported in the study [8], which is an added new finding in the current study.
Chemical-shift MRI has been studied in thymic hyperplasia, mainly to differentiate hyperplasia from thymic tumors [2, 17]. Inaoka et al. [17] studied 41 patients with thymic lesions, including 23 with hyperplasia and 18 with tumor. In their study, the decrease in signal intensity of the thymus gland on the opposed-phase images relative to that on the in-phase images was seen in all 23 patients with hyperplasia but in none of the patients with tumor [17]. The result is concordant with our study, in which a decrease in signal intensity of the gland on opposed-phase images was noted in all four patients who underwent chemical-shift MRI. Although the total number of patients in our study is smaller than that in the prior study, all four patients with chemical-shift MRI in our study had histologically confirmed thymic hyperplasia (three with true hyperplasia and one with lymphoid hyperplasia), whereas only one patient in the hyperplasia group had pathologically confirmed diagnosis and the diagnosis of hyperplasia was clinically based for the remaining 22 patients in the study by Inaoka et al. Our study provides further confirmation of the previously reported finding of thymic hyperplasia on chemical-shift MRI in pathologically confirmed cases.
FDG PET is a useful diagnostic tool for thymic malignancy and has been particularly well studied in differentiating subtypes of thymic epithelial tumors [27–29]. However, physiologic thymic uptake of FDG occurs especially in patients before puberty and sometimes even in young adult patients [30]. In our study, no prepubertal patient was included, and the results showed that the mean SUVmax of thymic hyperplasia was 2.66 (range, 1.93–3.80), which is slightly higher than the previously reported SUV in radiologically enlarged but histologically normal thymus in three patients (mean, 1.8; range, 1.1–2.2) [31]. Brink et al. [32] evaluated the SUV in patients with malignancy after chemotherapy and reported that 75% (9/12) of pediatric patients and 5% (5/104) of adult patients showed visually increased FDG up-take, with mean (± SD) SUVs of 2.22 ± 0.93 and 2.74 ± 0.66, respectively. In that study, three adults patients had confirmed diagnosis of thymic hyperplasia, but none of them showed visually increased thymic FDG uptake [32]. From these studies, it is evident that FDG up-take overlaps between normal and pathologic thymus. Therefore, PET images have to be interpreted in correlation with the other imaging modalities (e.g., CT or MRI), and the patient’s age and clinical conditions, especially history of chemotherapy, should be taken into account. Although our study is limited by a small number of patients, it provides a reference value for SUVmax in patients with thymic hyperplasia diagnosed by pathologic analysis.
There are several limitations to the current study, including its retrospective design and the small number of patients from a single institution. Although 47 consecutive patients were identified from the pathology database, 16 patients were excluded because of a lack of preoperative cross-sectional imaging. Because the purpose of the current study is to investigate the imaging features of thymic hyperplasia on CT, PET/CT, and MRI, the availability of imaging studies was inevitable as radiologic eligibility criteria for the patients in this study. However, it should be noted that such criteria may cause selection bias, because clinical providers may tend to obtain dedicated cross-sectional imaging in clinically complicated or surgically challenging cases, whereas they may omit such imaging for cases that are straightforward. Similarly, the patient selection based on the pathologic diagnosis of thymic hyperplasia may have rendered us to bias in that we studied only patients who underwent thymectomy and did not include patients who were observed without surgery; however, we designed the study this way because we think that the systematic investigation of imaging features of the cases pathologically proven as thymic hyperplasia is essential to understanding the entity and complements the limitations of prior reports that described the imaging characteristics of “thymic hyperplasia” on the basis of clinical or radiologic criteria, rather than pathologic diagnosis. The results of the current study should be interpreted in the context of the study design.
In conclusion, the study found that the CT attenuation of the thymus on contrast-enhanced CT was significantly higher in lymphoid hyperplasia than in true hyperplasia, with an optimal cutoff value of greater than 41.2 HU, which can be further studied in a larger cohort. Thymic size measurements did not differ between true and lymphoid hyperplasia and were larger compared with the age-matched normal thymic measurements in both subtypes of hyperplasia. The study also provided the quantitative and qualitative features of pathologically proven cases of thymic hyperplasia using CT, MRI, and PET/CT, which can serve as reference information in patients with suspected thymic pathologic abnormalities.
Acknowledgments
M. Nishino was supported by the National Cancer Institutes (grant 1K23CA157631).
References
- 1.Shimosato Y, Mukai K. Tumors of the mediastinum: atlas of tumor pathology. 3rd series Vol. 21. Armed Forces Institute of Pathology; Washington, DC: 1997. pp. 158–168. [Google Scholar]
- 2.Nishino M, Ashiku SK, Kocher ON, Thurer RL, Boiselle PM, Hatabu H. The thymus: a comprehensive review. RadioGraphics. 2006;26:335–348. doi: 10.1148/rg.262045213. [DOI] [PubMed] [Google Scholar]
- 3.Bogot NR, Quint LE. Imaging of thymic disorders. Cancer Imaging. 2005;5:139–149. doi: 10.1102/1470-7330.2005.0107. [DOI] [PMC free article] [PubMed] [Google Scholar]
- 4.Nasseri F, Eftekhari F. Clinical and radiologic review of the normal and abnormal thymus: pearls and pitfalls. RadioGraphics. 2010;30:413–428. doi: 10.1148/rg.302095131. [DOI] [PubMed] [Google Scholar]
- 5.Müller-Hermelink HK, Marx A. Thymoma. Curr Opin Oncol. 2000;12:426–433. doi: 10.1097/00001622-200009000-00007. [DOI] [PubMed] [Google Scholar]
- 6.Sadohara J, Fujimoto K, Müller NL, et al. Thymic epithelial tumors: comparison of CT and MR imaging findings of low-risk thymomas, high-risk thymomas, and thymic carcinomas. Eur J Radiol. 2006;60:70–79. doi: 10.1016/j.ejrad.2006.05.003. [DOI] [PubMed] [Google Scholar]
- 7.Marom EM. Advances in thymoma imaging. J Thorac Imaging. 2013;28:69–80. doi: 10.1097/RTI.0b013e31828609a0. quiz, 81–83. [DOI] [PubMed] [Google Scholar]
- 8.Nicolaou S, Muller NL, Li DK, Oger JJ. Thymus in myasthenia gravis: comparison of CT and pathologic findings and clinical outcome after thymectomy. Radiology. 1996;201:471–474. doi: 10.1148/radiology.201.2.8888243. [DOI] [PubMed] [Google Scholar]
- 9.Benveniste MFK, Rosado-de-Christenson ML, Sabloff BS, Moran CA, Swisher SG, Marom EM. Role of imaging in the diagnosis, staging, and treatment of thymoma. RadioGraphics. 2011;31:1847–1861. doi: 10.1148/rg.317115505. [DOI] [PubMed] [Google Scholar]
- 10.Huang J, Rizk NP, Travis WD, et al. Comparison of patterns of relapse in thymic carcinoma and thymoma. J Thorac Cardiovasc Surg. 2009;138:26–31. doi: 10.1016/j.jtcvs.2009.03.033. [DOI] [PMC free article] [PubMed] [Google Scholar]
- 11.McErlean A, Huang J, Zabor EC, Moskowitz CS, Ginsberg MS. Distinguishing benign thymic lesions from early-stage thymic malignancies on computed tomography. J Thorac Oncol. 2013;8:967–973. doi: 10.1097/JTO.0b013e3182904bc2. [DOI] [PMC free article] [PubMed] [Google Scholar]
- 12.Armstrong P, Wilson AG, Dee P, Hansell D. Imaging of diseases of the chest. Mosby International; London, UK: 2000. pp. 789–892. [Google Scholar]
- 13.Mendelson DS. Imaging of the thymus. Chest Surg Clin N Am. 2001;11:269–293. [PubMed] [Google Scholar]
- 14.Marx A, Pfister F, Schalke B, Nix W, Strobel P. Thymus pathology observed in the MGTX trial. Ann N Y Acad Sci. 2012;1275:92–100. doi: 10.1111/j.1749-6632.2012.06799.x. [DOI] [PubMed] [Google Scholar]
- 15.Blalock A. Thymectomy in the treatment of myasthenia gravis: report of twenty cases. J Thorac Surg. 1944;13:316–339. [Google Scholar]
- 16.Niendorf ER, Parker JA, Yechoor V, Garber JR, Boiselle PM. Thymic hyperplasia in thyroid cancer patients. J Thorac Imaging. 2005;20:1–4. doi: 10.1097/01.rti.0000154075.06324.14. [DOI] [PubMed] [Google Scholar]
- 17.Inaoka T, Takahashi K, Mineta M, et al. Thymic hyperplasia and thymus gland tumors: differentiation with chemical shift MR imaging. Radiology. 2007;243:869–876. doi: 10.1148/radiol.2433060797. [DOI] [PubMed] [Google Scholar]
- 18.Baron RL, Lee JK, Sagel SS, Levitt RG. Computed tomography of the abnormal thymus. Radiology. 1982;142:127–134. doi: 10.1148/radiology.142.1.7053522. [DOI] [PubMed] [Google Scholar]
- 19.Castleman B. The pathology of the thymus gland in myasthenia gravis. Ann N Y Acad Sci. 1966;135:496–505. doi: 10.1111/j.1749-6632.1966.tb45497.x. [DOI] [PubMed] [Google Scholar]
- 20.Berrih-Aknin S, Morel E, Raimond F, et al. The role of the thymus in myasthenia gravis: immunohistological and immunological studies in 115 cases. Ann N Y Acad Sci. 1987;505:50–70. doi: 10.1111/j.1749-6632.1987.tb51282.x. [DOI] [PubMed] [Google Scholar]
- 21.Kissin CM, Husband JE, Nicholas D, Eversman W. Benign thymic enlargement in adults after chemotherapy: CT demonstration. Radiology. 1987;163:67–70. doi: 10.1148/radiology.163.1.3823458. [DOI] [PubMed] [Google Scholar]
- 22.Francis IR, Glazer GM, Bookstein FL, Gross BH. The thymus: reexamination of age-related changes in size and shape. AJR. 1985;145:249–254. doi: 10.2214/ajr.145.2.249. [DOI] [PubMed] [Google Scholar]
- 23.Baron RL, Lee JK, Sagel SS, Peterson RR. Computed tomography of the normal thymus. Radiology. 1982;142:121–125. doi: 10.1148/radiology.142.1.7053521. [DOI] [PubMed] [Google Scholar]
- 24.Singla S, Litzky LA, Kaiser LR, Shrager JB. Should asymptomatic enlarged thymus glands be resected? J Thorac Cardiovasc Surg. 2010;140:977–983. doi: 10.1016/j.jtcvs.2010.08.005. [DOI] [PubMed] [Google Scholar]
- 25.Tseng YC, Hsieh CC, Huang HY, et al. Is thymectomy necessary in nonmyasthenic patients with early thymoma? J Thorac Oncol. 2013;8:952–958. doi: 10.1097/JTO.0b013e31828cb3c2. [DOI] [PubMed] [Google Scholar]
- 26.Pirronti T, Rinaldi P, Batocchi A, Evoli A, Di Schino C, Marano P. Thymic lesions and myasthenia gravis. Acta Radiol. 2002;43:380–384. doi: 10.1080/j.1600-0455.2002.430407.x. [DOI] [PubMed] [Google Scholar]
- 27.Sung YM, Lee KS, Kim BT, Choi JY, Shim YM, Chin AY. 18F-FDG PET/CT of thymic epithelial tumors: usefulness for distinguishing and staging tumor subgroups. J Nucl Med. 2006;47:1628–1634. [PubMed] [Google Scholar]
- 28.Ferdinand B, Gupta P, Kramer EL. Spectrum of thymic uptake at 18F-FDG PET. RadioGraphics. 2004;24:1611–1616. doi: 10.1148/rg.246045701. [DOI] [PubMed] [Google Scholar]
- 29.Benveniste MF, Moran CA, Mawlawi O, et al. FDG PET-CT aids in the preoperative assessment of patients with newly diagnosed thymic epithelial malignancies. J Thorac Oncol. 2013;8:502–510. doi: 10.1097/JTO.0b013e3182835549. [DOI] [PMC free article] [PubMed] [Google Scholar]
- 30.Nakahara T, Fujii H, Ide M, et al. FDG uptake in the morphologically normal thymus: comparison of FDG positron emission tomography and CT. Br J Radiol. 2001;74:821–824. doi: 10.1259/bjr.74.885.740821. [DOI] [PubMed] [Google Scholar]
- 31.Wittram C, Fischman AJ, Mark E, Ko J, Shepard J-AO. Thymic enlargement and FDG uptake in three patients: CT and FDG positron emission tomography correlated with pathology. AJR. 2003;180:519–522. doi: 10.2214/ajr.180.2.1800519. [DOI] [PubMed] [Google Scholar]
- 32.Brink I, Reinhardt MJ, Hoegerle S, Altehoefer C, Moser E, Nitzsche EU. Increased metabolic activity in the thymus gland studied with 18F-FDG PET: age dependency and frequency after chemo-therapy. J Nucl Med. 2001;42:591–595. [PubMed] [Google Scholar]