

Abstract
The cortical (auditory and prefrontal) and/or subcortical (thalamic and hippocampal) generators of abnormal electrophysiological responses during sensory gating remain actively debated in the schizophrenia literature. Functional magnetic resonance imaging has the spatial resolution for disambiguating deep or simultaneous sources but has been relatively under‐utilized to investigate generators of the gating response. Thirty patients with chronic schizophrenia (SP) and 30 matched controls participated in the current experiment. Hemodynamic response functions (HRFs) for single (S1) and pairs (S1 + S2) of identical (“gating‐out” redundant information) or nonidentical (“gating‐in” novel information) tones were generated through deconvolution. Increased or prolonged activation for patients in conjunction with deactivation for controls was observed within auditory cortex, prefrontal cortex, and thalamus in response to single tones during the late hemodynamic response, and these group differences were not associated with clinical or cognitive symptomatology. Although patient hyperactivation to paired‐tones conditions was present in several regions of interest, the effects were not statistically significant for either the gating‐out or gating‐in conditions. Finally, abnormalities in the postundershoot of the auditory HRF were also observed for both single and paired‐tones conditions in patients. In conclusion, the amalgamation of the entire electrophysiological response to both S1 and S2 stimuli may limit hemodynamic sensitivity to paired tones during sensory gating, which may be more readily overcome by paradigms that use multiple stimuli rather than pairs. Patient hyperactivation following single tones is suggestive of deficits in basic inhibition, neurovascular abnormalities, or a combination of both factors. Hum Brain Mapp 34:2302–2312, 2013. © 2012 Wiley Periodicals, Inc.
Keywords: fMRI, schizophrenia, gating, auditory, inhibition
INTRODUCTION
A neuronal mechanism for attenuating redundant or unimportant sensory information is critical for maintaining cognitive resources for processing novel (i.e., potentially important) information. Neurophysiologists have developed a number of methods for indexing this gating mechanism, the most common of which is an auditory paired‐click paradigm [Adler et al., 1982; Freedman et al., 1987]. In this paradigm, a click (S1) is presented to elicit a cortical response followed by a brief interstimulus interval (typically 500 ms) and a second click (S2). The ratio of the electrophysiological 50 (P50 or M50) or 100 (N100 or M100) ms response from S2 relative to S1 is then derived as a putative marker of neuronal efficiency.
Reports of “sensory overload” in patients with schizophrenia (SP) motivated the hypothesis that abnormal sensory gating may be characteristic of the disorder. Indeed, there are now dozens of studies reporting reduced attenuation for redundant information in SP [de Wilde et al., 2007; Light and Braff, 2003; Patterson et al., 2008]. This deficit is detectible in antipsychotic‐naïve patients, patients under treatment with first and second generation antipsychotics or their combination, prodromal and potentially prodromal (at‐risk) patients, and in unaffected relatives of patients in most studies [Brockhaus‐Dumke et al., 2008b; de Wilde et al., 2007; Hall et al., 2011; Myles‐Worsley et al., 2004; Olincy et al., 2010], suggesting a genetic association with schizophrenia [Adler et al., 1999; Freedman et al., 2003; Olincy et al., 2010]. Gating deficits predict cognitive function and symptomatology in SP [Louchart‐de la Chapelle et al., 2005; Smith et al., 2010; Thoma et al., 2005], indicating that gating abnormalities may account for some of cognitive dysfunction that characterizes the disorder. Although the differences in ratio scores have traditionally been interpreted as a failure to suppress irrelevant sensory input (i.e., S2), other studies have suggested that poor gating may be partially attributable to a reduced S1 response in SP [Clementz and Blumenfeld, 2001; Johannesen et al., 2005]. The potential source of group differences is critical given the putative cognitive roles that are ascribed to S1 (encoding information) versus S2 (filtering information) during gating [Smith et al., 2010].
In addition, the neuronal generators of the gating response remain actively debated. As recently discussed [Garcia‐Rill et al., 2008], early electroencephalography (EEG) studies argued for sources in the temporal lobes, but limited spatial resolution and methodological concerns may have limited the conclusions of these studies. Magnetoencephalography (MEG) studies also localize the S1 M50 and M100 to the superior temporal gyrus (STG), finding a left‐hemisphere STG M50 gating deficit and a bilateral STG M100 gating deficit in SP [Hanlon et al., 2005; Thoma et al., 2005]. However, others localize M50 to the frontal cortex [Garcia‐Rill et al., 2008]. Other approaches computing source estimates of a gating difference wave (the event‐related average of S1 minus that of S2) suggest both temporal and frontal sources as well as potential involvement of the posterior cingulate and precentral/postcentral gyri [Knott et al., 2009]. Invasive recordings suggest that the temporal lobes are the primary generators of the P50 waveform, but that attenuation of the S2 response was chiefly a frontal lobe phenomenon [Korzyukov et al., 2007]. In addition to cortical generators, animal models have reported gating effects in thalamic nuclei [Krause et al., 2003] and hippocampus [Freedman et al., 1996], which are more difficult to detect with noninvasive electrophysiological techniques. Finally, presurgical mesial‐temporal lobectomy human evaluations [Boutros et al., 2008] have also reported evidence of a late gating response in the hippocampus.
The majority of gating studies have exploited the millisecond resolution of electrophysiological techniques to measure the individual components (e.g., P50/M50 and N100/M100) of the S1 and S2 responses. Although functional magnetic resonance imaging (fMRI) studies of sensory gating are rare [Bak et al., 2011; Mayer et al., 2009; Tregellas et al., 2007], they provide higher spatial resolution and the ability to noninvasively measure simultaneously active neuronal generators, including deeper sources such as the thalamus and hippocampus, at the expense of coarser temporal resolution. The single fMRI study examining gating in SP reported hyperactivation of the hippocampus, dorsolateral prefrontal cortex (DLPFC), and thalamus in SP relative to controls based on a region of interest (ROI) approach [Tregellas et al., 2007]. To mitigate the temporal properties of the hemodynamic response, gating was operationally defined by comparing a train of nine clicks repeated over 4 s to a single click.
Pairs of either identical (IT) or nonidentical (NT) tones can also be used to examine auditory sensory gating instead of traditional clicks [Boutros et al., 1999], permitting the assessment of inhibition for repeated stimuli (IT; “gating out”) as well as the dishabituation (NT; “gating in”) to novel stimuli [Gjini et al., 2010]. Previously published electrophysiological results indicate larger gating effects for IT (P50 gating ratio = 44%) compared to NT tones condition (P50 gating ratio = 67%) in healthy controls (HC), with a reversal of effects in SP [Boutros et al., 1999]. Specifically, we predicted that the previously reported dissociation in electrophysiological response amplitude would also be present in the hemodynamic gating response, based on the assumption that a reduced electrophysiological gating response (i.e., increased S2) would also result in increased blood oxygen level dependent activity [Mayer et al., 2009]. Therefore, we predicted that HC would demonstrate decreased activity within the gating network (auditory cortex, thalamus, hippocampus, and prefrontal cortex) during IT compared to NT tones, whereas SP would show the opposite pattern. Finally, we also predicted there would be no group differences in the hemodynamic response to single tones, an fMRI analog of the S1 response.
METHODS
Participants
Thirty‐one patients with a Diagnostic and Statistical Manual of Mental Disorders (Fourth Edition) (DSM‐IV) diagnosis of SP (eight females and 23 males; 36.5 ± 12.8 years old) and 31 gender and age‐matched HC (35.8 ± 13.0 years old) were recruited for the current study, which is part of a larger, multimodal imaging project. All patients were chronic with relatively well‐treated symptoms. One female SP was an outlier (three standard deviations) relative to the cohort on four of six motion parameters and was eliminated from all subsequent analyses. This participant's matched female control was eliminated as well. Informed consent was obtained from participants according to institutional guidelines at the University of New Mexico.
Inclusion criteria for diagnosis of schizophrenia and a chronological age of 18–65 years. All SP were on a variety of antipsychotic medications (no medication changes in 1 month), such that olanzapine equivalency scores were calculated to estimate medication load [Gardner et al., 2010]. SP with a history of neurological disorder, head trauma with loss of consciousness greater than 5 min, mental retardation, active substance dependence or abuse (except for nicotine) within the past year, current use of mood stabilizers, history of dependence on PCP, amphetamines or cocaine, or history of PCP, amphetamine, or cocaine use within the last 12 months were excluded. Each patient completed the structured clinical interview for DSM‐IV axis I disorders (SCID).
HC completed the SCID—non‐patient edition to rule out axis I conditions. Exclusion criteria included current or past psychiatric disorder, family history of a psychotic disorder in a first‐degree relative, history of neurological disorder, head trauma with a loss of consciousness greater than 5 min, mental retardation, recent history of substance abuse or dependence, history of more than one lifetime depressive episode, history of depression or antidepressant use within the last 6 months, and history of lifetime antidepressant use of more than 1 year. All participants refrained from smoking for at least 1 h prior to scanning.
Clinical Assessment
Composite neuropsychological indices were calculated for the following six domains by averaging normalized scores: 1) attention/inhibition [Connors Continuous Performance Test (CCPT; commissions and hit reaction times) and MATRICS Continuous Performance Test–Identical Pairs (overall T‐score)], 2) learning and memory [Hopkins Verbal Learning Test‐Revised (HVLT‐R) and HVLT‐R delayed recall], 3) working memory [MATRICS Wechsler Memory Scale (Letter‐Number Span and Spatial Span)], 4) processing speed [MATRICS Brief Assessment of Cognition in Schizophrenia (Symbol Coding), Wechsler Adult Intelligence Scale ‐ IV (Symbol Search), and the Trail Making Test part A], and 5) executive function [Word Fluency (FAS), MATRICS Neuropsychological Assessment Battery (Mazes), and Category Fluency (Animal Naming)].
All participants also completed the Wechsler Test of Adult Reading (WTAR), Wechsler Abbreviated Scale of Intelligence (WASI), the Fagerstrom Test for Nicotine Dependence (FTND), and urine drug screening. SP were also rated with the Positive and Negative Syndrome Scale (PANSS), Calgary Depression Scale and the Clinical Global Impression (CGI).
Task
The paradigm was a variant of the traditional paired‐click paradigm previously used to investigate the hemodynamic gating response in a separate cohort of HC [Mayer et al., 2009]. Participants were presented with either a pair of 5 ms binaural IT 2,000 Hz tones (IT condition), a 5 ms binaural 2,000 Hz tone followed by a 5 ms binaural 3,000 Hz tone (NT condition), a single 5 ms binaural 2,000 Hz tone, or a single 5 ms binaural 3,000 Hz tone in an event‐related design. The hemodynamic response represents a nonlinear summation of the underlying electrophysiological response to both S1 and S2. Therefore, whereas the hemodynamic S1 response should be the same for the IT and NT conditions, S2 should theoretically be reduced in amplitude during the gating of repeated (IT) relative to novel (NT) information [Mayer et al., 2009]. All tones included 1 ms linear onset and offset ramps and paired tones were separated by 500 ms. The 11) ordering of trials was pseudorandomized across all conditions. There were a total of 19 trials for each single‐tone condition and 20 trials for each paired‐tone condition.
A visual fixation cross was used to minimize the likelihood of eye movements. A jittered intertrial interval (ITI) of either 6, 8, or 10 s was adopted in the current experiment. The pseudorandomized timing scheme (ITI) also permitted the establishment of a baseline state in the regression model [Burock et al., 1998]. The level of auditory stimulation was determined separately for each participant by the limits method [Boutros et al., 2002; Thoma et al., 2003] using the Presentation Software platform. Specifically, all auditory stimuli were first presented via an Avotec SS‐3100 audio system while the scanner was acquiring echo‐planar imaging (EPI) data to simulate actual experimental conditions. The initial starting condition for all participants was an attenuation level of 0. Participants were instructed to attenuate sound level by 0.05 unit decrements (through button presses) until stimuli were no longer detectable, followed by amplification (0.01 unit increments) until stimuli were again audible. The Presentation Software platform indicates that each unit (0.01) of attenuation corresponds roughly to a single decibel. The experimental stimuli were then delivered at 0.35 units above the individually determined threshold level. The final level of attenuation was significantly higher (t 1,57 = 3.10, P = 0.003) for HC (0.19 ± 0.06) than SP (0.14 ± 0.08).
MR Imaging
All images were collected on a 3 T Siemens Trio scanner with foam padding/paper tape used to restrict motion. High resolution T 1‐weighted images were acquired with a five‐echo multiecho MPRAGE sequence [TE (echo times) = 1.64, 3.5, 5.36, 7.22, 9.08 ms, TR (repetition time) = 2.53 s, inversion time = 1.2 s, 7° flip angle, number of excitations = 1, slice thickness = 1 mm, FOV (field of view) = 256 mm, resolution = 256 × 256] for ROI analyses. Echo‐planar images (336 images across three runs) were collected using a conventional single‐shot, gradient‐echo echoplanar pulse sequence [TR = 2,000 ms; TE = 29 ms; flip angle = 75°; FOV = 240 mm; matrix size = 64 × 64; 33 slices; voxel size: 3.75 × 3.75 × 4.55 mm3]. The first image of each run was eliminated to account for T 1 equilibrium effects.
Image Processing and Statistical Analyses
Functional images were generated using the Analysis of Functional NeuroImages package. Time‐series images were spatially registered in both two‐ and three‐dimensional space to the second EPI image of the first run, temporally interpolated to correct for slice‐time acquisition differences and despiked. Time series were then registered to standard stereotaxic Talairach coordinate space using a 12 degree‐of‐freedom affine transformation and spatially blurred (6 mm Gaussian full‐width half‐maximum filter). A deconvolution analysis was used to generate one hemodynamic response function (HRF) for each of the four conditions on a voxel‐wise basis, with motion parameters entered as regressors of no interest. Each HRF was derived relative to the baseline state (fixation plus ambient scanner noise) and based on the first eight images (16 s) poststimulus onset. Therefore, significant activation suggests a greater regional hemodynamic response in relation to the task versus baseline, whereas deactivation would suggest that hemodynamic activity was greater during the baseline condition. Based on reports of a later electrophysiological gating response in some structures, we examined a single image corresponding to both peak (4–6 s poststimulus onset; Fig. 4) and later (6–8 s) responses of the HRF separately. Percent signal change (PSC) was calculated for each HRF by dividing resulting beta coefficients by the model intercept.
Figure 4.

Panel (A) shows auditory activation for IT and NT tones relative to baseline for a. controls (HC) and patients (SP) (blue) and are color‐coded according to magnitude of the z scores. Graphs in Panel (B) illustrate aberrant HRFs (postpeak) for b. SP (blue) compared to HC (red) in bilateral auditory cortex for identical (IT; upper graph) and nonidentical (NT; lower graph) tones, with percent signal change (PSC) represented along the y‐axis. Error bars represent 2 × standard error of the mean.
To examine a priori predictions of a double dissociation of functioning in paired‐tones conditions, ROI analyses were performed for the STG, prefrontal cortex, thalamus, and medial temporal lobes. Specifically, T 1‐weighted images were processed using the Freesurfer automated pipeline, yielding participant‐specific parcellations of the cerebral cortex based on individual gyral anatomy and inspected for gross segmentation errors. From these parcellations, five ROIs were generated including: (1) the STG/transverse temporal gyri; (2) DLPFC (rostral middle frontal cortex); (3) ventrolateral prefrontal cortex (VLPFC; pars opercularis and pars triangularis); (4) (hippocampus, parahippocampal gyrus, and entorhinal cortex); and (5) thalamus. To reduce the number of comparisons and be consistent with previous work [Tregellas et al., 2007], mean PSC was averaged across the bilateral ROIs.
Four exploratory 2 × 2 [condition (NT vs. IT or 2,000 vs. 3,000 Hz tones) × group (HC vs. SP)] voxel‐wise linear mixed‐effects analyses were also performed for both the paired and single‐tone conditions to examine differences in functional activity associated with peak (4–6 s) versus late (6–8 s) responses. All voxel‐wise results were corrected for false positives at P < 0.05 using Gaussian random fields theory as implemented in FSL (http://www.fmrib.ox.ac.uk/fsl/feat5/programs.html).
RESULTS
Clinical/Neuropsychological Results
There were no significant (P > 0.10) group differences in age, education attainment, or primary caregiver education attainment (Table 1). There was a significant difference between groups on frequency of smokers (X 2 = 4.022, P = 0.045; 12/30 SP and 5/30 HC). Clinical characteristics of the patient group can be found in Table 2. PANSS positive and negative symptom scores suggested that the patient cohort was fairly stable. Scores on the Calgary Depression Scale indicated minimal affective disturbance, and mean CGI severity indicated that patients were mildly ill at the time of their visit. Results presented in Tables 1 and 2 are derived from the final groups of participants (n = 30 for both SP and HC) after removing outliers based on head movement.
Table 1.
Summary of participant neuropsychological performance
| SP (N = 30) | HC (N = 30) | P value | Cohen's D | |||
|---|---|---|---|---|---|---|
| Mean | SD | Mean | SD | |||
| Demographics | ||||||
| Age (years) | 36.57 | 12.97 | 36.07 | 13.08 | 0.882 | 0.04 |
| Education level | 4.10 | 1.49 | 4.70 | 1.42 | 0.116 | −0.42 |
| Parent education level | 4.38 | 2.19 | 4.80 | 1.75 | 0.434 | −0.22 |
| Composite indices | ||||||
| Attention/inhibition | 44.00 | 7.25 | 51.88 | 4.02 | 0.000 | −1.36 |
| Learning/memory | 36.85 | 8.56 | 45.02 | 10.64 | 0.002 | −0.87 |
| Working memory | 42.29 | 10.93 | 51.41 | 8.68 | 0.001 | −0.94 |
| Processing speed | 38.87 | 9.85 | 53.81 | 5.13 | 0.000 | −1.92 |
| Executive functioning | 40.75 | 7.59 | 50.07 | 5.00 | 0.000 | −1.47 |
| Additional measures | ||||||
| WTAR | 103.21 | 13.39 | 111.44 | 18.27 | 0.019 | −0.53 |
| WASI verbal IQ | 98.41 | 13.91 | 107.81 | 11.57 | 0.008 | −0.75 |
| WASI performance IQ | 104.28 | 18.27 | 116.81 | 11.23 | 0.003 | −0.83 |
Notes: SP = Schizophrenia Patients, HC = Healthy Controls, WTAR = Wechsler Test of Adult Reading, WASI = Wechsler Abbreviated Scale of Intelligence. Education level was determined based on the following scale: Grade 6 or less = 1; Grade 7–11 = 2; high school graduate = 3; attended college = 4; graduated 2 years college = 5; graduated 4 years college = 6; attended graduate or professional school = 7; Completed graduate or professional school = 8.
Table 2.
Summary of patient clinical characteristics
| Patient Clinical Characteristics | ||
|---|---|---|
| Mean | SD | |
| Age of onset (years) | 19.73 | 7.77 |
| Illness duration (years) | 16.83 | 13.06 |
| PANSS positive | 14.60 | 5.42 |
| PANSS negative | 12.63 | 3.96 |
| PANSS general | 27.66 | 8.74 |
| PANSS total | 54.83 | 13.92 |
| Calgary depression | 4.03 | 4.68 |
| CGI | 3.33 | 0.96 |
| Olanzapine equivalent | 15.71 | 13.96 |
Note: PANSS = positive and negative syndrome scale.
Estimates of premorbid intelligence (word reading) suggested significantly lower scores for the patient group (t 1,54 = 2.42, P = 0.019). A MANOVA indicated significantly lower IQ for the patient group (F 2,53 = 5.47, P = 0.007), with between‐participants univariate effects showing significant differences on both verbal (F 1,54 = 7.50, P = 0.008) and performance (F 1,54 = 9.40, P = 0.003) IQ. Finally, the multivariate effect of group was significant (F 5,50 = 11.35, P < 0.001) for a MANOVA examining cognitive deficits, as were the univariate group effects for individual domains (Table 1). Effect sizes across the majority of measures were large (i.e., greater than 0.75), suggesting robust cognitive deficits in the SP group.
fMRI Results
MANOVAs were used to assess group differences in rotational and translational motion. The multivariate effect of rotational motion was a trend (F 3,56 = 2.60, P = 0.061), with patients showing significantly greater rotation in pitch (around the y‐axis; F 1,58 = 7.36, P = 0.009) during univariate tests. Additionally, there was a multivariate trend toward differences in translational motion (F 3,56 = 2.22, P = 0.096), with SP showing significantly greater movement in the superior–inferior (F 1,58 = 6.33, P = 0.015) and anterior–posterior (F 1,58 = 5.64, P = 0.021) directions.
Paired‐Tones Comparisons
Linear mixed‐effects ANOVAs were performed to examine for group differences in functional activation in response to the paired‐tones condition (ROIs). Although activation was higher for the SP group in 4/5 regions (Fig. 1), these findings did not reach statistical significance at either uncorrected (P < 0.05) or corrected (Bonferoni; P < 0.005) levels for the peak or late hemodynamic response within the STG, DLPFC, VLPFC, thalamus, or medial temporal ROIs. Additional analyses were also conducted using sound attenuation levels as a covariate, but these results were also not significant. Similarly, the exploratory voxel‐wise 2 × 2 linear mixed‐effects analyses did not reveal significant effects following correction for multiple comparisons (P < 0.05).
Figure 1.
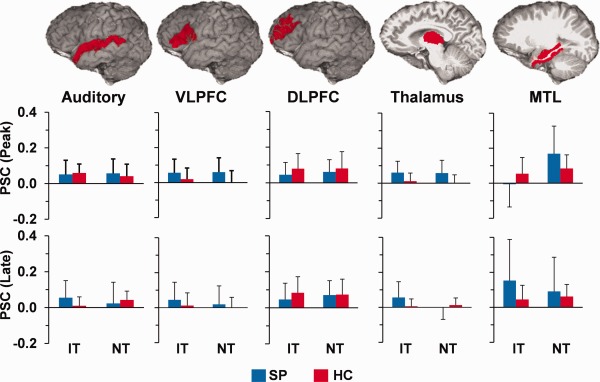
Regions of interest (ROIs) analyses for the paired‐tones conditions revealing no significant group differences. Top row depicts all ROI, including auditory cortex, b. ventrolateral prefrontal cortex (VLPFC), dorsolateral prefrontal cortex (DLPFC), thalamus, and medial temporal lobes (MTL). Middle row depicts c. percent signal change (PSC) for identical (IT) and nonidentical (NT) tones for both patients (SP; blue) and controls (HC; red) during the peak of the hemodynamic response. The bottom row illustrates the late response, and all error bars represent 2 × standard error of the mean.
Supplementary Analyses
Previous fMRI studies reported an increased hemodynamic response in the thalamus, hippocampus, and prefrontal cortex for SP during a sensory gating task [Tregellas et al., 2007] using one‐tailed t tests. Qualitative examination of the mean PSC in current results (Fig. 1) was suggestive of an increased hemodynamic response for SP in conjunction with high variance. Therefore, IT analyses were repeated with two‐sample t tests; however, results remained nonsignificant even with the simpler nonfactorial model. All ROI analyses were also repeated separately for right and left hemisphere structures; however, results did not reach conventional levels of statistical significance (uncorrected P < 0.05). Finally, ROI analyses were also conducted with smaller volumes of interest for the auditory cortex (Heschl's gyrus only) and medial temporal lobes (hippocampus only). The results from these analyses were similar with no significant group differences.
Single‐Tone Comparisons
Two 2 × 2 [group (HC vs. SP) × condition (2,000 vs. 3,000 Hz tones)] voxel‐wise linear mixed‐effects analyses were also performed on the peak (third image poststimulus onset) and late (fourth image poststimulus onset) images of the single‐tone conditions. Contrary to predictions, results from the peak image (Fig. 2A) indicated a main effect of diagnosis in the bilateral precentral gyri (BAs 4/6) and right postcentral gyri/inferior parietal regions (BAs 2/3/5/40). Examination of PSC maps suggested that this effect was driven by SP activation and control deactivation. Neither the main effect of condition nor the group by condition interaction was significant.
Figure 2.
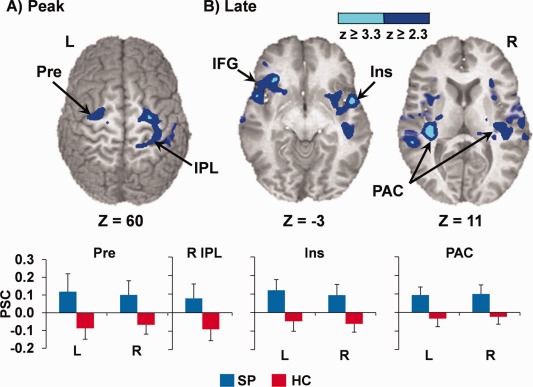
Regions demonstrating a significant effect of patient hyperactivation (SP; blue) for the single‐tone stimuli at (A) peak (4–6 s) and (B) late (6–8 s) poststimulus onset times. Clusters include bilateral precentral gyri (Pre), right inferior parietal lobule (IPL), bilateral insula (Ins) extending to inferior frontal gyrus (IFG), and bilateral primary auditory cortex (PAC), and are color‐coded according to magnitude of the z scores. Bar graphs depict mean percent signal change (PSC) for patients with schizophrenia (SP; blue) and controls (HC; red), with error bars representing 2 × standard error of the mean. Slices (z) are prescribed according to the Talairach atlas.
At the late timepoint, SP exhibited significantly more activation in the bilateral STG/transverse temporal gyri (BAs 21/22/41/42), bilateral posterior insula (BA 13), bilateral VLPFC extending into anterior insula (BA 47), and striatum (Fig. 2B), which resulted from a combination of patient hyperactivation and HC deactivation. A main effect of condition also indicated increased response across both groups to 3,000 Hz tones in a large cluster within the left inferior and middle frontal gyri (BA 11/44/45/46/47). Representative HRFs for selected regions are also presented in Supporting Information Figure 1.
The diagnosis by condition interaction (Fig. 3) for the late timepoint was also significant in the right thalamus, right STG and posterior insula (BA 13), bilateral cingulate gyrus (BAs 24/32), bilateral VLPFC extending into anterior insula (BAs 6/44/45/47), and bilateral anterior striatum. Simple effects tests indicated that interaction in the right STG was primarily attributable to patient hyperactivation to the 2,000 Hz tones (P = 0.001). In the remainder of areas, the interaction effect was a result of a combination of increased or prolonged patient activation and HC deactivation in response to the 2,000 Hz tones (all regions P < 0.05).
Figure 3.

Diagnosis by condition interaction for the late response. Clusters include the medial frontal and anterior cingulate gyrus (MFC), bilateral insula (Ins), and right superior temporal gyrus (STG), and are color‐coded according to magnitude of the z scores. Each bar graph b. (patients (SP) in blue, controls (HC) in red) depicts mean PSC across the clusters in the 2,000 Hz tone (2 K, left) and 3,000 Hz tone (3 K, right) conditions, with error bars representing 2 × standard error of the mean. Slices are prescribed (x and z) according to the Talairach atlas.
The results of the single‐tone analyses were similar when sound attenuation level was used as a covariate. In addition, voxel‐wise multiple regressions were performed to determine whether hyperactivation to the single‐tone conditions at the late timepoint was associated with either medication load (olanzapine equivalent; regression 1) or positive and negative symptoms (PANSS; regression 2) for SP. However, neither variable was significantly associated with PSC data in the regions that exhibited differences between HC and SP. In addition, three other voxel‐wise multiple regressions indicated that traditional neuropsychological tests of attention/inhibition, executive functioning, or working memory did not predict PSC at the late timepoint (false positive correction at P < 0.05) for any regions that exhibited significant group differences.
Within‐Group Comparisons
Although no group differences were observed in the paired‐tones conditions, post hoc analyses were conducted to examine the neuronal networks activated within each group separately integrating across the peak of the hemodynamic response (peak + late). Results indicated robust bilateral activation of the primary and secondary auditory cortex for both SP and HC in response to both IT and NT conditions (Fig. 4). However, examination of the HRF for the auditory cortex suggested that although HC exhibited a canonical HRF with a clear poststimulus undershoot for both conditions, no poststimulus undershoot was evident in SP. The HRF for the single tones exhibited a similar pattern, indicating that previously described group differences for the late timepoint were partially driven by a combination of prolonged patient activation compared to a normal postundershoot (i.e., deactivation) in HC. In addition, SP showed activation within the right thalamus for IT relative to baseline, whereas HC exhibited increased activation in the bilateral precuneus for the NT condition.
DISCUSSION
The current experiment investigated potential sources of gating abnormalities in SP using a neuroimaging technique (fMRI) that has superior spatial resolution relative to electrophysiological techniques and the ability to measure deep and simultaneous sources of the gating response. Consistent with previous work, SP exhibited gross cognitive deficits on formal neuropsychological testing. However, unlike previous electrophysiological studies, there were no significant group differences in the hemodynamic sensory gating response within auditory cortex, MTL, thalamus, or prefrontal cortex during either “gating out” (IT) or “gating in” (NT) conditions [Boutros et al., 1999; Gjini et al., 2010]. The hemodynamic response represents a summation of large temporal epochs of electrophysiological activity (e.g., 0–500 ms) for both S1 and S2 stimuli. In contrast, electrophysiological studies typically report group differences for very specific and relatively narrow time epochs or even peaks (i.e., EEG: P50 and N100; MEG: M50 and M100). Thus, the relatively small epochs of observable group differences observed in electrophysiological data may be diminished in the summed hemodynamic response.
Alternatively, group differences in other factors such as nonlinearities in neurovascular coupling, cerebral blood flow, volume, and cerebral metabolic rate of oxygen, could also have contributed to the negative results. Finally, there is a high correlation between hemodynamic responses and local field oscillations in the high gamma frequency range, suggesting that the hemodynamic response is heavily dependent on neuronal synchronization [Niessing et al., 2005]. Similarly, there have been several reports of abnormalities in both prestimulus and stimulus‐locked theta and gamma activity in SP compared to controls [Brockhaus‐Dumke et al., 2008a; Gandal et al., 2012]. Therefore, future studies on sensory gating should collect simultaneous EEG and fMRI data to help resolve some of the ambiguities between electrophysiological and hemodynamic activity [Bak et al., 2011].
Current null findings also stand in contrast to a previous fMRI study that reported hyperactivation in DLPFC, hippocampus, and thalamus for SP relative to HC during a priori ROI analyses [Tregellas et al., 2007]. In addition, it is notable that voxel‐wise comparisons of the hemodynamic gating response were negative both in current and previous studies, suggesting that discrepancies in ROI results may have been driven by several methodological differences. Foremost, Tregellas et al. 2007 used a stimulus train (nine rapidly presented clicks) rather than the traditional two‐stimulus paradigm. Therefore, relatively small differences in the hemodynamic sensory gating response may have become more robust as a result of summing across nine rather than two stimuli. However, using a blocked design introduces limitations about the interpretation of the gating response secondary to the shorter ITI. Second, the magnitude of electrophysiological differences in sensory gating may be partially dependent on experimental settings [de Wilde et al., 2007; Light et al., 2000; Turetsky et al., 2009]. Previous studies that required participants to attend to the visual modality [Tregellas et al., 2007] or presented stimuli in blocks [Boutros et al., 1999] may have disengaged attention mechanisms more for auditory stimuli, which may be a requisite for observing abnormal gating responses. In contrast, although participants passively listened to auditory stimuli in current experiment, the stimuli were presented in a randomized design and the switching between conditions may have resulted in an orienting response even during the IT tones condition.
Tregellas et al. 2007 also used a clustered volume acquisition to acquire the data in complete silence, whereas we used a standard EPI pulse sequence, which may have reduced the magnitude of the gating response to the paired‐tones conditions. Although this is a limitation of current study, the explanation is not very compelling given that both SP and HC exhibited a robust response in the auditory cortex to the paired and single‐tone stimuli. Moreover, the choice of a standard EPI sequence rather than a clustered volume technique was intentional in the current study, as we were interested in specifically modeling the HRF through deconvolution [Mayer et al., 2009], which is not possible in clustered acquisition schemes as a result of longer TRs. Nonetheless, future research on the hemodynamic gating response in SP may also consider a different sensory modality for measuring gating effects [Bak et al., 2011].
There is also some debate as to whether electrophysiological abnormalities during sensory gating result from group differences in response variability rather than amplitude [Jin et al., 1997; Patterson et al., 2000]. Similarly, current results indicated an abnormal HRF for SP in the auditory cortex during both IT and NT conditions. Specifically, patients' auditory HRF required several additional seconds to return to baseline and the poststimulus undershoot was essentially absent. In addition, the full‐width at half maximum of the HRF appeared to be wider in SP relative to HC for the NT condition. Alterations in basic HRF properties such as an increased delay [Ford et al., 2005] and differences in the onset transient [Fox et al., 2005] have previously been reported in the HRF of SP by some but not all investigators [Barch et al., 2003], and may be secondary to disease‐related vascular differences altering blood flow/volume, direct neuronal pathology, neuronal pathology resulting from secondary disease characteristics (e.g., increased smoking in SP), and/or medication effects. Regardless of etiology, current and previous [Ford et al., 2005; Fox et al., 2005] results argue for caution when interpreting results from methods that assume similar HRF shapes across patient and control groups (i.e., convolving stimulus timecourses with a “canonical” HRF), even during relatively simple tasks.
A recent meta‐analysis indicated that group differences in S1 may be minimal relative to the S2 response [Chang et al., 2011], whereas others report that a reduced S1 response (i.e., hypoactivation) directly contributes to observed gating deficits during the construction of ratios [Clementz and Blumenfeld, 2001; Johannesen et al., 2005; Smith et al., 2010]. Our single‐tone conditions were designed to serve as a hemodynamic analog of the S1 response, and we predicted that there would not be significant group differences to these basic auditory stimuli. However, results indicated an increased (peak) and/or more prolonged (late) hemodynamic response for SP relative to HC within thalamus, bilateral precentral gyri, bilateral auditory cortex, bilateral anterior insula/VLPFC, and right postcentral gyri/inferior parietal regions in response to the single tones. Multiple regression analyses indicated that potential confounds such as medication load [Gardner et al., 2010], patient symptoms, or levels of cognitive functioning (domains of attention/inhibition, working memory, and executive functioning) did not explain the increased activation in these regions for the patient group.
Previous studies have reported patient hyperactivation in response to click trains [Tregellas et al., 2007], urban white noise [Tregellas et al., 2009], working memory demands [Kim et al., 2010; Manoach et al., 1999], and inhibitory tasks [Arce et al., 2006], which has been interpreted to be indicative of neuronal inefficiency, inhibitory failure, or compensatory mechanisms. Current results indicate that the pattern of increased/prolonged activation was more prevalent for the 2,000 Hz single tone, which was the tone that was presented first in the majority of trials (approximately 75%). Therefore, current findings provide preliminary data suggesting that differences in neuronal hyperexcitability in SP may extend to even more basic sensory stimuli such as a single tone. Finally, the combination of increased/prolonged patient activation coupled with a more canonical HRF for controls (i.e., intact postundershoot) may suggest a role for more basic differences in the neurovascular response. Regardless of etiology, the group‐wise differences in the single‐tone response precluded the formation of an estimated gating response as has previously been done in our study involving only HC [Mayer et al., 2009].
There are several additional limitations to the current study that should be noted. First, due to power issues (seven females), we were not able to assess the effects of gender on the hemodynamic gating response. Similarly, due to the relatively small number of smokers and our collected measurements (Fagerstrom rather than pack history), we were not able to carefully examine the effect of smoking history. Second, the current experiment only included approximately 20 trials per condition, which may have slightly reduced our power to detect group differences. Third, our selected sound intensity level may not have been optimal for detecting group differences [Griffith et al., 1995]. Finally, a portion of our trials were based on ITIs of 6 s, which may not have permitted adequate time to promote a full recovery of the gating response.
In conclusion, current and previous [Tregellas et al., 2007] results suggest that differences in the hemodynamic auditory gating response are likely to be relatively small between SP and HC. These differences may only become significant in paradigms involving repetitive stimulation (e.g., more than two stimuli) that increases detection power [Liu, 2004], paradigms that involve a different sensory modality, or when using techniques that rely on spatial averaging (ROI analyses) rather than voxel‐wise comparisons.
Supporting information
Supporting Information Figure 1
Acknowledgments
The authors thank Diana South, Cathy Smith, and George Malloy for help in data collection. The authors also thank Dr. Robert Freedman for helpful comments on the manuscript.
REFERENCES
- Adler LE, Freedman R, Ross RG, Olincy A, Waldo MC (1999): Elementary phenotypes in the neurobiological and genetic study of schizophrenia. Biol Psychiatry 46:8–18. [DOI] [PubMed] [Google Scholar]
- Adler LE, Pachtman E, Franks RD, Pecevich M, Waldo MC, Freedman R (1982): Neurophysiological evidence for a defect in neuronal mechanisms involved in sensory gating in schizophrenia. Biol Psychiatry 17:639–654. [PubMed] [Google Scholar]
- Arce E, Leland DS, Miller DA, Simmons AN, Winternheimer KC, Paulus MP (2006): Individuals with schizophrenia present hypo‐ and hyperactivation during implicit cueing in an inhibitory task. Neuroimage 32:704–713. [DOI] [PubMed] [Google Scholar]
- Bak N, Glenthoj BY, Rostrup E, Larsson HB, Oranje B (2011): Source localization of sensory gating: A combined EEG and fMRI study in healthy volunteers. Neuroimage 54:2711–2718. [DOI] [PubMed] [Google Scholar]
- Barch DM, Mathews JR, Buckner RL, Maccotta L, Csernansky JG, Snyder AZ (2003): Hemodynamic responses in visual, motor, and somatosensory cortices in schizophrenia. Neuroimage 20:1884–1893. [DOI] [PubMed] [Google Scholar]
- Boutros NN, Belger A, Campbell D, D'Souza C, Krystal J (1999): Comparison of four components of sensory gating in schizophrenia and normal subjects: a preliminary report. Psychiatry Res 88:119–130. [DOI] [PubMed] [Google Scholar]
- Boutros NN, Gelernter J, Gooding DC, Cubells J, Young A, Krystal JH, et al. (2002): Sensory gating and psychosis vulnerability in cocaine‐dependent individuals: preliminary data. Biol Psychiatry 51:683–686. [DOI] [PubMed] [Google Scholar]
- Boutros NN, Mears R, Pflieger ME, Moxon KA, Ludowig E, Rosburg T (2008): Sensory gating in the human hippocampal and rhinal regions: regional differences. Hippocampus 18:310–316. [DOI] [PubMed] [Google Scholar]
- Brockhaus‐Dumke A, Mueller R, Faigle U, Klosterkoetter J (2008a) Sensory gating revisited: Relation between brain oscillations and auditory evoked potentials in schizophrenia. Schizophr Res 99:238–249. [DOI] [PubMed] [Google Scholar]
- Brockhaus‐Dumke A, Schultze‐Lutter F, Mueller R, Tendolkar I, Bechdolf A, Pukrop R, et al. (2008b): Sensory gating in schizophrenia: P50 and N100 gating in antipsychotic‐free subjects at risk, first‐episode, and chronic patients. Biol Psychiatry 64:376–384. [DOI] [PubMed] [Google Scholar]
- Burock MA, Buckner RL, Woldorff MG, Rosen BR, Dale AM (1998): Randomized event‐related experimental designs allow for extremely rapid presentation rates using functional MRI. Neuroreport 9:3735–3739. [DOI] [PubMed] [Google Scholar]
- Chang WP, Arfken CL, Sangal MP, Boutros NN (2011): Probing the relative contribution of the first and second responses to sensory gating indices: A meta‐analysis. Psychophysiology 48:980–992. [DOI] [PubMed] [Google Scholar]
- Clementz BA, Blumenfeld LD (2001): Multichannel electroencephalographic assessment of auditory evoked response suppression in schizophrenia. Exp Brain Res 139:377–390. [DOI] [PubMed] [Google Scholar]
- de Wilde OM, Bour LJ, Dingemans PM, Koelman JH, Linszen DH (2007): A meta‐analysis of P50 studies in patients with schizophrenia and relatives: Differences in methodology between research groups. Schizophr Res 97:137–151. [DOI] [PubMed] [Google Scholar]
- Ford JM, Johnson MB, Whitfield SL, Faustman WO, Mathalon DH (2005): Delayed hemodynamic responses in schizophrenia. Neuroimage 26:922–931. [DOI] [PubMed] [Google Scholar]
- Fox MD, Snyder AZ, McAvoy MP, Barch DM, Raichle ME (2005): The BOLD onset transient: Identification of novel functional differences in schizophrenia. Neuroimage 25:771–782. [DOI] [PubMed] [Google Scholar]
- Freedman R, Adler LE, Gerhardt GA, Waldo M, Baker N, Rose GM, et al. (1987): Neurobiological studies of sensory gating in schizophrenia. Schizophr Bull 13:669–678. [DOI] [PubMed] [Google Scholar]
- Freedman R, Adler LE, Myles‐Worsley M, Nagamoto HT, Miller C, Kisley M, et al. (1996): Inhibitory gating of an evoked response to repeated auditory stimuli in schizophrenic and normal subjects. Human recordings, computer simulation, and an animal model. Arch Gen Psychiatry 53:1114–1121. [DOI] [PubMed] [Google Scholar]
- Freedman R, Olincy A, Ross RG, Waldo MC, Stevens KE, Adler LE, et al. (2003): The genetics of sensory gating deficits in schizophrenia. Curr Psychiatry Rep 5:155–161. [DOI] [PubMed] [Google Scholar]
- Gandal MJ, Edgar JC, Klook K, Siegel SJ (2012): Gamma synchrony: Towards a translational biomarker for the treatment‐resistant symptoms of schizophrenia. Neuropharmacology 62:1504–1518. [DOI] [PMC free article] [PubMed] [Google Scholar]
- Garcia‐Rill E, Moran K, Garcia J, Findley WM, Walton K, Strotman B, et al. (2008): Magnetic sources of the M50 response are localized to frontal cortex. Clin Neurophysiol 119:388–398. [DOI] [PMC free article] [PubMed] [Google Scholar]
- Gardner DM, Murphy AL, O'Donnell H, Centorrino F, Baldessarini RJ (2010): International consensus study of antipsychotic dosing. Am J Psychiatry 167:686–693. [DOI] [PubMed] [Google Scholar]
- Gjini K, Arfken C, Boutros NN (2010): Relationships between sensory “gating out” and sensory “gating in” of auditory evoked potentials in schizophrenia: A pilot study. Schizophr Res 121:139–145. [DOI] [PMC free article] [PubMed] [Google Scholar]
- Griffith J, Hoffer LD, Adler LE, Zerbe GO, Freedman R (1995): Effects of sound intensity on a midlatency evoked response to repeated auditory stimuli in schizophrenic and normal subjects. Psychophysiology 32:460–466. [DOI] [PubMed] [Google Scholar]
- Hall MH, Taylor G, Salisbury DF, Levy DL (2011): Sensory gating event‐related potentials and oscillations in schizophrenia patients and their unaffected relatives. Schizophr Bull 37:1187–1199. [DOI] [PMC free article] [PubMed] [Google Scholar]
- Hanlon FM, Thoma RJ, Irwin J, Jones A, Moses SN, Huang M, et al. (2005): Distinct M50 and M100 auditory gating deficits in schizophrenia. Psychophysiology 42:417–427. [DOI] [PubMed] [Google Scholar]
- Jin Y, Potkin SG, Patterson JV, Sandman CA, Hetrick WP, Bunney WE Jr (1997): Effects of P50 temporal variability on sensory gating in schizophrenia. Psychiatry Res 70:71–81. [DOI] [PubMed] [Google Scholar]
- Johannesen JK, Kieffaber PD, O'Donnell BF, Shekhar A, Evans JD, Hetrick WP (2005): Contributions of subtype and spectral frequency analyses to the study of P50 ERP amplitude and suppression in schizophrenia. Schizophr Res 78:269–284. [DOI] [PubMed] [Google Scholar]
- Kim MA, Tura E, Potkin SG, Fallon JH, Manoach DS, Calhoun VD, et al. (2010): Working memory circuitry in schizophrenia shows widespread cortical inefficiency and compensation. Schizophr Res 117:42–51. [DOI] [PMC free article] [PubMed] [Google Scholar]
- Knott V, Millar A, Fisher D (2009): Sensory gating and source analysis of the auditory P50 in low and high suppressors. Neuroimage 44:992–1000. [DOI] [PubMed] [Google Scholar]
- Korzyukov O, Pflieger ME, Wagner M, Bowyer SM, Rosburg T, Sundaresan K, et al. (2007): Generators of the intracranial P50 response in auditory sensory gating. Neuroimage 35:814–826. [DOI] [PMC free article] [PubMed] [Google Scholar]
- Krause M, Hoffmann WE, Hajos M (2003): Auditory sensory gating in hippocampus and reticular thalamic neurons in anesthetized rats. Biol Psychiatry 53:244–253. [DOI] [PubMed] [Google Scholar]
- Light GA, Braff DL (2003): Sensory gating deficits in schizophrenia: Can we parse the effects of medication, nicotine use, and changes in clinical status? Clin Neurosci Res 3:47–54. [Google Scholar]
- Light GA, Geyer MA, Clementz BA, Cadenhead KS, Braff DL (2000): Normal P50 suppression in schizophrenia patients treated with atypical antipsychotic medications. Am J Psychiatry 157:767–771. [DOI] [PubMed] [Google Scholar]
- Liu TT (2004): Efficiency, power, and entropy in event‐related fMRI with multiple trial types. Part II: design of experiments. Neuroimage 21:401–413. [DOI] [PubMed] [Google Scholar]
- Louchart‐de la Chapelle S, Levillain D, Menard JF, Van der EA, Allio G, Haouzir S, et al. (2005): P50 inhibitory gating deficit is correlated with the negative symptomatology of schizophrenia. Psychiatry Res 136:27–34. [DOI] [PubMed] [Google Scholar]
- Manoach DS, Press DZ, Thangaraj V, Searl MM, Goff DC, Halpern E, et al. (1999): Schizophrenic subjects activate dorsolateral prefrontal cortex during a working memory task, as measured by fMRI. Biol Psychiatry 45:1128–1137. [DOI] [PubMed] [Google Scholar]
- Mayer AR, Hanlon FM, Franco AR, Teshiba TM, Thoma RJ, Clark VP, et al. (2009): The neural networks underlying auditory sensory gating. Neuroimage 44:182–189. [DOI] [PMC free article] [PubMed] [Google Scholar]
- Myles‐Worsley M, Ord L, Blailes F, Ngiralmau H, Freedman R (2004): P50 sensory gating in adolescents from a pacific island isolate with elevated risk for schizophrenia. Biol Psychiatry 55:663–667. [DOI] [PubMed] [Google Scholar]
- Niessing J, Ebisch B, Schmidt KE, Niessing M, Singer W, Galuske RA (2005): Hemodynamic signals correlate tightly with synchronized gamma oscillations. Science 309:948–951. [DOI] [PubMed] [Google Scholar]
- Olincy A, Braff DL, Adler LE, Cadenhead KS, Calkins ME, Dobie DJ, et al. (2010): Inhibition of the P50 cerebral evoked response to repeated auditory stimuli: Results from the Consortium on Genetics of Schizophrenia. Schizophr Res 119:175–182. [DOI] [PMC free article] [PubMed] [Google Scholar]
- Patterson JV, Hetrick WP, Boutros NN, Jin Y, Sandman C, Stern H, et al. (2008): P50 sensory gating ratios in schizophrenics and controls: A review and data analysis. Psychiatry Res 158:226–247. [DOI] [PubMed] [Google Scholar]
- Patterson JV, Jin Y, Gierczak M, Hetrick WP, Potkin S, Bunney WE Jr, et al. (2000): Effects of temporal variability on p50 and the gating ratio in schizophrenia: A frequency domain adaptive filter single‐trial analysis. Arch Gen Psychiatry 57:57–64. [DOI] [PubMed] [Google Scholar]
- Smith AK, Edgar JC, Huang M, Lu BY, Thoma RJ, Hanlon FM, et al. (2010): Cognitive abilities and 50‐ and 100‐msec paired‐click processes in schizophrenia. Am J Psychiatry 167:1264–1275. [DOI] [PMC free article] [PubMed] [Google Scholar]
- Thoma RJ, Hanlon FM, Moses SN, Edgar JC, Huang M, Weisend MP, et al. (2003): Lateralization of auditory sensory gating and neuropsychological dysfunction in schizophrenia. Am J Psychiatry 160:1595–1605. [DOI] [PubMed] [Google Scholar]
- Thoma RJ, Hanlon FM, Moses SN, Ricker D, Huang M, Edgar C, et al. (2005): M50 sensory gating predicts negative symptoms in schizophrenia. Schizophr Res 73:311–318. [DOI] [PubMed] [Google Scholar]
- Tregellas JR, Davalos DB, Rojas DC, Waldo MC, Gibson L, Wylie K, et al. (2007): Increased hemodynamic response in the hippocampus, thalamus and prefrontal cortex during abnormal sensory gating in schizophrenia. Schizophr Res 92:262–272. [DOI] [PMC free article] [PubMed] [Google Scholar]
- Tregellas JR, Ellis J, Shatti S, Du YP, Rojas DC (2009): Increased hippocampal, thalamic, and prefrontal hemodynamic response to an urban noise stimulus in schizophrenia. Am J Psychiatry 166:354–360. [DOI] [PMC free article] [PubMed] [Google Scholar]
- Turetsky BI, Bilker WB, Siegel SJ, Kohler CG, Gur RE (2009): Profile of auditory information‐processing deficits in schizophrenia. Psychiatry Res 165:27–37. [DOI] [PMC free article] [PubMed] [Google Scholar]
Associated Data
This section collects any data citations, data availability statements, or supplementary materials included in this article.
Supplementary Materials
Supporting Information Figure 1