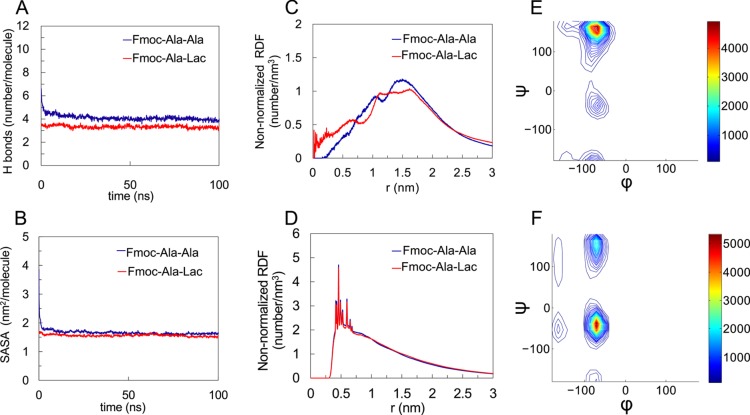
Figure 4.
Computational results characterizing the structural properties of Fmoc-Ala-Ala compared to Fmoc-Ala-Lac. In both systems, the number of hydrogen bonds per molecule (A) and the solvent-accessible surface area (SASA) (B) converge, indicating fibril stability. The non-normalized radial distribution function (RDF) plots of the last 50 ns of each simulation for the distance between the terminal residue’s hydroxyl hydrogen and fibril axis (approximating the radius) (C) and the distance between fluorenyl rings (D) show feature size similarity between Fmoc-Ala-Ala and Fmoc-Ala-Lac systems. For the Fmoc-Ala-Lac fibril assembly, a Ramachandran plot for the alanine (E) during the last 50 ns of simulation shows a large population at (ϕ, ψ) = (−70°, 164°) (indicative of polyproline-II conformation) and a minor population at (ϕ, ψ) = (−70°, −39°). The Ramachandran plot for the terminal Lac residue (F) in Fmoc-Ala-Lac during the last 50 ns of simulation shows a large population at (ϕ, ψ) = (−70°, −39°) (indicative of an α-helix-like conformation) and a minor population at (ϕ, ψ) = (−70°, 148°).

