

Abstract
An ethanolic extract of Artemisia dracunculus L. (PMI-5011) has been observed to decrease glucose and insulin levels in animal models, but the cellular mechanisms by which insulin action is enhanced in vivo is not precisely known. In this study, we evaluated the effects of PMI-5011 to modulate gene expression and cellular signaling through the insulin receptor in skeletal muscle of KK-Ay mice. Eighteen male KK-Ay mice were randomized to a diet (W/W) mixed with PMI-5011 (1%) or diet alone for 8 weeks. Food intake, adiposity, glucose and insulin were assessed over the study, and at study completion, vastus lateralis muscle was obtained to assess insulin signaling parameters and gene expression. Animals randomized to PMI 5011 were shown to have enhanced insulin sensitivity and increased insulin receptor signaling, i.e. IRS-associated PI-3 kinase activity, Akt-1 activity and Akt phosphorylation in skeletal muscle when compared to control animals (P<0.01, P<0.01 and P<0.01 respectively). Gene expression for insulin signaling proteins, i.e. IRS-1, PI-3 Kinase, Glut-4, were not increased although a relative increase in protein abundance was noted with PMI 5011 treatment. Gene expression for specific ubiquitin proteins and specific 20S proteasome activity, in addition to skeletal muscle phosphatase activity, i.e. PTP1B activity, were significantly decreased in mice randomized to PMI 5011 relative to control. Thus, the data demonstrate that PMI 5011 increases insulin sensitivity and enhances insulin receptor signaling in an animal model of insulin resistance. PMI 5011 may modulate skeletal muscle protein degradation and phosphatase activity as a possible mode of action.
Keywords: muscle, insulin signaling, nutrition, botanicals
1. Introduction
Insulin resistance is a key pathophysiologic feature of obesity and type 2 diabetes and is strongly associated with co-existing cardiovascular risk factors and accelerated atherosclerosis (1,2). As such, enhancing insulin sensitivity is a primary strategy to improve metabolic control in subjects with Type 2 diabetes. In this regard, lifestyle intervention, i.e. caloric restriction and enhanced physical activity, greatly improves insulin resistance and glycemic control. Unfortunately, the success of lifestyle intervention in humans over a chronic period is poor. As such, pharmacologic intervention is required in the large majority of cases, but recent data has questioned the safety of the current pharmacologic approaches to improve insulin resistance (3, 4). As such, there has been great interest in plant extracts (botanicals) as a source for alternative therapy for chronic diseases, as historically plants have been a rich source of medicinal compounds for many indications, including diabetes (5). Specifically, one of the most common anti-diabetic agents used worldwide today, i.e. metformin, was shown to be derived from a chemical isolated from a plant (6). Unfortunately, most nutritional supplements, especially those from botanical sources, have not been shown to have a precise mechanism of action and may lack definitive efficacy data in regards to gluco-regulation (7). Thus, there is considerable controversy regarding the use of botanical supplements for human health in general, and on carbohydrate metabolism in particular.
There are a number of botanicals that have shown promise as effective therapies for human conditions. In particular, there are reports about use of plants from the genus Artemisia as a traditional treatment for diabetes (8). Artemisia dracunculus L. or Russian tarragon is a perennial herb with a long history of medicinal and culinary use. Recently, the ethanolic extract of A. dracunculus L. was shown to significantly decrease blood glucose levels and improve insulin levels in both genetic and chemically induced murine models (9,10). In addition, we reported a proposed cellular mechanism by which A. dracunculus L. may improve insulin action by demonstrating enhanced insulin signaling through the insulin receptor in primary human skeletal muscle culture exposed to specific concentrations of the extract (11). Finally, a number of bioactive compounds have been identified in A. dracuculus L. that have specific effects on in vitro mechanisms contributing to gluco-regulation (5, 12-14). Despite the mechanisms reported from in vitro studies, an operative cellular mechanism of action in vivo has yet to be determined for the extract of A. dracunculus L. To evaluate the potential mechanism by which any nutritional intervention enhances insulin action would require investigation at multiple tissues in vivo as coordinated mechanisms from liver, adipocytes and skeletal muscle all contribute to whole body glucose disposal. Yet, analysis of skeletal muscle insulin signaling and transcriptional regulation after a specified period of treatment would be an important step given that skeletal muscle is the major site of insulin action. Thus, the overall objective of this study was to evaluate the effect of nutritional supplementation with a well characterized extract of Artemisia dracunculus L. on insulin receptor signaling and gene expression in skeletal muscle in an insulin resistant animal model, i.e. KKay mouse
2. Materials and Methods
2.1 Study Design
The effect of an alcoholic extract of Artemisia dracunculus L (termed PMI 5011) on in vivo metabolic parameters and on the effect to modulate cellular insulin signaling and transcriptional regulation in skeletal muscle was evaluated for the KK.Cg-Ay/J mouse model (hereafter referred to as KK-Ay). KK.Cg-Ay/J heterozygotes develop hyperglycemia, hyperinsulinemia, glucose intolerance and obesity by 8 weeks of age, attributable to ectopic expression of the agouti gene product (15). The study evaluated 18 singly-housed KK-Ay mice randomly assigned to one of two groups (treatment with PMI 5011 or control) that were matched for body weight, adiposity and 4 hr fasted circulating glucose. At end of study, skeletal muscle (vastus lateralis) was obtained so as to assess insulin signaling, metabolic parameters in muscle and transcriptional regulation. The design of the trial is shown in Figure 1.
Figure 1.

Schematic demonstrating study design and specific parameters assessed.
2.2 Preparation, Source and Characterization of Extract
Detailed information about the sourcing, growing conditions, quality control, stability, biochemical characterization and specific preparation of the Artemisia dracunculus L. extract (PMI 5011) tested in this study has been extensively reported (5, 9 – 14). In brief, the Artemisia dracunculus L. extract was produced from plants grown hydroponically in greenhouses maintained under uniform and strictly controlled conditions, thereby standardizing the plants for their phytochemical content. The extract has been extensively characterized through the isolation of active components by activity guided fractionation using in vitro bioassays followed by confirmation in vivo (11-14).
2.3 Animals and Diet
All animal studies were performed with specific approval from the Pennington Biomedical Research Center Institutional Animal Care and Use Committee using mice purchased from the Jackson Laboratory (Bar Harbor, ME). Six-week-old KK-Ay male mice (n=18) were single housed in specific-pathogen free animal rooms maintained at 25°C with a 12 hr light-dark cycle (8am – 8pm) and switched from a Chow diet (Purina 5001) to a defined low fat diet containing 16.8% protein, 4.8% lipid, and 74.3 % carbohydrate (D12329; Research Diets Inc., New Brunswick, NJ). When the mice were 10 weeks of age, the KK-Ay mice were randomly divided into 2 groups: PMI 5011 group (5011; n=9) and control (CON; n=9). The 5011 treatment group was fed ad libitum the same defined low fat diet containing 1% (by weight) of PMI 5011 whereas the control group was fed ad libitum D12329 diet only.
2.4 Metabolic Parameters and Blood Chemistry
Food consumption of all mice and body weight was measured weekly over the 8 week feeding study. Body composition was measured bi-weekly by NMR spectroscopy (Bruckner Minispec). At specified intervals and at the 8 week end of study time point, blood samples of KKAy mice were collected from the orbita of anesthetized animals following a 4 h fasting period. Glucose concentrations were assayed spectrophotometrically using the glucose oxidase-peroxide method (16). Plasma insulin was assessed using a mouse insulin ELISA kit (CV of 3.8%) (Crystal Chem Inc, Downers Grove IL). The index of homeostasis model assessment of insulin resistance, e.g. HOMA (insulin (mU/l) × glucose (mM)/22.5), of each animal was calculated from fasting plasma glucose and insulin concentrations (17). In addition, skeletal muscle tissue (vastus lateralis) was harvested at the study end from mice that had been food restricted for a period of 4 hours (10am – 2pm) immediately prior to euthanasia and had additionally been gavaged with 500 mg/kg PMI-5011 in 2% DMSO or control 2% DMSO as appropriate. Insulin was administered at a dose of 1.5 U/Kg by i.p injection to all of the animals in each group after the 4 hour fast and tissue harvested after 90 minutes in order to obtain skeletal muscle in the insulin stimulated state.
2.5 Tissue Preparation and Protein Content
Skeletal muscle tissue lysates were prepared by dissecting the muscle free of adipose tissue and homogenizing in buffer A (25 mM HEPES, pH 7.4, 1% Nonidet P-40 (NP-40), 137 mM NaCl, 1 mM PMSF, 10 μg/ml aprotinin, 1 μg/ml pepstatin, 5 μg/ml leupeptin) using a PRO 200 homogenizer (PRO Scientific Inc, Oxford, CT). The samples were centrifuged at 14,000 g for 20 minutes at 4°C, and protein content of the supernatant was determined by Bio-Rad protein assay kit (Bio-Rad laboratories, Inc. Hercules, CA). Supernatants (50 μg) were resolved by SDS-PAGE and subjected to immunoblotting using chemiluminescence reagent (PerkinElmer Life Science Inc, Boston, MA) and quantified as described (18,19). Antibodies for insulin substrate-1 and -2 (IRS-1, IRS-2), phosphoinositol-3-kinase protein 85 (p85 of PI 3K), phosph-Akt-(ser473), IR-β subunit, Akt-1 and Akt-2 antibodies were obtained from Upstate Biotech (Lake Placid, NY). Glucose transporter 4 (GLUT4) monoclonal antibody was obtained from R & D systems Inc (Minneapolis, MN) and β-actin from Affinity Bioreagents (Golden, CO). Results of scanning for each gel were normalized by β-actin and the data were presented as Mean ± SEM of fold change in PMI 5011 vs control.
2.6 IRS-1 associated PI-3 kinase activity and Akt phosphorylation
Muscle lysates were subjected to SDS-PAGE as described and probed with anti-total IRS-1 antibody to obtain abundance (18). IRS-1 associated PI-3 kinase activities of the muscle for each mouse was assessed as described and were corrected for protein content (18). Total Akt and pAkt(ser473) were measured using western blot analysis as well, whereas Akt-1 activity post-insulin was performed using commercially available kits (CV = 5.7%)(Upstate, Lake Placid, New York, NY).
2.7 RNA Extraction
Total RNA was extracted from skeletal muscle dissected free of adipose tissue for microarray and real-time quantitative PCR assays as previously described (18). Frozen tissues were placed in a mortar in liquid nitrogen and the tissue was pulverized into powder using a pestle on dry ice. Total RNA was isolated from the tissue powder using TRIZOL reagent (Invitrogen Co, Carlsbad, CA). After DNase I (Invitrogen, Carlsbad, CA) digestion, RNA was further purified with RNeasy Mini Kit (Qiagen Co, Germantown, MD). RNA concentration and quality were measured by RNA 6000 Nano LabChip kit (Agilent technologies, Santa Clara, CA).
2.8 Gene Expression Profiling
Microarray profiling was assessed for individual animals from each group. The The Illumina Sentrix® BeadChip Array Mouse-6 v1.1 containing 45281 oligonucleotide probes (gene-specific 50mer) or extended sequence tag (EST) sequences was used for gene expression profiling. Digoxigenin-UTP labeled cRNA was generated and linearly amplified from 1 μg of total RNA from each sample (Illumina® TotalPrep RNA Amplification Kit, Ambion, Austin, TX). After cRNA was fragmented by heating at 60°C for 30min, 10 μg of cRNA fragments were hybridized at 55 °C for 16hr. Then, chemiluminescence detection, image acquisition and analysis were performed according to the manufacturer's protocol (Illumina Beadarray Reader). Signals were quantified, corrected for background, and final images and feature data were processed.
2.9 Real-Time Quantitative PCR
The primer sequences of candidate genes were designed using Primer Express® Software version 3.0 (Applied Biosystems, Foster, CA). A 1-μg aliquot of total RNA for each sample was reverse-transcribed in a 100-μl reaction volume with a commercial High-Capacity cDNA Archive Kit (Applied Biosystems PE) according to manufacturer's protocol. The quantitative PCR reaction was conducted in 384-well microtiter plates on the ABI Prism Sequence Detector 7900 (Applied Biosystems) with Bio-Rad iTaqTM SYBR Green Supermix with ROX Kits (Hercules, CA). For each sample of each gene, PCR amplification was performed in triplicate with β–actin used as an endogenous control. The mRNA content of each candidate gene was determined simultaneously in paired muscle samples assessed by DNA array analysis. The assay was performed in duplicate.
2.10 Skeletal Muscle Phosphatase Activity
Skeletal muscle lysate was prepared as outlined above and total muscle phosphatase activity was assayed by hydrolysis of p-nitrophenol phosphate (PNPP) as previously described (19). For specific PTP1B activity, PTP1B was immunoprecipitated with specific antibody (Upstate Biotechnology). The immunoprecipitate was incubated in phosphatase reaction buffer (20 mmol/L HEPES, pH 7.4, 150 mmol/L NaCl, 5 mmol/L dithiothreitol, 1 mmol/L PNPP) for 20 min at 37°C. The reaction was stopped with 0.2 mol/L NaOH, and the absorbance at 410 NM_ was measured. The CV for PTP1B activity assay was assessed at 6.3%. The reactions were run in triplicate.
2.11 Skeletal Muscle Proteasome Activity
20S proteasome activity in muscle lysates were measured in duplicate using a 20S Proteasome Activity Assay Kit (Chemicon International Inc, Temecula CA) as previously described (CV = 5.05%)(18). In brief, 20S proteasome chymotrypsin activity was measured by incubating 20 μg of each lysate with a fluorophore 7-Amino-4-methylcoumarin (AMC) labeled peptide substrate LLVY-AMC at 37 °C for 60 min. The free AMC released by proteasome activity was quantified using a 380/460 NM_ filter set in a fluorometer (BioTex, Winooski, VT). Proteasome activity was reported as μM AMC/mg protein/hr. Each sample/substrate combination was measured both in the presence and in the absence of MG132 (10 μM) or epoxomicin (1 μM), a highly specific 20S proteasome inhibitor (BostonBiochem, Cambridge, MA) to account for any non-proteasomal degradation of the substrate.
2.12 Statistical Analysis
The effects of PMI 5011 on the metabolic parameters, cellular signaling and muscle functional parameters were estimated using analysis of covariance (ANCOVA). For gene expression, within-array normalization was done based on housekeeping genes on each array. Global normalization among arrays was accomplished using quantile normalization method (20). ANOVA analysis with Bonferroni adjustment was used for detecting significantly differentiated genes. Differentially expressed genes between 5011 and control groups were determined based on the following criteria: (1) Bonferroni-adjusted p<0.05; (2) fold change PMI 5011 over control group 1.5 or greater. All data analyses were carried out on SAS (Cary, NC). Several public databases including David/Ease, GenMAPP, Panther and GOTM as well as TreeView version 1.6 were used to assess functional gene cluster analysis (21).
3. Results
3.1 Metabolic and Phenotypic Parameters
Animals receiving PMI 5011 supplementation were previously observed to have significant reductions in fasting insulin when compared with control-diet fed animals (10), and had significant improvement in insulin sensitivity compared to control conditions (Figure 2). Specifically, mice fed 1% PMI 5011 mixed with low fat diet had significant increase in HOMA index beginning from week 6 to the end of the study (Week 8) (Figure 2). Interestingly, the improved insulin action was noted without any significant change in body fat composition, body weight or food intake between PMI 5011 fed and control fed animals over the course of study (data not shown).
Figure 2.

Effect of PMI 5011 on insulin sensitivity as measured by HOMA index [insulin (mU/l) × glucose (mM)/22.5)] of each animal (n = 9/group). Data were presented as mean ± SEM, *p <0.01, PMI 5011 vs control.
3.2 Insulin Signaling
Animals randomized to PMI 5011 appeared to have increased skeletal muscle protein abundance of IRS-1, IRS-2, IR β-subunit, PI 3-kinase (p85), and GLUT4 compared to control (Figure 3). Animals randomized to PMI 5011 were noted to have significantly increased signaling through the insulin receptor as evidenced by enhanced insulin stimulated PI-3 kinase activities and Akt phosphorylation (Figure 3 and 4). Insulin stimulated IRS-1 associated PI-3 kinase activities (normalized for protein content) were significantly greater in animals randomized to PMI 5011 (Figure 4A). The significant increase in Akt phosphorylation and activity noted post insulin (Figure 3 and 4B) was observed despite no increase in protein abundance for Akt 1 or Akt 2 in animals randomized to PMI 5011.
Figure 3.
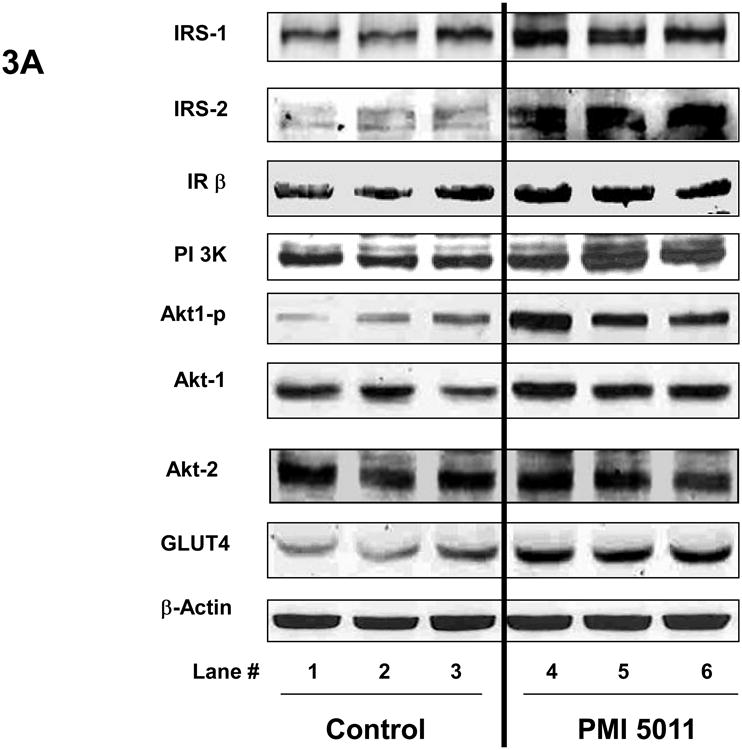

Content of insulin receptor signaling proteins in the mice skeletal muscle obtained at study end as measured by Western blot analysis. Results were normalized by β-actin level. Proteins involved in insulin signaling were detected with specific antibodies as shown in the legends. Lanes 1-3 (Figure 3A) demonstrate representative blots from control animals and Lanes 4-6 (Figure 3A) represent data from animals randomized to PMI 5011. Figure 3B demonstrates relative protein content for signaling proteins shown as mean ± SEM (n=9/group) and expressed as fold change over control. *p<0.05, ** p<0.01 and ***p<0.001, PMI 5011 vs control.
Figure 4.
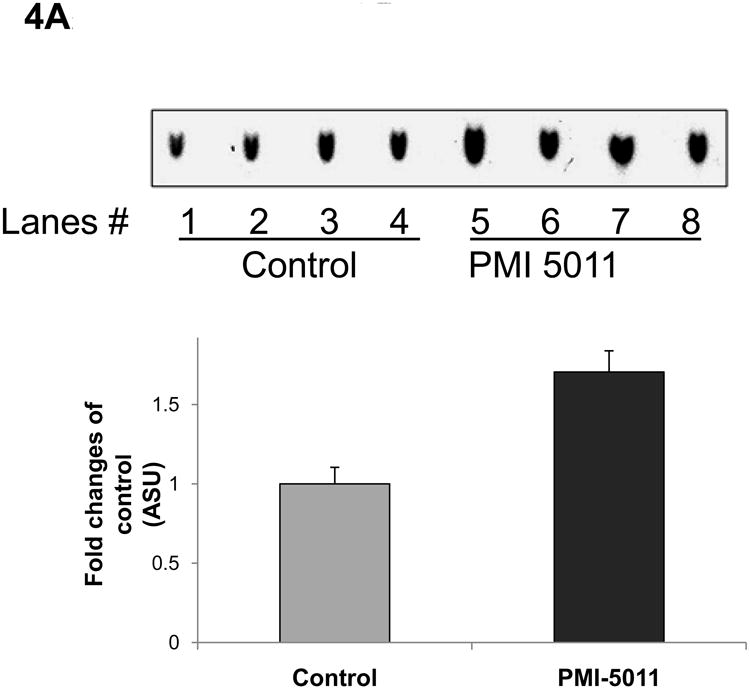

Demonstrates IRS-1 associated PI 3 kinase activity (4A) and Akt-1 activity (4B) in the muscle at study end. Lanes 1-4 (Figure 4A) demonstrate data from control animals and Lanes 5-8 (Figure 4A) represent data from animals randomized to PMI 5011. Data are represented as Mean ± SEM, ** p<0.01, PMI 5011 vs control.
3.3 Microarray Analysis
Gene expression profiles with microarray assay identified 272 genes as significantly differentially expressed with PMI 5011 from 13,006 probes with satisfactory signal quality over all of the array. Significance was determined if the fold-change of the gene was ≥1.5 and p-value was <0.05 for the PMI 5011 treatment as compared to control. Among them, 139 genes were observed to be significantly down-regulated and 133 genes were significantly up-regulated. Using cluster analysis, gene expression differed in 8 categories of biological processes with approx. 25% of the genes involved in either carbohydrate and lipid metabolism or signal transduction (Figure 5). Table 1 and Table 2 lists genes of interest in the skeletal muscle that were either significantly up-regulated or down-regulated with PMI 5011 for each biological process, respectively.
Figure 5.

Percentage of 272 genes modulated by PMI 5011 and sorted by biological process for which fold-change was ≥1.5 and p-value was <0.05 (n = 9 per group).
Table 1. Genes Observed To Be Down-Regulated with PMI 5011.
| Accession | Symbol | Fold change | Gene name |
|---|---|---|---|
| Carbohydrate and lipid metabolism | |||
| NM_007382 | Acadm | -2.72 | acetyl-Coenzyme A dehydrogenase, medium chain |
| NM_007760 | Crat | -2.15 | carnitine acetyltransferase |
| NM_172707 | PPP1cb | -2.14 | protein phosphatase 1, catalytic subunit, beta isoform |
| NM_009464 | Ucp3 | -2.00 | uncoupling protein 3, mitochondrial |
| NM_007381 | Acadl | -1.90 | acetyl-Coenzyme A dehydrogenase, long-chain |
| NM_008256 | Hmgcs2 | -1.83 | 3-hydroxy-3-methylglutaryl-Coenzyme A synthase 2 |
| NM_008155 | Gpi1 | -1.83 | glucose phosphate isomerase 1 |
| NM_025862 | Acad8 | -1.80 | acyl-Coenzyme A dehydrogenase family, member 8 |
| NM_013743 | Pdk4 | -1.77 | Mus musculus pyruvate dehydrogenase kinase, isoenzyme 4 |
| NM_009981 | Pcyt1a | -1.61 | phosphate cytidylyltransferase 1, choline, alpha isoform |
| NM_019637 | Styx | -1.60 | phosphoserine/threonine/tyrosine interaction protein |
| NM_177470 | Acaa2 | -1.54 | acetyl-Coenzyme A acyltransferase 2 |
| NM_007385 | Apoc4 | -1.52 | apolipoprotein C-IV |
| NM_028177 | Ndufab1 | -1.51 | NADH dehydrogenase (ubiquinone)1 |
| Development | |||
| NM_023229 | Fastk | -1.81 | Fas-activated serine/threonine kinase |
| NM_011527 | Tal1 | -1.73 | T-cell acute lymphocytic leukemia 1 |
| NM_009254 | Serpinb6a | -1.69 | serine (or cysteine) proteinase inhibitor, clade B, member 6a |
| NM_010217 | Ctgf | -1.61 | connective tissue growth factor |
| NM_033270 | E2f6 | -1.59 | E2F transcription factor 6 |
| NM_016685 | Comp | -1.59 | cartilage oligomeric matrix protein |
| NM_007440 | Alox12 | -1.56 | arachidonate 12-lipoxygenase |
| Gene with unknown process | |||
| NM_145533 | Smox | -1.71 | spermine oxidase |
| NM_010356 | Gsta3 | -1.67 | glutathione S-transferase, alpha 3 |
| NM_172648 | Ifi205 | -1.64 | interferon activated gene 205 |
| NM_172694 | Egfl5 | -1.55 | EGF-like-domain, multiple 5 (Egfl5), mRNA. |
| Protein metabolism | |||
| NM_007907 | Eef2 | -2.45 | eukaryotic translation elongation factor 2 |
| NM_008974 | Ptp4a2 | -1.88 | protein tyrosine phosphatase 4a2 |
| XM_147230 | Eif4a2 | -1.87 | eukaryotic translation initiation factor 4A2 |
| NM_008910 | Ppm1a | -1.84 | protein phosphatase 1A, magnesium dependent, alpha isoform |
| NM_011361 | Sgk | -2.16 | serum/glucocorticoid regulated kinase |
| NM_023230 | Ube2v1 | -1.97 | ubiquitin-conjugating enzyme E2 variant 1 |
| NM_054093 | Ube3b | -1.90 | ubiquitin protein ligase E3B |
| NM_008974 | Ptp4a2 | -1.88 | protein tyrosine phosphatase 4a2 |
| NM_019562 | Uchl5 | -1.62 | ubiquitin carboxyl-terminal esterase L5 |
| NM_025985 | Ube2g1 | -1.55 | ubiquitin-conjugating enzyme E2G 1 |
| NM_146144 | Usp1 | -1.51 | ubiquitin specific protease 1 |
| NM_024287 | Rab6 | -1.50 | RAB6, member RAS oncogene family |
| Signal transduction | |||
| NM_011085 | Pik3r1 | -1.77 | phosphatidylinositol 3-kinase, regulatory subunit, polypeptide 1 |
| NM_010559 | Il6ra | -1.61 | interleukin 6 receptor, alpha |
| NM_011338 | Ccl9 | -1.57 | chemokine (C-C motif) ligand 9 |
| NM_011160 | Prkg1 | -1.50 | protein kinase, cGMP-dependent, type I |
| Transcriptional regulation | |||
| NM_010931 | Uhrf1 | -2.07 | ubiquitin-like, containing PHD and RING finger domains, 1 |
| NM_013597 | Mef2a | -1.83 | myocyte enhancer factor 2A |
| NM_008991 | Abcd3 | -1.74 | ATP-binding cassette, sub-family D (ALD), member 3 |
| AF061516 | Vamp4 | -1.50 | vesicle-associated membrane protein 4 |
Table 2. Genes Observed To Be Up-Regulated with PMI 5011.
| Accession | Symbol | Fold change | Gene name |
|---|---|---|---|
| Carbohydrate and lipid metabolism | |||
| NM_008797 | Pcx | 1.55 | pyruvate carboxylase |
| NM_008439 | Khk | 1.67 | ketohexokinase |
| NM_153744 | Prkag3 | 1.67 | protein kinase, AMP-activated, gamma 3 non-catatlytic subunit |
| NM_023119 | Eno1 | 1.69 | enolase 1, alpha non-neuron |
| NM_153088 | Ctdsp1 | 1.82 | carboxy-terminal domain, RNA polymerase II, small phosphatase 1 |
| NM_011978 | Slc27a2 | 1.82 | solute carrier family 27 (fatty acid transporter), member 2 |
| NM_021547 | Stard3 | 1.87 | START domain containing 3 |
| NM_013737 | Pla2g7 | 1.89 | phospholipase A2, group VII |
| NM_007621 | Cbr2 | 1.94 | carbonyl reductase 2 |
| Development | |||
| NM_018738 | Igtp | 1.50 | interferon gamma induced GTPase |
| NM_009367 | Tgfb2 | 1.55 | transforming growth factor, beta 2 |
| NM_010736 | Ltbr | 1.59 | lymphotoxin B receptor\ |
| NM_007828 | Dapk3 | 1.62 | death-associated kinase 3 . |
| NM_008107 | Gdf1 | 1.64 | growth differentiation factor 1 |
| NM_008043 | Frat1 | 1.66 | frequently rearranged in advanced T-cell lymphomas |
| NM_008634 | Mtap1b | 1.69 | microtubule-associated protein 1 B |
| NM_010061 | Dnase1 | 1.82 | deoxyribonuclease I |
| NM_018770 | Igsf4a | 1.97 | immunoglobulin superfamily, member 4A |
| NM_133350 | Mapre3 | 1.98 | microtubule-associated protein, RP/EB family, member 3 |
| Gene with unknown process | |||
| NM_010361 | Gstt2 | 1.62 | glutathione S-transferase, theta 2 |
| NM_008161 | Gpx3 | 1.82 | glutathione peroxidase |
| NM_019977 | Aldrl6 | 2.97 | aldehyde reductase (aldose reductase)-like 6 |
| Protein metabolism | |||
| NM_008975 | Ptp4a3 | 1.53 | protein tyrosine phosphatase 4a3 |
| Signal transduction | |||
| NM_008551 | Mapkapk | 2 1.51 | MAP kinase-activated protein kinase 2 |
| NM_019798 | Pde4a | 1.57 | phosphodiesterase 4A, cAMP specific |
| NM_009523 | Wnt4 | 1.63 | wingless-related MMTV integration site 4 |
| NM_028733 | Pacsin3 | 1.64 | protein kinase C and casein kinase substrate in neurons 3 |
| NM_177407 | Camk2a | 1.79 | calcium/calmodulin-dependent protein kinase II alpha . |
| NM_021517 | Pdzk1 | 2.31 | PDZ domain containing 1 |
| Transcriptional regulation | |||
| NM_145434 | Nr1d1 | 2.18 | nuclear receptor subfamily 1, group D, member 1 |
| NM_011680 | Usf2 | 1.54 | upstream transcription factor 2 |
| NM_008815 | Etv4 | 1.54 | ets variant gene 4 (E1A enhancer binding protein, E1AF) |
| NM_019572 | Hdac7a | 1.66 | histone deacetylase 7A |
| NM_013468 | Ankrd1 | 1.69 | ankyrin repeat domain 1 (cardiac muscle) |
| NM_010433 | Hipk2 | 1.78 | homeodomain interacting protein kinase 2 |
| NM_178060 | Thra | 1.93 | thyroid hormone receptor alpha |
| Transportation | |||
| NM_144900 | Atp1a1 | 1.54 | ATPase, Na+/K+ transporting, alpha 1 polypeptide |
| NM_009463 | Ucp1 | 1.77 | uncoupling protein 1, mitochondrial |
| NM_013415 | Atp1b2 | 2.07 | ATPase, Na+/K+ transporting, beta 2 polypeptide |
| NM_007823 | Cyp4b1 | 2.22 | cytochrome P450, family 4, subfamily b, polypeptide 1 |
3.4 Real Time qPCR analysis
To confirm the microarray findings, real time qPCR assays were conducted. In addition to the specific insulin signaling proteins, i.e. IRS-1, IRS-2, PI-3 kinase, etc. evaluated to measure transcription levels using RT-qPCR, an additional twenty one genes involving various biological processes were selected from the microarray analysis (Table 3). Interestingly, for the specific insulin signaling proteins, an increase in gene expression with qPCR was noted for IRS-2 only (Figure 6). For the additional genes selected, 19 were confirmed to have significant changes with PMI 5011 vs control. Two genes such as EGF-like-domain, multiple 5 (Egfl5) and pyruvate carboxylase (Pcx)) were not verified (Table 3).
Table 3. Selected Genes Confirmed by Real-Time PCR.
| Accession | Symbol | Microarray Fold change | qPCR Mean ± SEM | Gene name |
|---|---|---|---|---|
| NM_007382 | Acadm | -2.72 | -1.96 ± 0.07** | acetyl-Coenzyme A dehydrogenase, medium chain |
| NM_007440 | Alox12 | -1.56 | -1.75 ± 0.11* | arachidonate 12-lipoxygenase |
| NM_013415 | Atp1b2 | 2.07 | 2.86 ± 0.05*** | ATPase, Na+/K+ transporting, beta 2 polypeptide |
| NM_177407 | Camk2a | 1.79 | 2.04 ± 0.12* | calcium/calmodulin-dependent protein kinase II alpha |
| NM_172694 | Egfl5 | -1.55 | -1.14 ± 0.17 | EGF-like-domain, multiple 5 (Egfl5), mRNA. |
| NM_023229 | Fastk | -1.81 | 1.71 ± 0.08* | Fas-activated serine/threonine kinase |
| NM_008256 | Hmgcs2 | -1.83 | -1.71± 0.06*** | 3-hydroxy-3-methylglutaryl-Coenzyme A synthase 2 |
| NM_010559 | Il6ra | -1.66 | -4.35 ± 0.03*** | interleukin 6 receptor, alpha |
| NM_008551 | Mapkapk2 | 1.51 | 1.51 ± 0.07* | MAP kinase-activated protein kinase 2 |
| NM_145434 | Nr1d1 | 2.18 | 2.85 ± 0.02*** | nuclear receptor subfamily 1, group D, member 1 |
| NM_008797 | Pcx | 1 .55 | 1.32 ± 0.16 | pyruvate carboxylase (Pcx), mRNA. |
| NM_009981 | Pcyt1a | -1.61 | -1.85 ± 0.08* | phosphate cytidylyltransferase 1,choline, alpha isoform |
| NM_013743 | Pdk4 | -1.77 | -1.72 ± 0.03*** | Mus musculus pyruvate dehydrogenase kinase, isoenzyme 4 |
| NM_011085 | Pik3r1 | -1.77 | -2.13 ± 010** | phosphatidylinositol 3-kinase, regulatory subunit, polypeptide 1 |
| NM_172707 | PPP1cb | -2.14 | -2.04 ± 0.07** | protein phosphatase 1, catalytic subunit, beta isoform |
| NM_153744 | Prkag3 | 1.67 | 1.96 ± 0.08* | protein kinase, AMP-activated, γ 3 non-catatlytic subunit |
| NM_008974 | Ptp4a2 | -1.88 | -5.56 ± 0.07*** | protein tyrosine phosphatase 4a2 |
| NM_011327 | Scp2 | -1.62 | -2.50 ± 0.11** | sterol carrier protein 2, liver |
| NM_021547 | Stard3 | 1.87 | 1.52 ± 0.10* | START domain containing 3 |
| NM_178060 | Thra | 1.93 | 1.73 ± 0.10* | thyroid hormone receptor alpha |
| NM_009464 | Ucp3 | -2.00 | -1.59 ± 0.08* | uncoupling protein 3, mitochondrial |
P<0.05,
P<0.01 and
P<0.001,
PMI 5011 vs control.
Figure 6.

Demonstrates results of gene expression (real time PCR) for specific insulin signaling proteins and selected phosphtases. Data were mean ± SEM (n=5/group) and expressed as fold change over control. *p<0.05, ** p<0.01 PMI-5011 vs control
3.5 Muscle Degradation Studies
Genomic analysis strongly suggested a reduction in gene expression for proteins involved in the ubiquitin-proteasome system degradation, e.g. ubiquitin-conjugating enzyme E2, ubiquitin-conjugating enzyme E2G 1, among others (Table 1). Given our observations that increased gene expression of several insulin signaling proteins, i.e. IRS-1, PI-3 Kinase, were not noted (See Figure 6), yet increased protein content was observed (see Figure 3), skeletal muscle protein degradation was assessed. In general, the majority of intracellular proteins are degraded by the 26S proteasome (22). Given the inhibitory effect of insulin on proteasome-dependent protein degradation (23,24), 20S proteasome activity was assayed in the muscle lysates. 20S proteasome activity in muscle lysates was significantly reduced in the PMI 5011 group when compared to the control group although non-proteasomal degradation measured in the presence of two independent proteasome inhibitors, i.e. MG132 or epoxomicin, was unchanged (Figure 7).
Figure 7.

Demonstrates 20S proteasome activity measured in skeletal muscle at study end in the absence or presence of the proteasome inhibitors MG132 (10 μmol/l) or epoxomicin (1 μmol/l) and performed in duplicate. Data are means ± SEM (n = 9 per group).
3.6 Skeletal Muscle Phosphastases
Microarray data also suggested, and real time PCR confirmed, in many cases an effect of PMI 5011 to modulate skeletal muscle phosphatases (Table 3). Gene expression with real time qPCR assays confirmed a significant reduction in gene expression of several muscle phosphatases, in particular, a specific membrane associated skeletal muscle phosphatase, LAR (Figure 6). Factors that regulate intracellular phosphorylation in skeletal muscle, i.e. phosphatase activity, were examined in order to evaluate if PMI 5011 modulated protein phosphorylation. The data demonstrated that the mice randomized to 5011 had significantly lower skeletal muscle total phosphatase activity, particularly PTP1B activity, when normalized for protein content (Figure 8).
Figure 8.

Demonstrates specific PTP1B activity measures at study end. Data are means ± SEM (n = 9 per group). *p< 0.05 for PMI 5011 vs control
4.0 Discussion
This study demonstrated that nutritional supplementation with a well characterized botanical extract from Artemisia dracunculus L. (PMI 5011) improved insulin action in vivo in an insulin-resistant mouse model by enhancing signaling through the insulin receptor. Specifically, increases in IRS-1 associated PI-3 kinase activity and Akt phosphorylation and activity were observed in vivo in skeletal muscle after insulin stimulation in insulin resistant KKay mice administered PMI-5011 when compared with controls. Although the mechanism(s) for these effects were not precisely defined, genomic analysis combined with functional assays in skeletal muscle suggested that skeletal muscle phosphatase activity and protein degradation are processes that appear to be modulated by this extract when tested for the in vivo condition.
Recent data has provided considerable information regarding the many bioactives that are found in Artemisia dracunculus L. (5, 11-14). As described, the total extract has been shown to decrease blood glucose in hyperglycemic animal models of diabetes and seems to enhance insulin sensitivity as a mode of action (9, 10). Furthermore, based on 3 of the diabetes related activities identified for the extract from in vitro studies and together with activity guided fractionation, 5 active compounds were isolated and recently identified (5, 12-14). The active compounds are comprised of chalcones, i.e., 2′,4′-dihydroxy-4-methoxydihydrochalcone, 2′,4-dihydroxy-4′-methoxydihydrochalcone and davidigenin, in addition to sakuranetin and 6-demethoxycapillarison (5, 12-14). Each of these compounds isolated from the extract of Artemisia dracunculus L. have significant in vitro effects, as demonstrated by activity guided fractionation, on processes contributing to carbohydrate metabolism including inhibiting aldose reductase enzyme, PTB-1B (protein tyrosine phosphatase 1B) activity and expression, or PEPCK overexpression (5, 12-14). Therefore, the activity of the total extract observed in vivo may result from the combined effects of at least 5 different compounds and at least 3 different activities. The precise nature of the interaction of all the bioactives at the whole body level has not yet been elucidated and technical issues in purifying enough of these phytochemicals continues to limit our testing of these compounds in the regulation of insulin action. However, these pre-clinical mechanisms did guide the experiments in the current study as to potential mechanisms operative in vivo.
Enhanced insulin signaling was demonstrated in our study with the finding of increased IRS-1 associated PI-3K activities following insulin stimulation in the muscle tissues in the PMI 5011 group in addition to an increase in Akt phosphorylation. It appeared that the relative amounts of several insulin signaling proteins were increased without a significant effect on gene expression. We recently demonstrated that nutritional interventions such as chronic caloric restriction can have significant effects to promote insulin sensitivity on a whole body level by increasing the relative content of signaling proteins independently of transcriptional regulation (18). The mechanism by which this occurred was demonstrated to be secondary to regulating proteasome degradation of intra-cellular signaling proteins. Thus, based on pre-clinical reports on the mechanism of PMI 5011 and our prior in vivo data with caloric restriction, we sought to perform an initial evaluation on whether proteasomal degradation was modulated by PMI 5011. As reviewed in detail, the proteasome degradation system is composed of two distinct and successive steps, ubiquitin conjugation and proteasome degradation (22). Ubiquitin is first activated by a single ubiquitin-activating enzyme, E1. Following activation, one of several E2 enzymes (ubiquitin-conjugating proteins) transfers ubiquitin from E1 to a member of the ubiquitin-protein ligase family, E3, to which the substrate protein is specifically bound. E3 catalyzes the last step in the conjugation process, covalent attachment of ubiquitin to the substrate (23). Ubiquitin-tagged proteins are then recognized and degraded by the 26S proteasome complex, which consists of the 20S catalytic core complex capped on one or both ends by 19S regulatory complexes (24). The data suggests that PMI 5011 may modulate the ubiquitin-proteasome system in our animal model of insulin resistance, i.e. Kkay mouse, based on both functional assays and genomic analysis. Specfically, skeletal muscle from animals randomized to PMI 5011 were demonstrated to have decreased 20S proteasome activity (Figure 7) and reduced gene expression of specific proteins as part of the ubiquitin-proteasome system in skeletal muscle (Table 1).
The effect of PMI 5011 to modulate skeletal muscle phosphatases was evaluated in this study, and as a follow up to observations reported from in vitro data for this extract (5, 11). Phophatases are particularly important in cellular insulin signaling as protein tyrosine phosphorylation within the cell is controlled through coordinated actions of both protein tyrosine kinases (PTK) and phosphatases (PTP) (25, 26). A disturbance of the normal balance between PTK and PTP function results in aberrant tyrosine phosphorylation and is implicated in the etiology of a number of human diseases, including diabetes (27-29). PTPases comprise an extensive family of homologous enzymes that regulate various events in cellular signal transduction and have included receptors such as PTPalpha and PTPepsilon, leukocyte antigen-related (LAR), TC-PCP, and PTP1B (25-29). In general, two broad categories for PTPases have been described and consist of intracellular and transmembrane types (30). The prototypical intracellular PTPase would be PTP1B. Leukocyte antigen-related (LAR) represents a prototypical transmembrane PTPase. Both PTP1B and LAR have been implicated as having important roles in the regulation of insulin action and it is now clear that PTPases serve as negative regulators of insulin signaling (25-30). Our data confirms that the modulation of phosphatase activity by PMI 5011 observed in vitro is operative in vivo as we demonstrate that PMI 5011 reduced not only skeletal muscle phosphase activity, but with real time PCR, confirmed an effect to reduce gene expression for several phosphatases, including LAR.
Given the multiple bioactive compounds identified in the Artemisia dracunculus L extract, many molecular targets specifically modulated by the individual bioactive compounds in the extract may be responsible for the overall metabolic effects observed in the in vivo condition. Our prior work has demonstrated that the bioactives of Artemisia dracunulus L. appear to have the best efficacy in vivo when studied in the presence of insulin, and our current study was designed to extend those findings. Specifically, we have reported that treatment with Artemisia dracunulus L. demonstrated more robust effects on 2 deoxyglucose uptake, glycogen synthesis and insulin signaling parameters in insulinstimulated states as compared to basal conditions (11). In addition, our recent proteomic studies did not demonstrate that Artemisia dracunulus L. increased insulin-receptor, IRS proteins or PI-3 kinase abundance in basal conditions (31). Finally, our in vivo work also suggested the best efficacy for Artemisia dracunulus L., as compared to control conditions, was noted at the 90 minute time point for metabolic testing (9). Thus, these factors provided the rationale for the current study design evaluating cellular mechanisms in the in vivo insulin stimulated state. However, the research reported in this manuscript did not test individual components of the extract, but proposed to test the whole extract for mechanisms operative in vivo, since the consumption of the total extract and the resulting effect is a clinically important question. In order to precisely define which component was responsible for the overall clinical effect, i.e. in vivo effect, the total plant extract or mixtures of the suggested bioactive phytochemicals in the extract must be tested side by side with the single bioactive compounds to see which one has greater bioactivity. Only then can clear conclusions be made as to whether or not the in vivo effect was a result of one bioactive or a mixture of bioactives that may intensify the potency of a single bioactive product or act synergistically.
In summary, our data demonstrates that a well characterized botanical extract from Artemisia dracunculus L. (PMI 5011) enhances insulin sensitivity and insulin receptor signaling in an insulin resistant animal model. Although the precise mechanism is not known, both genomic analysis and functional assays suggest that the cellular mechanism operative in vivo to enhance cellular signaling may be secondary to the modulation of skeletal muscle phosphatase activity and protein degradation. The precise mechanisms for these effects are the focus of ongoing and planned investigation.
Acknowledgments
Supported by P50AT002776-01 from the National Center for Complementary and Alternative Medicine (NCCAM) and the Office of Dietary Supplements (ODS) which funds the Botanical Research Center of Pennington Biomedical Research Center and The Biotech Center of Rutgers University. This project used Genomics Core facilities that are supported in part by COBRE (NIH P20-RR021945) and CNRU (NIH 1P30-DK072476) center grants from the National Institutes of Health.
Abbreviations
- Glut-4
glucose transporter 4
- IRS-1
IRS-2, insulin substrate-1 and -2
- PI-3 K
phosphoinositol-3-kinase
- PTP1B
protein tyrosine phosphatase 1B
Footnotes
Publisher's Disclaimer: This is a PDF file of an unedited manuscript that has been accepted for publication. As a service to our customers we are providing this early version of the manuscript. The manuscript will undergo copyediting, typesetting, and review of the resulting proof before it is published in its final citable form. Please note that during the production process errors may be discovered which could affect the content, and all legal disclaimers that apply to the journal pertain.
References
- 1.Haffner SM. Impaired glucose tolerance, insulin resistance and cardiovascular disease. Diabet Med. 1997;14(3):S12–8. doi: 10.1002/(sici)1096-9136(199708)14:3+<s12::aid-dia439>3.3.co;2-g. [DOI] [PubMed] [Google Scholar]
- 2.Bonora E. The metabolic syndrome and cardiovascular disease. Ann Med. 2006;38(1):64–80. doi: 10.1080/07853890500401234. [DOI] [PubMed] [Google Scholar]
- 3.Riddle MC. Glycemic management of type 2 diabetes: an emerging strategy with oral agents, insulins and combinations. Endocrinol Metab Clin North Am. 2005;34:77–98. doi: 10.1016/j.ecl.2004.12.002. [DOI] [PubMed] [Google Scholar]
- 4.Stafylas PC, Sarafidis PA, Lasaridis AN. The controversial effects of thiazolidinediones on cardiovascular morbidity and mortality. Int J Cardiol. 2009;131(3):298–304. doi: 10.1016/j.ijcard.2008.06.005. [DOI] [PubMed] [Google Scholar]
- 5.Schmidt B, Ribnicky DM, Poulev A, Logendra S, Cefalu WT, Raskin I. A natural history of botanical therapeutics. Metabolism. 2008;57(7 suppl 1):S3–9. doi: 10.1016/j.metabol.2008.03.001. [DOI] [PMC free article] [PubMed] [Google Scholar]
- 6.Cusi K, DeFronzo RA. Metformin: a review of its metabolic effects. Diabetes Rev. 1998;6:89–131. [Google Scholar]
- 7.Cefalu WT, Brantley PJ. Botanicals and cardiometabolic risk: positioning science to address the hype. Metabolism. 2008;57(7 suppl 1):S1–2. doi: 10.1016/j.metabol.2008.04.002. [DOI] [PMC free article] [PubMed] [Google Scholar]
- 8.Swanston-Flatt SK, Flatt PR, Day C, Bailey CJ. Traditional dietary adjuncts for the treatment of Diabetes Mellitus. Proceedings of the Nutrition Society. 1991;50:641–651. doi: 10.1079/pns19910077. [DOI] [PubMed] [Google Scholar]
- 9.Ribnicky DM, Poulev A, Watford M, Cefalu WT, Raskin I. Antihyperglycemic Activity of TARRALIN™, an Ethanolic Extract of Artemisia dracunculus L. Phytomedicine. 2006;13:550–557. doi: 10.1016/j.phymed.2005.09.007. [DOI] [PubMed] [Google Scholar]
- 10.Zuberi AR. Strategies for assessment of botanical action on metabolic syndrome in the mouse and evidence for a genotype-specific effect of Russian tarragon in the regulation of insulin sensitivity. Metabolism. 2008;57(7 Suppl 1):S10–5. doi: 10.1016/j.metabol.2008.03.002. [DOI] [PMC free article] [PubMed] [Google Scholar]
- 11.Wang ZQ, Ribnicky DM, Zhang XH, Raskin I, Yu Y, Cefalu WT. Bioactives of Artemisia dracunculus L enhance cellular signaling in primary human skeletal muscle culture. Metabolism. 2008;57(7):S58–64. doi: 10.1016/j.metabol.2008.04.003. [DOI] [PMC free article] [PubMed] [Google Scholar]
- 12.Logendra S, Ribnicky DM, Yang H, Poulev A, Ma J, Kennelly EJ, Raskin I. Bioassayguided isolation of aldose reductase inhibitors from Artemisia dracunculus. Phytochemistry. 2006;67:1539–46. doi: 10.1016/j.phytochem.2006.05.015. [DOI] [PubMed] [Google Scholar]
- 13.Ribnicky DM, Kuhn P, Poulev A, Logendra S, Zuberi A, Cefalu WT. Raskin Improved absorption and bioactivity of active compounds from an anti-diabetic extract of Artemisia dracunculus L. Int J Pharm. 2009;370(1-2):87–92. doi: 10.1016/j.ijpharm.2008.11.012. [DOI] [PMC free article] [PubMed] [Google Scholar]
- 14.Govorko D, Logendra S, Wang Y, Esposito D, Komarnytsky S, Ribnicky D, Poulev A, Wang Z, Cefalu WT, Raskin I. Polyphenolic compounds from Artemisia dracunculus L. inhibit PEPCK gene expression and gluconeogenesis in an H4IIE hepatoma cell line. Am J Physiol Endocrinol Metab. 2007;293(6):E1503–10. doi: 10.1152/ajpendo.00420.2007. [DOI] [PubMed] [Google Scholar]
- 15.Reddi AS, Camerini-Davalos RA. Hereditary diabetes in the KK mouse: an overview. Adv Exp Med Biol. 1988;246:7–15. doi: 10.1007/978-1-4684-5616-5_2. [DOI] [PubMed] [Google Scholar]
- 16.Sugiura M, Hirano K. A new colorimetric method for determination of serum glucose. Clin Chim Acta. 1977;75:387–391. doi: 10.1016/0009-8981(77)90357-6. [DOI] [PubMed] [Google Scholar]
- 17.Matthews DR, Hosker JP, Rudenski AS, Naylor BA, Treacher DF, Turner RC. Homeostasis model assessment: insulin resistance and beta-cell function from fasting plasma glucose and insulin concentrations in man. Diabetologia. 1985;28:412–419. doi: 10.1007/BF00280883. [DOI] [PubMed] [Google Scholar]
- 18.Wang ZQ, Floyd ZE, Qin J, Liu X, Yu Y, Zhang XH, Wagner JD, Cefalu WT. Modulation of skeletal muscle insulin signaling with chronic caloric restriction in cynomolgus monkeys. Diabetes. 2009;58(7):1488–98. doi: 10.2337/db08-0977. [DOI] [PMC free article] [PubMed] [Google Scholar]
- 19.Wang ZQ, Zhang XH, Russell JC, Hulver M, Cefalu WT. Chromium picolinate enhances skeletal muscle cellular insulin signaling in vivo in obese, insulin-resistant JCR:LA-cp rats. J Nutr. 2006;136(2):415–20. doi: 10.1093/jn/136.2.415. [DOI] [PubMed] [Google Scholar]
- 20.Bolstad BM, Irizarry RA, Astrand M, Speed TP. A Comparison of Normalization Methods for High Density Oligonucleotide Array Data Based on Bias and Variance. Bioinformatics. 2003;19(2):185–193. doi: 10.1093/bioinformatics/19.2.185. [DOI] [PubMed] [Google Scholar]
- 21.Eisen MB, Spellman PT, Brown PO, Botstein D. Cluster analysis and display of genome-wide expression patterns. Proc Natl Acad Sci USA. 1998;95:14863–8. doi: 10.1073/pnas.95.25.14863. [DOI] [PMC free article] [PubMed] [Google Scholar]
- 22.Ciechanover A. The ubiquitin-proteasome pathway: on protein death and cell life. EMBO J. 1998;17:7151–7160. doi: 10.1093/emboj/17.24.7151. [DOI] [PMC free article] [PubMed] [Google Scholar]
- 23.Kornitzer D, Ciechanover A. Modes of regulation of ubiquitin-mediated protein degradation. J Cell Physiol. 2001;182:1–11. doi: 10.1002/(SICI)1097-4652(200001)182:1<1::AID-JCP1>3.0.CO;2-V. [DOI] [PubMed] [Google Scholar]
- 24.Voges D, Zwickl P, Baumeister W. The 26S Proteasome: A Molecular Machine Designed for Controlled Proteolysis. Annu Rev Biochem. 1999;68:1015–1068. doi: 10.1146/annurev.biochem.68.1.1015. [DOI] [PubMed] [Google Scholar]
- 25.Dube N, Tremblay ML. Involvement of the small protein tyrosine phosphatases TC-PTP and PTP1B in signal transduction and diseases: from diabetes, obesity to cell cycle, and cancer. Biochim Biophys Acta. 2005;1754(1-2):108–17. doi: 10.1016/j.bbapap.2005.07.030. [DOI] [PubMed] [Google Scholar]
- 26.Goldstein BJ. Protein-tyrosine phosphatase 1B (PTP1B): a novel therapeutic target for type 2 diabetes mellitus, obesity and related states of insulin resistance. Curr Drug Targets Immune Endocr Metabol Disord. 2001;1(3):265–75. doi: 10.2174/1568008013341163. [DOI] [PubMed] [Google Scholar]
- 27.Ahmad F, Azevedo JL, Cortright R, Dohm GL, Goldstein BJ. Alterations in skeletal muscle protein-tyrosine phosphatase activity and expression in insulin-resistant human obesity and diabetes. J Clin Invest. 1997;100(2):449–58. doi: 10.1172/JCI119552. [DOI] [PMC free article] [PubMed] [Google Scholar]
- 28.Worm D, Vinten J, Staehr P, Henriksen JE, Handberg A, Beck-Nielson H. Altered basal and insulin-stimulate phosphotyrosine phosphatase (PTPase) activity in skeletal muscle from NIDDM patients compared with control subjects. Diabetologia. 1996;39:1208–1214. doi: 10.1007/BF02658508. [DOI] [PubMed] [Google Scholar]
- 29.Kusari J, Kenner KA, Suh KI, Hill DE, Henry RR. Skeletal muscle protein tyrosine phosphatase activity and tyrosine phosphatase 1B protein content are associated with insulin action and resistance. J Clin Invest. 1994;93(3):1156–62. doi: 10.1172/JCI117068. [DOI] [PMC free article] [PubMed] [Google Scholar]
- 30.Goldstein BJ. Protein-tyrosine phosphatases: emerging targets for therapeutic intervention in type 2 diabetes and related states of insulin resistance. J Clin Endocrinol Metab. 2002;87(6):2474–80. doi: 10.1210/jcem.87.6.8641. [DOI] [PubMed] [Google Scholar]
- 31.Kheterpal I, Coleman L, Ku G, Wang ZQ, Ribnicky D, Cefalu WT. Regulation of Insulin Action by an Extract of Artemisia dracunculus L. in Primary Human Skeletal Muscle Culture – A Proteomics Approach. Phytotherapy Research. 2010 doi: 10.1002/ptr.3093. In Press. [DOI] [PubMed] [Google Scholar]