

Abstract
Although glucose‐dependent insulinotropic polypeptide (GIP) levels have been characterized previously, GLP‐1 levels in Asians remain unclear. Here, we investigate total and intact levels of GLP‐1, as well as GIP during oral glucose and meal tolerance tests (OGTT and MTT) in Japanese patients with or without type 2 diabetes (T2DM). Seventeen Japanese healthy controls and 18 age‐matched and untreated patients with T2DM of short duration participated in the present study. Fasting levels of total GPL‐1 were similar between the two groups (approximately 15 pM), and intact GLP‐1 levels were considerably low in both groups (less than 1 pM). In both groups, total GLP‐1 reached a peak 30 min after glucose ingestion (30–40 pM), whereas intact GLP‐1 levels remained low with no significant peak. In MTT, total and intact GLP‐1 showed no obvious peak. The current data indicate that intact GLP‐1 levels are considerably low in the Japanese and that meal‐induced enhancement of GLP‐1 secretion is negligible in the Japanese. (J Diabetes Invest, doi: 10.1111/j.2040‐1124.2010.00010.x, 2010)
Keywords: DPP‐4, GIP, GLP‐1
Introduction
Glucagon‐like peptide‐1 (GLP‐1) and glucose‐dependent insulinotropic peptide (GIP) are incretin hormones that are secreted from the gut in response to ingestion of nutrients and stimulate insulin secretion from pancreatic β cells1–3. On secretion, GLP‐1 and GIP undergo rapid processing catalyzed by dipeptidyl peptidase‐4 (DPP‐4) and lose their ability to stimulate insulin secretion1–3. It is, therefore, of great importance to measure not only intact but also total (i.e. intact plus DPP‐4‐processed) forms of incretin hormones to study their secretion and processing in vivo, although assays for intact GLP‐1 and GIP require specific antibodies and have not been widely available4,5.
In healthy Caucasian subjects, incretin hormones contribute to more than half of the overall post‐prandial insulin secretion6–8, whereas a marked reduction in the incretin effect is characteristic of Caucasian patients with type 2 diabetes (T2DM)8,9. Although the precise mechanisms underlying the reduced incretin effect are not fully understood, approximately 20–30% reduction in post‐prandial GLP‐1 response5,8, in addition to the diminished insulinotropic effect of GIP but not GLP‐110, has been reported in Caucasian T2DM patients. Despite negligible GLP‐1 deficiency in some studies11–13, the present findings have led to the creation of GLP‐1‐based therapies, namely GLP‐1 receptor agonists and DPP‐4 inhibitors both of which correct the deficiency of endogenous intact GLP‐1, thereby improving glycemic control in T2DM patients14.
The GLP‐1‐based therapies have been more effective in Japanese T2DM patients than in other ethnicities15–18, suggesting more profound GLP‐1 deficiencies in Japanese T2DM patients. To address this possibility, we measured intact and total levels of GLP‐1 as well as GIP in Japanese T2DM patients and healthy controls in response to glucose or meal ingestions.
Materials and methods
The protocol was approved by the ethics committee of each participating institute and written informed consent was obtained from all participants. A total of 35 subjects participated in the present study, of which 18 patients had T2DM (World Health Organization criteria) of relatively short duration (3.8 ± 0.7 years) and 17 controls did not have T2DM. None of the T2DM patients received any anti‐diabetic drugs before the study. Characteristics of controls and T2DM are summarized in Table 1.
Table 1. Characteristics of healthy controls and patients with type 2 diabetes.
| Control | T2DM | |
|---|---|---|
| n | 17 | 18 |
| Female (%) | 18 | 22 |
| Age (years) | 51 ± 3 | 55 ± 3 |
| BMI (kg/m2) | 22.4 ± 0.6 | 23.9 ± 0.9 |
| HbA1c (%) | 5.2 ± 0.1 | 7.2 ± 0.5** |
| Duration (year) | – | 3.8 ± 0.7 |
| Systolic blood pressure (mmHg) | 120 ± 3 | 124 ± 3 |
| Diastolic blood pressure (mmHg) | 77 ± 2 | 76 ± 2 |
| Total cholesterol (mg/dL) | 187 ± 8 | 205 ± 5 |
| HDL cholesterol (mg/dL) | 58 ± 5 | 58 ± 4 |
| Triglycerides (mg/dL) | 83 ± 8 | 137 ± 5* |
Each value represents the mean ± SEM. BMI, body mass index; HDL, high‐density lipoprotein; T2DM, patients with type 2 diabetes.
*P < 0.01; **P < 0.05.
Participants were subjected to oral glucose and meal tolerance tests (OGTT and MTT) in the morning after an overnight fast on two separate days. For the tests, 75 g of glucose and a Japanese standard meal (480 kcal; carbohydrate:protein:fat = 2.8:1:1) were ingested within 5 and 10 min, respectively. As processing of intact GLP‐1 and GIP by DPP‐4 extinguishes their insulinotropic activities2,3, the present study was designed to measure both intact and total (intact and DPP‐4‐processed) forms of GLP‐1 and GIP. Catheters were placed in cubital veins and blood samples were withdrawn from the catheters directly into BD™ P700 Blood Collection Tubes (BD, Franklin Lakes, NJ, USA) containing a DPP‐4 inhibitor to prevent DPP‐4 processing. Aliquots of plasmas were extracted with ethanol at the final concentration of 70% (vol/vol) and dried extracts were reconstituted in the original volume prior to measuring incretin levels. Recoveries were 75–80% of the expected concentrations for intact and total GLP‐1 added to plasmas before extraction, and 80–85% for intact and total GIP. Volumes of the reconstituted extracts used to measure incretins were as follows: total GLP‐1 300 μL; intact GLP‐1 40 μL; total GIP 150 μL; intact GIP 300 μL. All samples were measured in duplicate. Total GLP‐1 was measured using antiserum 89390 specific for the amidated COOH‐terminus of GLP‐1, and detecting GLP‐1(7–36)amide and GLP‐1 (9–36)amide (detection limit: <1 pM)19. Intact GLP‐1 was measured using a two‐site sandwich enzyme‐linked immunosorbent assay (ELISA) that detects GLP‐1(7–36)amide and GLP‐1(7–37), but not the NH2‐terminally truncated metabolites, using two monoclonal antibodies, the near C‐terminally directed GLP1F5 as a catching antibody and the strictly N‐terminally directed Mab26.1 as a detecting antibody (detection limit, <0.5 pM)5. This assay has 100% cross‐reactivity with GLP‐1 (7–36)amide and 88% with GLP‐1 (7–37), but <0.1% with either GLP‐1 (9–36)amide or GLP‐1 (9–37). Total GIP was measured using the COOH‐terminally directed antiserum R65, reacting with intact GIP and GIP(3–42) but not with 8‐kDa GIP, whose chemical nature and relationship to GIP secretion is uncertain (detection limit, 2 pM)20. Intact, biologically active GIP was measured using antiserum 98171, specific for the intact GIP and cross‐reacting <0.1% with GIP(3–42) (detection limit, 5 pM)4. The intra‐ and inter‐assay variations for intact GIP, total GIP and total GLP‐1 radioimmunoassays were <6% and for intact GLP‐1 ELISA was <5%. Levels of intact GLP‐1 remained under the detection limit throughout the test in 4/15 T2DM/OGTT subjects, 6/17 control/OGTT subjects, 2/12 T2DM/MTT subjects and 3/16 control/MTT subjects. Subjects whose intact GLP‐1 remained under the detection limit throughout the test were included in the current study and immeasurable values were regarded as zero. Proportions of such subjects were similar between the T2DM and the control group. Even when subjects whose intact GLP‐1 remained under the detection limit throughout the test were excluded, levels of intact GLP‐1 showed no significant difference between the T2DM and the control group.
Glucose levels were measured by standard procedures. Area under the curve (AUC) of each measurement was calculated according to the trapezoidal rule. All statistical calculations were carried out using StatView for Windows version 5.0 (SAS Institute, Berkeley, CA, USA). Two‐way anova for repeated measures with post‐hoc analysis was used to analyze time‐course curves. Values at single time‐points were compared by unpaired t‐test. A P value <0.05 was taken to indicate significant differences.
Results
Fasting levels of total GLP‐1 were 15.7 ± 1.0 and 15.5 ± 1.7 pM, and those of intact GLP‐1 were 0.7 ± 0.2 and 0.2 ± 0.1 pM in the control and T2DM groups, respectively. In OGTT, total GLP‐1 reached the peak (40.3 ± 10.4 and 35.3 ± 8.7 pM in the control and T2DM groups) 30 min after glucose was given, whereas intact GLP‐1 levels remained low and showed no significant peak (Figure 1). AUC for total and intact GLP‐1 were similar in the two groups. In MTT, total and intact GLP‐1 showed no obvious peak. AUC for total and intact GLP‐1 were also similar in the two groups. Fasting levels of total GIP were 21.2 ± 2.7 and 29.7 ± 8.0 pM, whereas those of intact GIP were 13.9 ± 2.8 and 13.8.0 ± 2.8 pM in the control and T2DM groups, respectively. In OGTT, total GIP reached the peak (141.7 ± 41.7 and 135.3 ± 36.3 pM in the control and T2DM groups) 30 min after glucose was given, and intact GIP reached the peak (51.2 ± 7.6 and 49.6 ± 8.2 pM in the control and T2DM groups) as early as 10 min after glucose was given. AUC for total and intact GIP in the two groups were similar. In MTT, total and intact GIP reached the peak (total: 183.6 ± 38.7 and 150.0 ± 18.4 pM and intact: 70.3 ± 10.2 and 72.9 ± 6.5 pM in the control and T2DM groups) 30 min after meal ingestion in both the control and T2DM groups. AUC for total and intact GIP were similar in the two groups.
Figure 1.
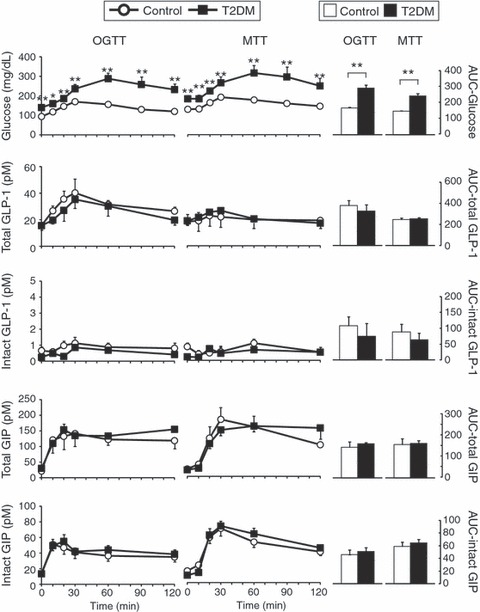
Response of glucagon‐like peptide 1 (GLP‐1) and glucose‐dependent insulinotropic polypeptide (GIP) after ingestion of oral glucose or a meal in Japanese patients with type 2 diabetes (T2DM) and healthy controls (Control). Japanese patients with T2DM and healthy controls were subjected to 75‐g oral glucose and meal tolerance tests (OGTT and MTT). Left, levels of indicated measurements in each time‐point (black squares, T2DM; white circles, control). Right, area under the curve (AUC) for indicated measurements were shown by arbitrary units (black bars, T2DM; white bars, control). Each value represents the mean ± SEM. *P < 0.05 and **P < 0.01 show that levels of T2DM are significantly different (unpaired t‐test) from those of the control group at individual time‐points. Numbers of subjects analyzed for glucose intact GLP‐1 and intact GIP were as follows: T2DM/OGTT, n = 17; T2DM/MTT, n = 12; Control/OGTT, n = 15; Control/MTT, n = 16. Those analyzed for total GLP‐1 and total GIP were as follows: T2DM/OGTT, n = 10; T2DM/MTT, n = 5; Control/OGTT, n = 9; Control/MTT, n = 10.
Discussion
In the present study, we determined total and intact levels of GLP‐1 and GIP in healthy Japanese volunteers and untreated Japanese patients with T2DM of short duration in response to glucose or meal ingestion.
Intact GLP‐1 levels were considerably low in not only the T2DM group but also the healthy volunteers. The very low levels of intact GLP‐1 in the Japanese might be explained by impaired secretion from the gut, accelerated processing by DPP‐4, or both. Intact GLP‐1 levels remained very low despite the significant peak of total GLP‐1 in response to glucose ingestion, suggesting enhanced GLP‐1 processing by DPP‐4. However, the intact versus total ratio of GIP, another DPP‐4 substrate, was much higher than that of GLP‐1, implying that enhanced DPP‐4 processing could be rather selective to GLP‐1. Although GLP‐1 has been shown to be more liable to DPP‐4 processing than GIP4, little is known about the kinetics of GLP‐1 and GIP processing in the Japanese, and needs to be investigated in future to better understand the basis of the selective reduction of intact GLP‐1.
Another important finding is that in the Japanese, the GLP‐1 response after meal ingestion was negligible, despite the robust GIP response. The reduced GLP‐1 response could be explained by meal size as well as meal composition, which was shown to be critical to GLP‐1 response21–23. Regulatory mechanisms of nutrient‐induced GLP‐1 secretion are beginning to be shown24 and further studies might shed light on the reduced meal‐induced GLP‐1 response in the Japanese.
Intact GLP‐1 levels in the Japanese subjects in the current study were significantly lower than those of Caucasians reported previously5,25. Although the same antibodies were used, intact GLP‐1 levels in the Japanese and Caucasian subjects should not be compared because an ethanol extraction step was incorporated in the present study to reduce non‐specific interference in plasma26. Characterizing a potential difference in the intact GLP‐1 levels of Asians and Caucasians should be revisited by utilizing the exact same assay method.
Because there was no significant difference in the GLP‐1 and GIP levels between the T2DM and control groups, incretin deficiency does not account for the reduced insulin response in Japanese T2DM patients in comparison with Japanese healthy volunteers. Nevertheless, the present study clearly showed that intact GLP‐1 levels are considerably low in the Japanese and that GLP‐1 response after ingestion of the Japanese standard meal is negligible in the Japanese, which might have implications for reduced insulin secretory capacity in the Japanese.
Acknowledgement
No potential conflicts of interest relevant to this article were reported.
References
- 1.Drucker DJ. The biology of incretin hormones. Cell Metab 2006; 3: 153–165 [DOI] [PubMed] [Google Scholar]
- 2.Holst JJ. The physiology of glucagon‐like peptide 1. Physiol Rev 2007; 87: 1409–1439 [DOI] [PubMed] [Google Scholar]
- 3.Yamada Y, Miyawaki K, Tsukiyama K, et al.Pancreatic and extrapancreatic effects of gastric inhibitory polypeptide. Diabetes 2006; 55: S86–S91 [Google Scholar]
- 4.Deacon CF, Nauck MA, Meier J, et al.Degradation of endogenous and exogenous gastric inhibitory polypeptide in healthy and in type 2 diabetic subjects as revealed using a new assay for the intact peptide. J Clin Endocrinol Metab 2000; 85: 3575–3581 [DOI] [PubMed] [Google Scholar]
- 5.Vilsboll T, Krarup T, Sonne J, et al.Incretin secretion in relation to meal size and body weight in healthy subjects and people with type 1 and type 2 diabetes mellitus. J Clin Endocrinol Metab 2003; 88: 2706–2713 [DOI] [PubMed] [Google Scholar]
- 6.Nauck MA, Homberger E, Siegel EG, et al.Incretin effects of increasing glucose loads in man calculated from venous insulin and C‐peptide responses. J Clin Endocrinol Metab 1986; 63: 492–498 [DOI] [PubMed] [Google Scholar]
- 7.Shuster LT, Go VL, Rizza RA, et al.Incretin effect due to increased secretion and decreased clearance of insulin in normal humans. Diabetes 1988; 37: 200–203 [DOI] [PubMed] [Google Scholar]
- 8.Muscelli E, Mari A, Casolaro A, et al.Separate impact of obesity and glucose tolerance on the incretin effect in normal subjects and type 2 diabetic patients. Diabetes 2008; 57: 1340–1348 [DOI] [PubMed] [Google Scholar]
- 9.Nauck M, Stockmann F, Ebert R, et al.Reduced incretin effect in type 2 (non‐insulin‐dependent) diabetes. Diabetologia 1986; 29: 46–52 [DOI] [PubMed] [Google Scholar]
- 10.Nauck MA, Heimesaat MM, Orskov C, et al.Preserved incretin activity of glucagon‐like peptide 1 [7‐36 amide] but not of synthetic human gastric inhibitory polypeptide in patients with type‐2 diabetes mellitus. J Clin Invest 1993; 91: 301–307 [DOI] [PMC free article] [PubMed] [Google Scholar]
- 11.Orskov C, Jeppesen J, Madsbad S, et al.Proglucagon products in plasma of noninsulin‐dependent diabetics and nondiabetic controls in the fasting state and after oral glucose and intravenous arginine. J Clin Invest 1991; 87: 415–423 [DOI] [PMC free article] [PubMed] [Google Scholar]
- 12.Ryskjaer J, Deacon CF, Carr RD, et al.Plasma dipeptidyl peptidase‐IV activity in patients with type‐2 diabetes mellitus correlates positively with HbAlc levels, but is not acutely affected by food intake. Eur J Endocrinol 2006; 155: 485–493 [DOI] [PubMed] [Google Scholar]
- 13.Vollmer K, Holst JJ, Baller B, et al.Predictors of incretin concentrations in subjects with normal, impaired, and diabetic glucose tolerance. Diabetes 2008; 57: 678–687 [DOI] [PubMed] [Google Scholar]
- 14.Lovshin JA, Drucker DJ. Incretin‐based therapies for type 2 diabetes mellitus. Nat Rev Endocrinol 2009; 5: 262–269 [DOI] [PubMed] [Google Scholar]
- 15.Amori RE, Lau J, Pittas AG. Efficacy and safety of incretin therapy in type 2 diabetes: systematic review and meta‐analysis. JAMA 2007; 298: 194–206 [DOI] [PubMed] [Google Scholar]
- 16.Kikuchi M, Abe N, Kato M, et al.Vildagliptin dose‐dependently improves glycemic control in Japanese patients with type 2 diabetes mellitus. Diabetes Res Clin Pract 2009; 83: 233–240 [DOI] [PubMed] [Google Scholar]
- 17.Nonaka K, Kakikawa T, Sato A, et al.Efficacy and safety of sitagliptin monotherapy in Japanese patients with type 2 diabetes. Diabetes Res Clin Pract 2008; 79: 291–298 [DOI] [PubMed] [Google Scholar]
- 18.Seino Y, Rasmussen MF, Zdravkovic M, et al.Dose‐dependent improvement in glycemia with once‐daily liraglutide without hypoglycemia or weight gain: a double‐blind, randomized, controlled trial in Japanese patients with type 2 diabetes. Diabetes Res Clin Pract 2008; 81: 161–168 [DOI] [PubMed] [Google Scholar]
- 19.Orskov C, Rabenhoj L, Wettergren A, et al.Tissue and plasma concentrations of amidated and glycine‐extended glucagon‐like peptide I in humans. Diabetes 1994; 43: 535–539 [DOI] [PubMed] [Google Scholar]
- 20.Krarup T, Holst JJ. The heterogeneity of gastric inhibitory polypeptide in porcine and human gastrointestinal mucosa evaluated with five different antisera. Regul Pept 1984; 9: 35–46 [DOI] [PubMed] [Google Scholar]
- 21.Carr RD, Larsen MO, Winzell MS, et al.Incretin and islet hormonal responses to fat and protein ingestion in healthy men. Am J Physiol Endocrinol Metab 2008; 295: E779–E784 [DOI] [PubMed] [Google Scholar]
- 22.Juntunen KS, Niskanen LK, Liukkonen KH, et al.Postprandial glucose, insulin, and incretin responses to grain products in healthy subjects. Am J Clin Nutr 2002; 75: 254–262 [DOI] [PubMed] [Google Scholar]
- 23.Thomsen C, Rasmussen O, Lousen T, et al.Differential effects of saturated and monounsaturated fatty acids on postprandial lipemia and incretin responses in healthy subjects. Am J Clin Nutr 1999; 69: 1135–1143 [DOI] [PubMed] [Google Scholar]
- 24.Tolhurst G, Reimann F, Gribble FM. Nutritional regulation of glucagon‐like peptide‐1 secretion. J Physiol 2009; 587: 27–32 [DOI] [PMC free article] [PubMed] [Google Scholar]
- 25.Meier JJ, Nauck MA, Kranz D, et al.Secretion, degradation, and elimination of glucagon‐like peptide 1 and gastric inhibitory polypeptide in patients with chronic renal insufficiency and healthy control subjects. Diabetes 2004; 53: 654–662 [DOI] [PubMed] [Google Scholar]
- 26.Deacon CF, Holst JJ. Immunoassays for the incretin hormones GIP and GLP‐1. Best Pract Res Clin Endocrinol Metab 2009; 23: 425–432 [DOI] [PubMed] [Google Scholar]