

Abstract
Aims/Introduction: To reveal whether visit‐to‐visit variability in HbA1c is associated with higher risk of cardiovascular disease (CVD) in patients with type 2 diabetes.
Materials and Methods: The study was conducted on 689 Japanese patients with type 2 diabetes [295 women, 394 men; mean (±standard deviations (SD)) age 65 ± 11 years]. Variability in HbA1c was evaluated as the intrapersonal SD of serial measurements of HbA1c during the follow‐up period for at least 12 months. Patients were divided into quartiles according to the SD of HbA1c, and the primary endpoint was defined as incident CVD. Cox’s proportional hazards model was used to calculate hazard ratios (HR) and 95% confidence intervals (CI).
Results: During a median follow‐up period of 3.3 years (range 1.0–6.3 years), 26 ± 14 measurements of HbA1c were obtained per patient and 61 episodes of incident CVD were recorded. The 5‐year cumulative incidence of CVD in patients across the first, second, third, and fourth quartiles of SD in HbA1c was 4.9, 8.7, 17.1, and 26.2%, respectively (P < 0.001, log‐rank test). Multivariate Cox regression analysis revealed that the incidence of CVD was significantly higher in patients in the fourth quartile of SD in HbA1c compared with those in the first quartile (HR 3.38; 95% CI 1.07–10.63; P = 0.039), independent of mean HbA1c and other traditional cardiovascular risk factors.
Conclusions: Variability of HbA1c may be a potent predictor of incident CVD in Japanese patients with type 2 diabetes. (J Diabetes Invest, doi: 10.1111/j.2040‐1124.2011.00155.x, 2011)
Keywords: Cardiovascular disease, HbA1c variability, Type 2 diabetes
Introduction
Patients with diabetes have a two‐ to fourfold increased risk of incident cardiovascular disease (CVD) compared with nondiabetic subjects1–3. Poor glycemic control is associated with a higher risk of both macrovascular4,5 and microvascular6,7 complications in patients with diabetes. Although HbA1c has long been used as the gold standard measure for long‐term glycemic control and the near‐normalization of HbA1c levels is seemingly important to reduce the risk of CVD, recent large randomized control trials have failed to reveal any benefit of intensive glycemic control on CVD outcomes in patients with type 2 diabetes, especially in those with a long disease duration and/or pre‐existing severe cardiovascular complications8–10.
More recently, epidemiological studies in patients with type 1 diabetes11–13 have focused on variations in long‐term glycemic control as a novel risk factor for both micro‐ and macrovascular complications. In those studies, variations in HbA1c were determined as intrapersonal standard deviations (SD) of serially measured HbA1c11,12 or as changes in HbA1c calculated simply by subtracting the baseline value from the final value13. However, whether similar associations exist in patients with type 2 diabetes, as well as in patients who are not Caucasians, remains unknown. Therefore, in the present observational cohort study, we investigated the relationship between fluctuations in HbA1c during the follow‐up period and incident CVD in Japanese patients with type 2 diabetes.
Materials and Methods
The present study was conducted in accordance with the Declaration of Helsinki and was approved by the Tokyo Women’s Medical University School of Medicine Ethics Committee. The dataset used in the present study was that obtained in an earlier cohort study of Japanese patients with type 2 diabetes in which the relationship between chronic kidney disease and silent cerebral infarction was evaluated14. Briefly, patients underwent cranial magnetic resonance imaging (MRI) at the Diabetes Center, Tokyo Women’s Medical University Hospital between July 1, 2003 and April 30, 2008 for screening of silent cerebral infarction. Patients were eligible for inclusion in the present study if they were ≥20 years of age, had an estimated glomerular filtration rate (eGFR) ≥15 mL/min per 1.73 m2, and had been followed‐up for at least 12 months. Patients undergoing renal‐replacement therapy and those with infectious and malignant disease were excluded from the study. World Health Organization criteria were used to diagnose type 2 diabetes15.
A medical history was obtained for all patients. In addition, all patients underwent a physical examination and blood sampling. Information regarding smoking and a family history of CVD was obtained using standard questionnaires. Smoking habits were classified as ‘current smoker’ or ‘nonsmoker’. The physical examination included blood pressure measurement and anthropometry; laboratory examinations included HbA1c, serum lipids, creatinine, urinary albumin in the first morning urine specimen, and ophthalmoscopic examinations. The HbA1c was determined at least three times each year.
A history of CVD was defined as stroke/transient ischemic attack, coronary artery disease (CAD), and peripheral artery disease (PAD). Clinical evidence of CAD was defined as the presence of any of the following: angina pectoris diagnosed by coronary angiography, a history of myocardial infarction, or previous coronary revascularization. A history of PAD was defined according to American College of Cardiology/American Heart Association 2005 guidelines16.
In Japan, HbA1c is measured by HPLC using a set of calibrators assigned by the Japan Diabetes Society (JDS; normal range 4.3–5.8%). Correlational analysis indicates that HbA1c values in Japan are approximately 0.4% lower than those measured by the NGSP. Thus, in the present study, to standardize HbA1c values to NGSP units, 0.4% was added to the measured values and values are expressed as NGSP equivalents (%)17.
For each patient, the intrapersonal mean, SD, and coefficient of variation (CV: the ratio of SD/mean values) of HbA1c were calculated using all measurements obtained during the follow‐up period. To minimize any effect of different numbers of HbA1c measurements on the values calculated, we defined the adjusted SD HbA1c as the SD HbA1c divided by [n/(n– 1)]0.5, where n is the number of HbA1c measurements11. The SD, adjusted SD, and CV of HbA1c were used as indices of variability of HbA1c. Patients were divided into quartiles using each of these indices or mean HbA1c during the follow‐up period.
Urinary albumin was measured using the latex agglutination method and normalized against urinary creatinine. Albuminuria was defined as normoalbuminuria if the albumin/creatinine ratio (ACR) was <30 mg/g, as microalbuminuria if the ACR was 30–299 mg/g, and as macroalbuminuria if the ACR was ≥300 mg/g18. Creatinine was measured by enzymatic methods. The glomerular filtration rate (GFR) was estimated using the following modified three‐variable equation for the Japanese population, as proposed recently by the Japanese Society for Nephrology19:
where SCr is the serum creatinine value, in μmol/L divided by 88.4, and age is in years.
High‐density lipoprotein cholesterol (HDL‐C) was determined enzymatically. Low‐density lipoprotein cholesterol (LDL‐C) was measured by direct methods or calculated using the Friedewald equation when serum triglyceride levels were <4.48 mmol/L20.
Patients were followed‐up until December 2009. The primary endpoint was incident CVD, including stroke (cerebral infarction and hemorrhage) and CAD (myocardial infarction, angina pectoris requiring coronary revascularization, such as by percutaneous coronary intervention or a coronary artery bypass graft). Information regarding CVD was obtained by direct reference to the patients’ medical records by a single investigator (RB).
Statistical Analysis
Data are expressed as the percentage, arithmetic mean ± SD, or geometric mean with 95% confidence intervals (CI), as appropriate according to data distribution. Serum triglycerides and urinary ACR were transformed logarithmically owing to skewed distributions. For statistical analyses, one‐way analysis of variance (anova) was used for between‐group comparisons for continuous variables, whereas the Cochran–Armitage trend test was used for categorical variables. For univariate correlational analysis, Spearman’s correlation coefficients (rs) were calculated.
The cumulative incidence of the primary endpoint was estimated using the Kaplan–Meier method. Hazard ratios (HR) and 95% CI for reaching the endpoint were estimated using univariate and multivariate Cox’s proportional hazards model analysis with a stepwise selection procedure. Covariates incorporated into the model were age; sex; duration of diabetes; the presence of proliferative diabetic retinopathy; smoking status; the use of insulin, renin–angiotensin system inhibitors, antiplatelet agents, and statins; hemoglobin; uric acid; eGFR; urinary ACR at baseline; mean body mass index (BMI); systolic and diastolic blood pressure; triglycerides; HDL‐C and LDL‐C levels during the follow‐up period; and each index of variability of HbA1c (SD, adjusted SD, or CV HbA1c), mean HbA1c, and the number of HbA1c measurements. All statistical analyses were performed using SAS version 9.2 (SAS Institute, Cary, USA). P value <0.05 was considered significant.
Results
Of the 1260 patients with type 2 diabetes undergoing cranial MRI at the Diabetes Center, Tokyo Women’s Medical University Hospital during the period July 1, 2003–April 30, 2008, 689 patients finally had sufficient baseline and follow‐up data to qualify for inclusion in the present study (Figure 1). The 689 patients comprised 295 women and 394 men, with a mean (±SD) age of 65 ± 11 years (range 22–89 years). There were no significant differences in gender distribution or mean age between the 689 patients included in the present study and the 571 patients excluded.
Figure 1.
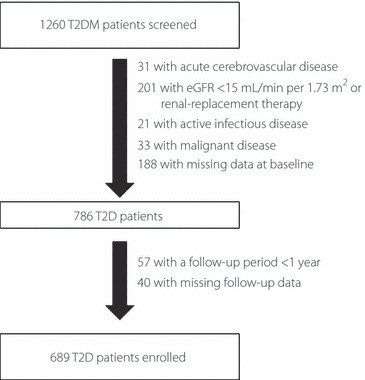
Flowchart of patient recruitment to the study. T2D, type 2 diabetes; eGFR, estimated glomerular filtration rate.
On average, 26 (±14) HbA1c measurements were obtained per patient (8.6 times per patient per year); the intrapersonal mean of serially measured HbA1c was 7.8 ± 1.2%, the SD was 0.65 ± 0.42%, and the CV was 8.0 ± 4.6%. There were significant correlations between mean HbA1c and SD HbA1c (rs = 0.57, P < 0.001; Figure 2a) and between mean HbA1c and CV HbA1c (rs = 0.40, P < 0.001; Figure 2b).
Figure 2.
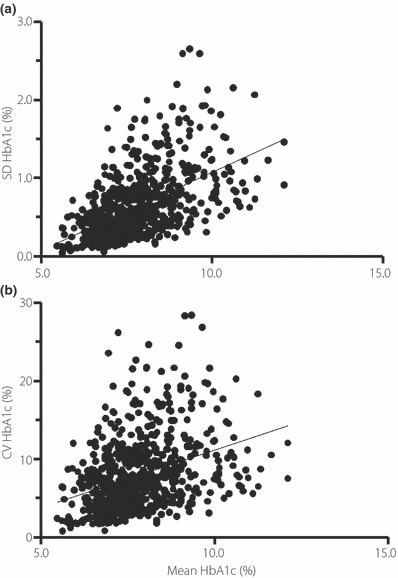
Correlation between mean HbA1c and (a) the standard deviation of HbA1c or (b) the coefficient of variation in HbA1c during the follow‐up period in Japanese patients with type 2 diabetes.
Table 1 lists the demographic and laboratory data for patients with type 2 diabetes in each quartile of SD HbA1c. Patients in the higher quartiles were younger and had higher mean BMI, HbA1c, triglyceride, and LDL‐C levels, as well as lower HDL‐C levels, during the follow‐up period. In addition, logarithmically transformed urinary ACR at baseline was greater in patients in the higher quartiles than in patients in the lowest quartile. Furthermore, there was a higher prevalence of proliferative diabetic retinopathy in patients in the higher quartiles. The medications used by the patients in the different quartiles are also listed in Table 1.
Table 1. Demographic and laboratory data for patients with type 2 diabetes divided into quartiles of the standard deviation (SD) HbA1c.
| SD quartile | P value* | ||||
|---|---|---|---|---|---|
| 1st (n = 173) | 2nd (n = 171) | 3rd (n = 173) | 4th (n = 172) | ||
| SD HbA1c | 0.24 ± 0.07 | 0.44 ± 0.05 | 0.67 ± 0.08 | 1.22 ± 0.39 | <0.001 |
| Age (years) | 66 ± 9 | 65 ± 11 | 66 ± 11 | 62 ± 12 | 0.002 |
| Sex (% men) | 62.8 | 58.5 | 58.4 | 49.4 | 0.020 |
| BMI (kg/m2)† | 24.2 ± 4.1 | 24.7 ± 3.7 | 25.5 ± 4.0 | 25.6 ± 4.7 | 0.030 |
| Current smoker (%) | 15.6 | 19.3 | 23.1 | 22.7 | 0.067 |
| Duration of diabetes (years) | 17 ± 11 | 17 ± 9 | 16 ± 9 | 14 ± 10 | 0.090 |
| SBP (mmHg)† | 137 ± 15 | 141 ± 14 | 139 ± 15 | 141 ± 15 | 0.090 |
| DBP (mmHg)† | 74 ± 9 | 75 ± 8 | 75 ± 13 | 76 ± 9 | 0.100 |
| PDR (%) | 13.3 | 24.0 | 28.9 | 30.8 | <0.001 |
| History of CVD (%) | 19.7 | 21.1 | 17.9 | 27.9 | 0.124 |
| Silent cerebral infarction (%) | 50.9 | 51.5 | 52.6 | 53.5 | 0.597 |
| Family history of CVD (%) | 41.0 | 39.8 | 46.8 | 48.3 | 0.090 |
| Medication (%) | |||||
| OHA | 46.2 | 45.0 | 53.2 | 51.2 | 0.179 |
| Insulin | 34.1 | 50.9 | 52.0 | 59.9 | <0.001 |
| RAS blockers (%) | 48.6 | 56.1 | 57.2 | 64.5 | 0.004 |
| Antiplatelet agents (%) | 41.6 | 42.7 | 47.4 | 50.6 | 0.063 |
| Statins (%) | 30.6 | 25.2 | 34.7 | 43.0 | 0.004 |
| HbA1c (%)† | 7.1 ± 0.7 | 7.5 ± 0.9 | 8.0 ± 1.0 | 8.7 ± 1.1 | <0.001 |
| Triglycerides (mmol/L)†,‡ | 1.25 (1.15–1.34) | 1.41 (1.30–1.53) | 1.38 (1.27–1.50) | 1.68 (1.54–1.82) | <0.001 |
| HDL‐C (mmol/L)† | 1.38 ± 0.42 | 1.37 ± 0.52 | 1.26 ± 0.39 | 1.24 ± 0.38 | 0.002 |
| LDL‐C (mmol/L)† | 2.92 ± 0.75 | 2.84 ± 0.82 | 3.02 ± 1.03 | 3.28 ± 0.99 | <0.001 |
| Uric acid (μmol/L) | 305 ± 73 | 313 ± 92 | 302 ± 91 | 319 ± 92 | 0.293 |
| Hemoglobin (g/L) | 136 ± 16 | 132 ± 18 | 133 ± 18 | 134 ± 17 | 0.098 |
| ACR (mg/g)‡ | 19 (15–24) | 46 (34–63) | 54 (40–72) | 74 (55–100) | <0.001 |
| Serum creatinine (μmol/L) | 71.0 ± 21.4 | 81.9 ± 39.5 | 76.0 ± 39.0 | 73.5 ± 29.6 | 0.180 |
| eGFR (mL/min per 1.73 m2) | 69.6 ± 17.8 | 64.3 ± 21.8 | 70.7 ± 25.1 | 69.1 ± 21.7 | 0.331 |
Data are expressed as the mean ± SD, geometric mean (95% CI), or percentage, as appropriate. *One‐way anova or Cochran–Armitage test. †Mean value during the follow‐up period. ‡Geometric mean. ACR, albumin/creatinine ratio; BMI, body mass index; CVD, cardiovascular disease; DBP, diastolic blood pressure; eGFR, estimated glomerular filtration rate; HDL‐C, high‐density lipoprotein cholesterol; LDL‐C, low‐density lipoprotein cholesterol; OHA, oral hypoglycemic agents; PDR, proliferative diabetic retinopathy; RAS, renin–angiotensin system; SBP, systolic blood pressure.
During a median follow‐up period of 3.3 years (range 1.0–6.3 years; 2279 patient‐years), CVD episodes were recorded in 61 patients, resulting in an incidence of 26.8 episodes per 1000 patient‐years. There were 26 stroke events and 35 CAD events. As shown in Figure 3a, the 5‐year cumulative incidence of CVD in patients in the first, second, third, and fourth quartiles of SD HbA1c was 4.9, 8.7, 17.1, and 26.2%, respectively (P < 0.001, log‐rank test). When patients were classified into four quartile groups using the mean of serially HbA1c measurements, the Kaplan–Meier curves also revealed a significant association between HbA1c variations and incident CVD events (Figure 3b). The 5‐year cumulative incidence of CVD in patients in the first, second, third, and fourth quartiles of mean HbA1c was 12.4, 8.7, 17.3, and 23.8%, respectively (P = 0.009). When the CV HbA1c was treated as a categorical variable of HbA1c variability instead of SD HbA1c (Figure 3c), the 5‐year cumulative incidence of CVD in patients in the first, second, third, and fourth quartiles of CV HbA1c was 3.8, 12.9, 17.4, and 26.2%, respectively (P < 0.001, log‐rank test).
Figure 3.
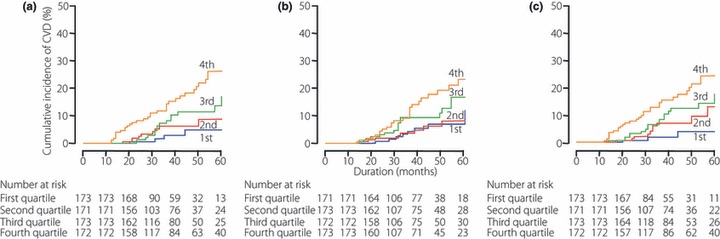
Cumulative incidence of cardiovascular disease (CVD) according to (a) quartiles of the standard deviation of HbA1c, (b) mean HbA1c, and (c) quartiles of the coefficient of variation in HbA1c following serial measurement of HbA1c in Japanese patients with type 2 diabetes.
Table 2 lists the estimated HR of incident CVD for the SD and mean of HbA1c determined in the univariate and multivariate Cox regression analyses. When SD and mean HbA1c were treated as continuous variables, either variable was significantly associated with incident CVD in the univariate Cox proportional hazards model. After adjustment for covariates, these associations were no longer significant. When analyzed as a categorical variable using the quartiles of SD HbA1c, both univariate and multivariate Cox regression analyses revealed that patients in the highest quartile were at a significantly increased risk of incident CVD compared with patients in the lowest quartile. Sensitivity analysis incorporating adjusted SD HbA1c, instead of SD HbA1c, in Cox’s regression model yielded similar results.
Table 2. Association between the standard deviation (SD) of HbA1c and the mean of serial measurements of HbA1c with incident cardiovascular disease in patients with type 2 diabetes.
| Univariate analysis | Multivariate analysis | |||||
|---|---|---|---|---|---|---|
| Hazard ratio | 95% CI | P value | Hazard ratio | 95% CI | P value | |
| Continuous variables | ||||||
| Intrapersonal SD of HbA1c | 2.94 | 1.94–4.46 | <0.001 | 1.70 | 0.96–3.00 | 0.068 |
| Intrapersonal mean HbA1c (%) | 1.38 | 1.14–1.67 | 0.001 | 1.23 | 0.97–1.57 | 0.092 |
| Other significant covariates | ||||||
| Log ACR (mg/g) | 2.25 | 1.58–3.20 | <0.001 | |||
| History of CVD (yes vs no) | 2.32 | 1.30–4.12 | 0.004 | |||
| Mean HDL‐C (mmol/L) | 0.39 | 0.19–0.78 | 0.008 | |||
| Age (years) | 1.03 | 1.00–1.06 | 0.009 | |||
| Categorical variables | ||||||
| First quartile of SD of HbA1c | 1.00 | Reference | 1.00 | Reference | ||
| Second quartile of SD of HbA1c | 2.07 | 0.64–6.71 | 0.227 | 1.48 | 0.59–3.71 | 0.400 |
| Third quartile of SD of HbA1c | 3.12 | 1.04–9.41 | 0.043 | 2.32 | 0.97–5.58 | 0.060 |
| Fourth quartile of SD of HbA1c | 6.47 | 2.29–18.30 | <0.001 | 3.38 | 1.07–10.63 | 0.039 |
| Intrapersonal mean HbA1c (%) | 1.38 | 1.14–1.67 | 0.001 | 1.20 | 0.94–1.52 | 0.148 |
| Other significant covariates | ||||||
| Log ACR (mg/g) | 2.24 | 1.58–3.17 | <0.001 | |||
| History of CVD (yes vs no) | 2.34 | 1.32–4.16 | 0.004 | |||
| Mean HDL‐C (mmol/L) | 0.48 | 0.24–0.96 | 0.037 | |||
| Age (years) | 1.03 | 1.00–1.07 | 0.025 | |||
ACR, albumin/creatinine ratio; CVD, cardiovascular disease; HDL‐C, high‐density lipoprotein cholesterol; CI, confidence intervals.
The CV HbA1c was also significantly associated with incident CVD in univariate and multivariate Cox regression analyses when CV HbA1c was treated as a continuous variable (Table 3). In addition, patients in the highest quartile of CV HbA1c were at a significantly increased risk of incident CVD, as were those in the highest quartile of SD HbA1c. In these analyses, significant covariates, similar to those given in Table 2, were identified using the stepwise method.
Table 3. Association between the coefficient of variation (CV) of HbA1c measured serially and incident cardiovascular disease in patients with type 2 diabetes.
| Univariate analysis | Multivariate analysis | |||||
|---|---|---|---|---|---|---|
| Hazard ratio | 95% CI | P value | Hazard ratio | 95% CI | P value | |
| Continuous variables | ||||||
| Intrapersonal CV of HbA1c (%) | 1.10 | 1.06–1.15 | <0.001 | 1.05 | 1.00–1.11 | 0.048 |
| Categorical variables | ||||||
| First quartile of CV of HbA1c | 1.00 | Reference | 1.00 | Reference | ||
| Second quartile of CV of HbA1c | 2.94 | 0.81–10.69 | 0.102 | 2.32 | 0.63–8.51 | 0.205 |
| Third quartile of CV of HbA1c | 4.46 | 1.30–15.22 | 0.017 | 3.25 | 0.93–11.34 | 0.065 |
| Fourth quartile of CV of HbA1c | 7.85 | 2.40–25.73 | <0.001 | 4.08 | 1.16–14.34 | 0.028 |
The intrapersonal CV and mean HbA1c values were calculated using all measurements obtained during the follow‐up period. The CV HbA1c (%) was calculated as (SD HbA1c/mean HbA1c × 100). CI, confidence intervals.
Finally, HR were calculated in four subgroups classified according to SD HbA1c and mean HbA1c, divided by the respective median values of 0.54 for SD and 7.7 for mean HbA1c, to simultaneously determine the effect of these indices of glycemic control in the multivariate Cox regression model. In this analysis, the subgroup with lower SD and lower mean HbA1c was used as the reference group. As shown in Figure 4a, patients with higher mean HbA1c and lower SD HbA1c, as well as patients with lower mean HbA1c and higher SD HbA1c, tended to be at increased risk of incident CVD; however, these associations did not reach statistical significance (P = 0.143 and 0.112, respectively). Those with both higher SD and mean HbA1c were at the highest risk of incident CVD (P = 0.002). When CV HbA1c was replaced with SD HbA1c (Figure 4b), similar results were obtained.
Figure 4.
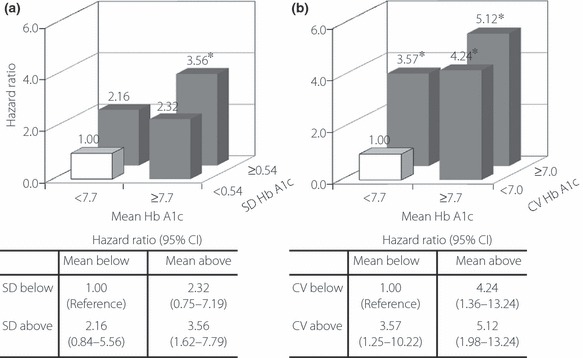
Hazard ratios for cardiovascular disease in patients with diabetes classified according to (a) the standard deviation (SD) and mean HbA1c and (b) the coefficient of variation (CV) and mean of HbA1c during the follow‐up period. Patients were divided into groups based on the median values of mean HbA1c (7.7%), SD HbA1c (0.54%) or CV HbA1c (7.0%). The subgroup with both lower variability in HbA1c (SD or CV HbA1c) and mean HbA1c was defined as the reference group. Risk estimates for reaching the endpoint were calculated using a multivariate Cox proportional hazards model with a stepwise selection procedure. Covariates incorporated in the model were age; sex; the duration of diabetes; the presence of proliferative diabetic retinopathy; smoking status; the use of insulin, renin–angiotensin system inhibitors, antiplatelet agents and statins; hemoglobin; uric acid; estimated glomerular filtration rate; urinary albumin/creatinine ratio at baseline; mean body mass index; systolic and diastolic blood pressure; triglycerides; high‐density lipoprotein cholesterol and low‐density lipoprotein cholesterol levels during the follow‐up period; and the number of measurements of HbA1c. *P < 0.05.
Discussion
Although diabetes has long been recognized as a strong risk factor for cardiovascular events1–3, it is only recently that the effects of fluctuations in HbA1c, rather than mean HbA1c levels, on incident CVD have received attention. In the present single‐institute observational cohort study in Japanese patients with type 2 diabetes, we observed an increased incidence of CVD in patients with higher variations in serial measurements of HbA1c, assessed by the SD. The HR of patients in the highest quartile of SD HbA1c compared with patients in the lowest quartile remained significant even after adjustment for mean HbA1c and other traditional cardiovascular risk factors. When variations were assessed by the CV rather than SD HbA1c, similar results were obtained. These results are in line with recent data from the post hoc analyses of the Diabetes Control and Complications Trial (DCCT)11 and the Finnish Diabetic Nephropathy (FinnDiane) Study12 showing a significant association between HbA1c variability and incident micro‐11,12 and macrovascular12 complications in patients with type 1 diabetes. To the best of our knowledge, the present study is the first to demonstrate the association between visit‐to‐visit variability in HbA1c and incident CVD in patients with type 2 diabetes, as well as in patients who are not Caucasians.
The reasons for the association between HbA1c variability and incident CVD were not clarified in the present observational study; however, several mechanisms may be postulated. We found that patients exhibiting a higher variability in HbA1c were more likely to have components of the metabolic syndrome: increased BMI, higher triglyceride levels, and lower HDL‐C levels (Table 1). In patients with type 1 diabetes in the FinnDiane Study12, HbA1c variability was associated with insulin resistance, which, in itself, is strongly associated with CVD21,22. Therefore, patients with higher HbA1c variability in the present study may be more resistant to insulin than those with lower HbA1c variability, and metabolic syndrome and/or insulin resistance may be implicated in the association between HbA1c variability and incident CVD in patients with diabetes. In addition, hyperglycemia is associated with inflammation, endothelial dysfunction23, and oxidative stress24. Increased plasma levels of 8‐iso‐prostaglandin F2α, a marker of oxidative stress, are not correlated with fasting glucose or HbA1c25, but are correlated with long‐term changes in HbA1c in patients with type 2 diabetes26. Thus, greater fluctuations in HbA1c may increase the production of reactive oxygen species, supporting the hypothesis that patients with greater fluctuations in HbA1c are at greater risk of CVD events.
One of the strengths of the present study is the more frequent measurement of HbA1c (26 ± 14 times during the follow‐up period, yielding 8.6 times per patient‐year) than in previous studies11–13, which may result in more precise data regarding intrapersonal fluctuations in HbA1c. Furthermore, we evaluated other conventional risk factors, including BMI, blood pressure, and serum lipid profiles, as covariates in the multivariate Cox regression analysis incorporating mean HbA1c values during the entire follow‐up period and not only at baseline.
There are limitations of the present study. First, the present study was conducted on an ethnically and socially homogeneous population because it was a hospital‐based study; therefore, the generalization of our findings may be limited. Second, the follow‐up period was relatively short and the number of outcomes small; therefore, differences in the effects of HbA1c variability on stroke and CAD were not determined. Third, we were unable to evaluate changes in diabetic medication during the follow‐up period, which may have affected SD and mean HbA1c. Fourth, we assessed blood glucose levels using casual blood glucose; therefore, we were unable to discriminate between fasting and postprandial plasma glucose levels. Fifth, there were no prespecified intervals between HbA1c measurements and the number of intrapersonal measurements of HbA1c varied considerably (between three and 88 per patient); however, we measured HbA1c levels every 1–2 months in most patients and included the number of serial HbA1c measurements as a covariate in the multivariate analysis.
In conclusion, the present hospital‐based observational cohort study has demonstrated for the first time that visit‐to‐visit variability in HbA1c may be a potent predictor of incident CVD, independent of mean HbA1c, in patients with type 2 diabetes. The causal role of fluctuations in HbA1c on the development of CVD needs to be clarified in future studies.
Acknowledgements
The authors declare no potential conflicts of interest relevant to this article.
References
- 1.Kannel WB, McGee DL. Diabetes and cardiovascular disease: the Framingham Study. JAMA 1979; 241: 2035–2038 [DOI] [PubMed] [Google Scholar]
- 2.Tuomilehto J, Rastenyte D, Jousilahti P, et al. Diabetes mellitus as a risk factor for death from stroke. Prospective study of the middle‐aged Finnish population. Stroke 1996; 27: 210–215 [DOI] [PubMed] [Google Scholar]
- 3.Fujishima M, Kiyohara Y, Kato I, et al. Diabetes and cardiovascular disease in a prospective population survey in Japan: the Hisayama Study. Diabetes 1996; 45(Suppl 3): S14–S16 [DOI] [PubMed] [Google Scholar]
- 4.Selvin E, Marinopoulos S, Berkenblit G, et al. Meta‐analysis. Glycosylated hemoglobin and cardiovascular disease in diabetes mellitus. Ann Intern Med 2004; 141: 421–431 [DOI] [PubMed] [Google Scholar]
- 5.Stettler C, Allemann S, Juni P, et al. Glycemic control and macrovascular disease in types 1 and 2 diabetes mellitus: meta‐analysis of randomized trials. Am Heart J 2006; 152: 27–38 [DOI] [PubMed] [Google Scholar]
- 6.The Diabetes Control and Complications Trial Research Group . The effect of intensive treatment of diabetes on the development and progression of long‐term complications in insulin‐dependent diabetes mellitus. N Engl J Med 1993; 329: 977–986 [DOI] [PubMed] [Google Scholar]
- 7.UK Prospective Diabetes Study (UKPDS) Group . Intensive blood‐glucose control with sulphonylureas or insulin compared with conventional treatment and risk of complications in patients with type 2 diabetes (UKPDS 33). Lancet 1998; 352: 837–853 [PubMed] [Google Scholar]
- 8.Action to Control Cardiovascular Risk in Diabetes Study Group . Effects of intensive glucose lowering in type 2 diabetes. N Engl J Med 2008; 358: 2545–2559 [DOI] [PMC free article] [PubMed] [Google Scholar]
- 9.ADVANCE Collaborative Group . Intensive blood glucose control and vascular outcomes in patients with type 2 diabetes. N Engl J Med 2008; 358: 2560–2572 [DOI] [PubMed] [Google Scholar]
- 10.Duckworth W, Abraira C, Moritz T, et al. VADT Investigators. Glucose control and vascular complications in veterans with type 2 diabetes. N Engl J Med 2009; 360: 129–139 [DOI] [PubMed] [Google Scholar]
- 11.Kilpatrick ES, Rigby AS, Atkin SL. A1C variability and the risk of microvascular complications in type 1 diabetes: data from the Diabetes Control and Complications Trial. Diabetes Care 2008; 31: 2198–2202 [DOI] [PMC free article] [PubMed] [Google Scholar]
- 12.Wadén J, Forsblom C, Thorn LM, et al. Finnish Diabetic Nephropathy Study Group . A1C variability predicts incident cardiovascular events, microalbuminuria, and overt diabetic nephropathy in patients with type 1 diabetes. Diabetes 2009; 58: 2649–2655 [DOI] [PMC free article] [PubMed] [Google Scholar]
- 13.Prince CT, Becker DJ, Costacou T, et al. Changes in glycaemic control and risk of coronary artery disease in type 1 diabetes mellitus: findings from the Pittsburgh Epidemiology of Diabetes Complications Study (EDC). Diabetologia 2007; 50: 2280–2288 [DOI] [PubMed] [Google Scholar]
- 14.Bouchi R, Babazono T, Nyumura I, et al. Relationship between chronic kidney disease and silent cerebral infarction in patients with type 2 diabetes. Diabet Med 2010; 27: 538–543 [DOI] [PubMed] [Google Scholar]
- 15.Alberti KGMM, Zimmet P, for the WHO Consultation . Definition, diagnosis, and classification of diabetes mellitus and its complications, part 2: diagnosis and classification of diabetes mellitus. Provisional report of a WHO consultation. Diabet Med 1998; 15: 539–553 [DOI] [PubMed] [Google Scholar]
- 16.Hirsch AT, Haskal ZJ, Hertzer NR, et al. ACC/AHA 2005 practice guidelines for the management of patients with peripheral arterial disease. Circulation 2006; 113: e436–e465 [DOI] [PubMed] [Google Scholar]
- 17.The Committee of the Japan Diabetes Society on the Diagnostic Criteria of Diabetes Mellitus . Report of the Committee on the Classification and Diagnostic Criteria of Diabetes Mellitus. J Diabetes Invest 2010; 1: 212–228 [DOI] [PMC free article] [PubMed] [Google Scholar]
- 18.American Diabetes Association . Nephropathy in diabetes. Diabetes Care 2004; 27(Suppl 1): S79–S83 [DOI] [PubMed] [Google Scholar]
- 19.Matsuo S, Imai E, Horio M, et al. Collaborators developing the Japanese equation for estimated GFR. Revised equations for estimated GFR from serum creatinine in Japan. Am J Kidney Dis 2009; 53: 982–992 [DOI] [PubMed] [Google Scholar]
- 20.Friedewald WT, Levy RI, Fredrickson DS. Estimation of the concentration of low‐density lipoprotein cholesterol in plasma, without use of the preparative ultracentrifuge. Clin Chem 1972; 18: 499–502 [PubMed] [Google Scholar]
- 21.Groop PH, Forsblom C, Thomas MC. Mechanisms of disease: pathway selective insulin resistance and microvascular complications of diabetes. Nat Clin Pract Endocrinol Metab 2005; 1: 100–110 [DOI] [PubMed] [Google Scholar]
- 22.DeFronzo RA. Insulin resistance, lipotoxicity, type 2 diabetes and atherosclerosis: the missing links. The Claude Bernard Lecture 2009. Diabetologia 2010; 53: 1270–1287 [DOI] [PMC free article] [PubMed] [Google Scholar]
- 23.Ceriello A, Esposito K, Piconi L, et al. Oscillating glucose is more deleterious to endothelial function and oxidative stress than mean glucose in normal and type 2 diabetic patients. Diabetes 2008; 57: 1349–1354 [DOI] [PubMed] [Google Scholar]
- 24.Monnier L, Mas E, Ginet C, et al. Activation of oxidative stress by acute glucose fluctuations compared with sustained chronic hyperglycaemia in patients with type 2 diabetes. JAMA 2006; 295: 1681–1687 [DOI] [PubMed] [Google Scholar]
- 25.Gopaul NK, Anggard EE, Mallet AI, et al. Plasma 8‐iso‐PGF2α levels are elevated in individuals with non‐insulin‐dependent diabetes mellitus. FEBS Lett 1995; 368: 225–229 [DOI] [PubMed] [Google Scholar]
- 26.Davì G, Ciabattoni G, Consoli A, et al. In vivo formation of 8‐iso‐prostaglandin F2α and platelet activation in diabetes mellitus: effects of improved metabolic control and vitamin E supplementation. Circulation 1999; 99: 224–229 [DOI] [PubMed] [Google Scholar]