Abstract
Background
The aim of this study was to determine the hemodynamic effects of various support modes of continuous flow left ventricular assist devices (CF-LVADs) on the cardiovascular system using a numerical cardiovascular system model.
Material/Methods
Three support modes were selected for controlling the CF-LVAD: constant flow mode, constant speed mode, and constant pressure head mode of CF-LVAD. The CF-LVAD is established between the left ventricular apex and the ascending aorta, and was incorporated into the numerical model. Various parameters were evaluated, including the blood assist index (BAI), the left ventricular external work (LVEW), the energy of blood flow (EBF), pulsatility index (PI), and surplus hemodynamic energy (SHE).
Results
The results show that the constant flow mode, when compared to the constant speed mode and the constant pressure head mode, increases LVEW by 31% and 14%, and EBF by 21% and 15%, respectively, indicating that this mode achieved the best ventricular unloading among the 3 support modes. As BAI is increased, PI and SHE are gradually decreased, whereas PI of the constant pressure head reaches the maximum value.
Conclusions
The study demonstrates that the continuous flow control mode of the CF-LVAD may achieve the highest ventricular unloading. In contrast, the constant rotational speed mode permits the optimal blood perfusion. Finally, the constant pressure head strategy, permitting optimal pulsatility, should optimize the vascular function.
MeSH Keywords: Blood Flow Velocity, Heart Failure, Ventricular Function, Left
Background
The CF-LVADs are now widely used clinically in patients with advanced, chronic cardiac failure. The clinical results are gratifying, even after long-term support. Hemodynamic changes after CF-LVADs implantation have been evaluated quite extensively. Left ventricular volume is significantly reduced [1]. The pulsatility of blood flow is reduced as the rotational speed of the pump is increased [2]. The systemic vascular impedance is significantly increased [3]. In addition, changes in the coronary flow and circulation have been demonstrated [4,5]. The coronary flow is reduced as the CF-LVADs support is increased. This might be the consequence of a drop in the left ventricular work itself due to left ventricular unloading and a drop in myocardial oxygen demand. The decreased myocardial oxygen demand may lead to a reactive increase in the coronary vascular resistance through the auto-regulatory system.
The support modes of CF-LVADs could significantly impact the hemodynamic changes and patient outcomes. Differences in the support mode might even account for the differences in results in the patients receiving an LVAD as a bridge to recovery.
Many support modes, achieving various aims, have been designed for CF-LVADs, including Heart Mate II, Jarvik 2000, Heart ware, and BJUT-II VAD. For instance, the constant speed mode, driving the CF-LVADs with a stable rotational speed in the whole process, was first proposed for clinical practice [6,7]. Under this mode, the rotational speed of CF-LVADs is considered as the input of the controller, and the actual speed of CF-LVADs is regulated by the constant speed mode to track the desired one. To achieve a controllable performance of arterial perfusion, the continuous flow mode has been proposed [8–10]. Under this mode, the blood flow rate is chosen as the control input and the support mode regulates CF-LVADs to achieve the desired blood flow rate. Finally, as clinical experience in CF-LVADs improved, the role of the pressure gradient between the left ventricle and ascending aorta has become a very important indicator of the cardiovascular system. Hence, several support modes, choosing this pressure head as the control variables, were designed [11,12]. The pressure head across CF-LVADs, in this mode, is controlled by the controller to track its desired value. However, the precise mechanism of the changes in the hemodynamics and perfusion due to the different support modes remains unclear.
The present work is focused on the study on a circulatory model of the hemodynamic changes in the cardiovascular system under different modes of left ventricular support. Three support modes – “constant speed”, “continuous flow”, and “constant pressure head” – were studied. Numerical studies have been conducted to evaluate the performances of these 3 support modes. The following indices have been computed on the model: the blood assist index (BAI), the left ventricular external work (LVEW), the energy of blood flow (EBF), the pulsatility index (PI), and the surplus hemodynamic energy (SHE). The abbreviations used are shown in Table 1.
Table 1.
Abbreviations used in this manuscript.
| Abbreviation | |
|---|---|
| HF | Heart failure |
| LVADs | Left ventricular assist devices |
| BAI | Blood assist index |
| LVEW | Left ventricular external work |
| EBF | Energy of blood flow |
| PI | Pulsatility index |
| EEP | Energy-equivalent pressure |
| SHE | Surplus hemodynamic energy |
| MAP | Mean arterial pressure |
Material and Methods
The design of various support modes
In this paper, 3 support modes, used widely in clinical practice, were designed to evaluate the hemodynamic changes. The first support mode, named “constant speed”, drives the CF-LVADs with a constant rotational speed during the whole cardiac cycle. The second control strategy, named “constant pressure head” [13], maintains a constant pressure across the CF-LVADs. For this support mode, the support level of CF-LVADs will be increased during the systolic period to achieve more blood perfusion. The support level is reduced during the diastolic phase to prevent suction. The third support mode, called “continuous flow”, is driving the CF-LVADs with a stable flow output of the CF-LVADs.
To compare the respective hemodynamic effects of the 3 different modes, an equivalent support level is necessary. Consequently, the blood assist index (BAI) [14] was used as the indicator of the support level. BAI reflects the energy distribution between the CF-LVADs and the native heart, which is a ratio of the power of CF-LVADs and total power of the cardiovascular system. The validity of this index has been demonstrated in previous publications [15]. In this study, the BAI value was increased from 20% to 90% to cover all types of LVAD support. The 20% BAI value represents the minimal support level and the 90% BAI value represents the maximal unloading of the left ventricle.
In this article, the control variables of the 3 support modes – the rotational speed for constant speed mode, the pressure head for constant pressure head mode, and the pump flow for continuous flow mode – were regulated to increase the BAI value from 20% to 90%.
The combined model of cardiovascular system and CF-LVADs
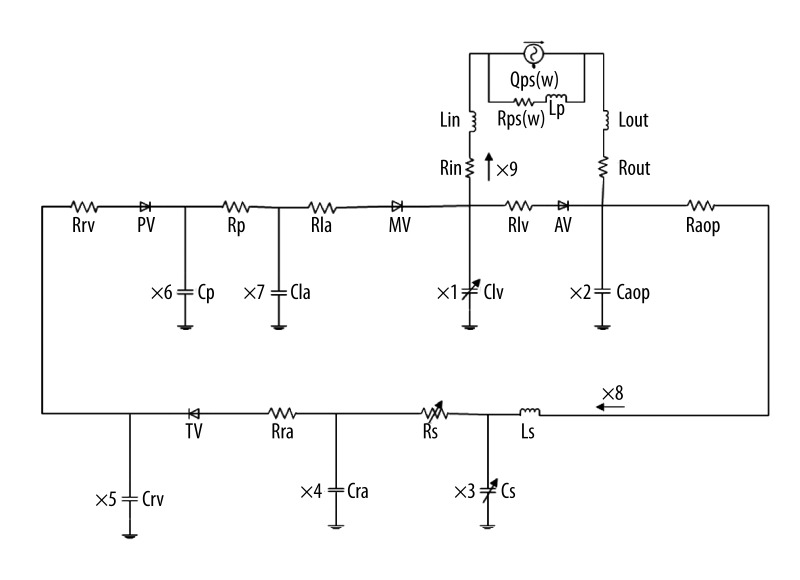
A mathematical model of the cardiovascular-pump system was use to evaluate the hemodynamic effects of the different support modes. Figure 1 shows the complete electric circuit analogy of the cardiovascular model in relation to the CF-LVADs. The model includes the left atrium, the active left ventricle, the CF-LVADs, and the peripheral circulation system. The active left ventricle in this model is mimicked by a time-varying elastance function: E(t)=1/C(t). In this work, the elastance function was defined as:
Figure 1.
The bypass model of cardiovascular system and blood pump.
| (1) |
Where Emax and Emin denote the maximum and minimum values of E(t); and En(t) represents the normalized time-varying elastance function [15,16]:
| (2) |
Where tn=t/tmax and tmax=0.15*Tc+0.2; Tc represents the cardiac cycle interval (i.e., Tc=60/HR, where HR represents the heart rate of the native heart). In this work, the HR was fixed at 75 bpm. This model was compared to clinical data, and the results demonstrate that the model can accurately mimic the hemodynamic performance of the circulatory system [17]. The complete description and the parameters’ values (listed in Table 2) of the model were set as heart failure patient, as reported by Gu et al. [18].
Table 2.
Model parameters.
| Parameter | Value | Physiological Meaning | |
|---|---|---|---|
| Compliances (ml/mmHg) | Clv | Time-varying | Left ventricular compliance Clv=1/E(t) |
| Caop | 0.04 | Aortic compliance | |
| Cs | Time-varying | System compliance Cs=C | |
| Cra | 4.4 | Right atria compliance | |
| Crv | 4.8 | Right ventricular compliance | |
| Cp | 4.8 | Pulmonary systemic compliance | |
| Cla | 4.4 | Left atria compliance | |
| Resistances (mmHg·sec/ml) | Rlv | 0.01 | Left ventricular resistance |
| Raop | 0.0398 | Arterial resistance | |
| Rs | Time-varying | System resistance Rs=R | |
| Rra | 0.01 | Right atria resistance | |
| Rrv | 0.001 | Right ventricular resistance | |
| Rp | 0.02 | Pulmonary systemic resistance | |
| Rla | 0.01 | Left atria resistance | |
| Rin | 0.0677 | Pump input resistance | |
| Rout | 0.0677 | Pump output resistance | |
| Inertance (mmHg·sec2/ml) | Ls | 0.0005 | Inertance of blood in system |
| Lp | 0.0005 | Inertance of blood in pulmonary | |
| Lin | 0.00127 | Inertance of input | |
| Lout | 0.00127 | Inertance of output | |
| Valves | AV | Aortic valve | |
| TV | Tricuspid valve | ||
| PV | Pulmonary valve | ||
| MV | Mitral valve |
According to previous research by our group, the mathematic model of CF-LVADs is described as a function of the flow rate, pressure head, and rotational speed of the pump, which is denoted by:
| (3) |
In which QPO represents the flow rate of the pump (L/min), PP is the pressure head of the pump (mmHg), ω is the rotational speed (R/s), and LP is the inertia of blood in intra-aorta pump. A detailed description of model of the BJUT-II VAD and its identification is reported in Chang [19]. Note that, although equation (3) is derived from BJUT-II VAD, it is confirmed to be appropriate for CF-LVADs placed between the left ventricular apex and the ascending aorta.
The hemodynamic analysis
The left ventricular external work (LVEW) as an index of cardiac recovery is defined to indicate the energy of native heart, denoted as:
| (4) |
in which ωLV represents LVEW, PLV(t) is left ventricular pressure, QLV(t) is left ventricular flow, and Tc is cardiac cycle.
The input work of systemic circulation as an index of blood perfusion was defined to indicate the energy of circulatory system, denoted as:
| (5) |
in which ωsys represents LVEW, Psys(t) is the left ventricular pressure, Qsys(t) is the left ventricular flow, and TC denotes the cardiac cycle.
Kawahito [20] proposed use of PI to evaluate the pulsatility blood flow of VADs. Research findings indicate that the change of pulsating flow was exponential, with different levels of assist ratio, in an animal experiment. In this article, the pulsatility index (PI) [21] is used to estimate pulsatility of blood pressure. In this paper, it is defined as follows:
| (6) |
in which PSB is the systolic blood pressure, PDB represents the diastolic pressure, and MAP is the mean arterial pressure.
The energy-equivalent pressure (EEP) formula is defined as the ratio of the area beneath the hemodynamic power curve (fFPdt) to the area beneath the pump flow curve (fFdt) during each pulse cycle [22]. It represents the hemodynamic energy per unit volume of blood. It is calculated as follows:
| (7) |
in which F is the blood flow (in liters per minute) and P represents the arterial pressure (in mmHg). SHE is calculated in response to EEP and MAP as follows:
| (8) |
in which SHE represents the extra energy required for generation of pulsatile flow (PF) in terms of energy (not pressure) units and is thus a physiologically relevant measure of pulsatility because the generation of PF in the body is dependent on an energy gradient rather than a pressure gradient [23].
Results
The hemodynamic effects of the different support modes of the CF-LVADs were evaluated in numerical studies. The characteristics of the model before CF-LVADs support were simulated to validate the model. The clinical data and the results of simulation are listed in Table 3. In this table, the normal value is derived from the literature [18], and the clinical value was measured in clinical practice at Peking University third hospital. The results show that the proportional error of the systolic pressure (SBP) and the diastolic pressure (DBP) is 4.9% and 9%, respectively. The proportional error of end-diastolic volume (EDV) and end-systolic volume (ESV) was 13.4% and 3%, respectively. The proportional error of MAP was about 2.3%.
Table 3.
Comparison between simulating result and clinical data.
| Normal value | Clinical data | Before support | Error (%) | |
|---|---|---|---|---|
| SBP (mmHg) | 90~140 | 123 | 117 | 4.9 |
| DBP (mmHg) | 60~90 | 55 | 60 | 9 |
| ESV (ml) | 32~47 | 99.3 | 86 | 13.4 |
| EDV (ml) | 80~172 | 153.6 | 149 | 3 |
| MAP (mmHg) | 90~95 | 86 | 84 | 2.3 |
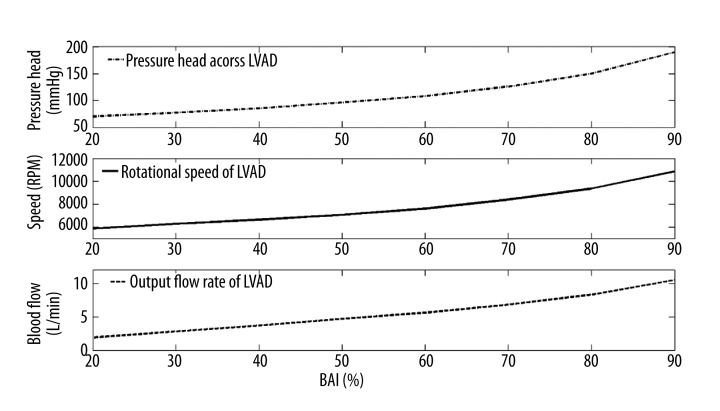
Figure 2 shows the relationship between the control variables of the 3 support modes and the BAI value. In this study, the control variables of 3 support modes, including the pressure head across CF-LVADs, flow rate of CF-LVADs, and the rotational speed of CF-LVADs, were increased to achieve the BAI value increasing from 20% to 90%. For the constant speed mode, the desired rotational speed of CF-LVADs is increased from 5880 RPM to 10 860 RPM. Similarly, the desired pressure head of CF-LVADs in constant pressure head mode is increased from 70 mmHg to 190 mmHg. The pump flow rate in the continuous flow mode increased from 1.9L/min to 10.5L/min.
Figure 2.
The relationship between the control variable of three support mode and the BAI.
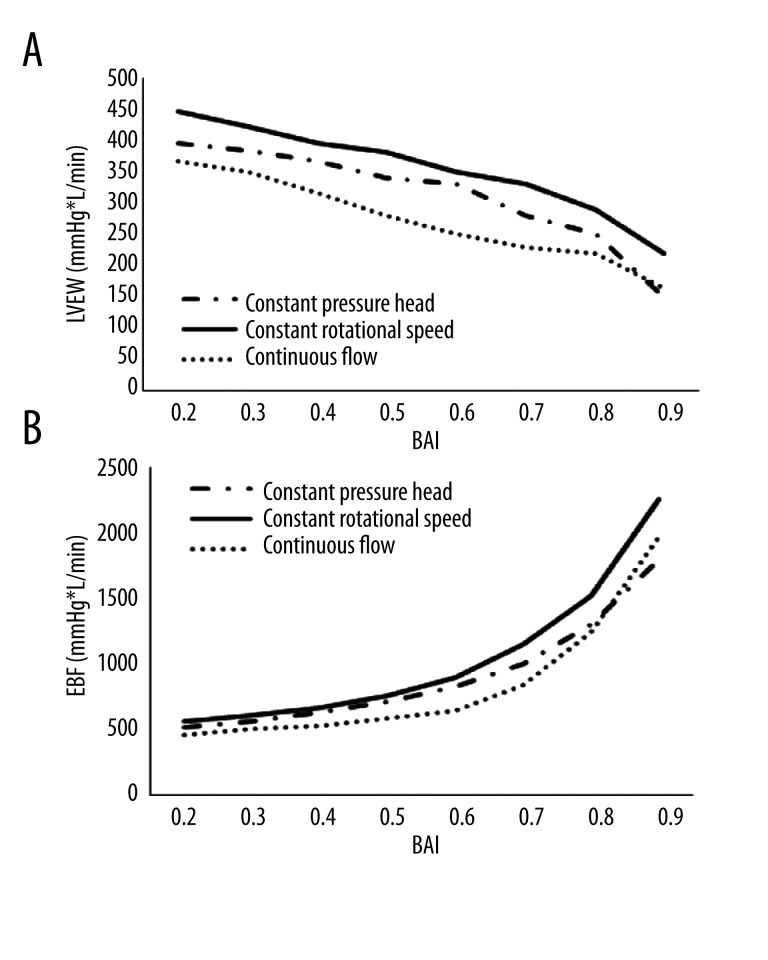
Figure 3A shows the changes in the LVEW in the bypass model. Following the rise of BAI, the continuous flow has the minimum value of the LVEW. In the constant rotational speed mode and the constant pressure head mode, the LVEW is increased by 31% and 14%, respectively. In other words, the continuous flow control strategy may achieve higher ventricular unloading.
Figure 3.
(A) The left ventricular external work of bypass model; (B) The energy of blood flow of bypass model.
Figure 3B shows EBF in the bypass model. The 3 curves show the relationship between EBF and BAI in the bypass model. The constant rotational speed mode generates the highest energy of blood flow when compared to the continuous flow and the constant pressure head modes. EBF is improved by 21% and 15%, respectively. This suggests that the constant rotational speed mode has the best impact on the arterial perfusion.
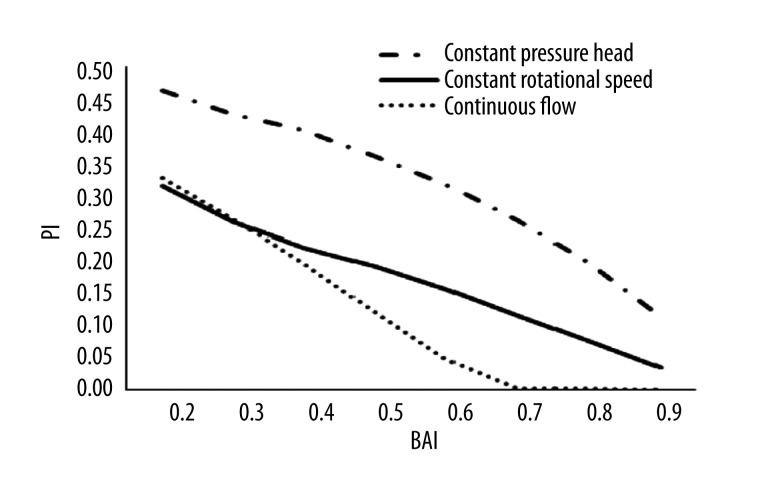
Figure 4 represents the relationship between the pulsatility and the blood assist index. Before pump support,, PI was roughly 0.6. PI was reduced with the increase of BAI after support with bypass pump in the 3 support modes. The continuous flow mode curve shows that, PI was significant decreased and leveled off at 0 during more than 70% of BAI. Comparing the 3 support modes, the constant pressure head mode had the maximum value, suggesting that this mode had the best impact on the vascular function.
Figure 4.
The curve of PI with the blood assist index.
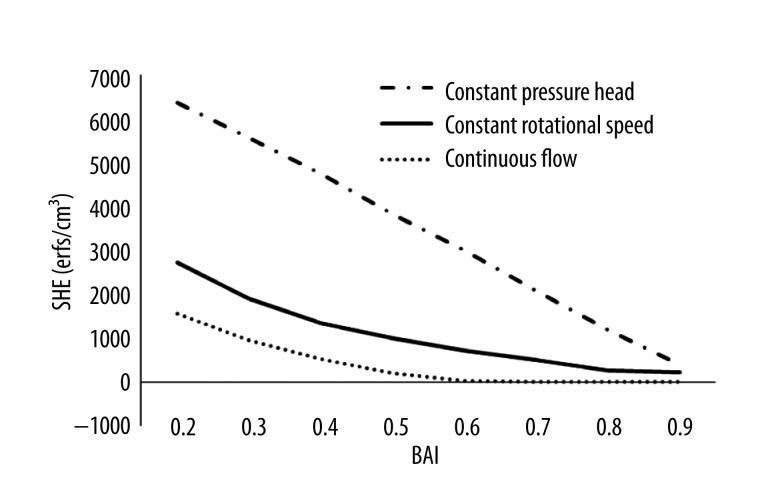
Figure 5 shows the changes in SHE of the 3 support modes along with the increase of BAI. SHE was negatively related to BAI in the 3 modes. Among the 3 support modes, the constant pressure head mode achieved the highest SHE value at the same BAI level. In contrast, the continuous flow support mode had the lowest SHE value at each BAI level. This means the constant pressure head mode has more benefit for restoring the pulsatility of blood pressure, compared with other 2 support modes.
Figure 5.
The curve of the change of SHE along with the blood assist index.
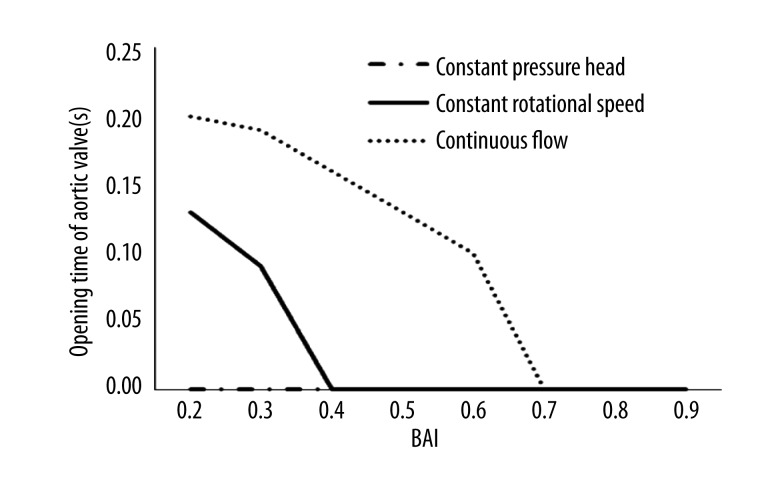
Figure 6 shows the opening time of the aortic valves. In the simulated model, the aortic valves open when the ventricular pressure is higher than aortic pressure and close in the opposite situation. The aortic valves in the constant rotational speed mode and in the continuous flow support mode were closed at 40% and 70% BAI, respectively. This suggests that the continuous flow support mode may be optimal to protect the function of the native aortic valve.
Figure 6.
The opening time of aortic valve.
Discussion
In the initial phase of the clinical experience, the studies on support modes of CF-LVADs using continuous flow pump mainly focus on the stability and the robustness. However, currently, many reports indicate that the support mode can directly change the hemodynamic state of the cardiovascular system. Differences in the support mode might explain the unpredictable results achieved in patients supported in myocardial recovery and reverse left ventricular remodeling. Birks [24] et al. reported that the reversal of end-stage heart failure secondary to nonischemic cardiomyopathy can be achieved in a substantial proportion of patients with CF-LVADs support. Ising [25] et al. reported that when the waveform of blood flow is designed to be synchronized with the cardiac beat, the pulsatility of the arterial blood flow increased significantly. Kishimoto [26] et al. found that when the rotational speed of the CF-LVADs is synchronized to the heart beat, the arterial perfusion is improved and the risk of aortic insufficiency is reduced. Similarly, Heredero et al. [27] reported that the synchronous mode of CF-LVADs operation may be satisfy the blood demand and restore the pulsatility of the aortic pressure. These studies show that the various support modes can significantly change the hemodynamic state of cardiovascular system.
However, the differences of the hemodynamic effects of the different support modes are not clear. The present work could provide insight into the precise mechanism involved and it also could give useful information on choosing the appropriate support modes in response to the condition of the patients and the final objective of the CF-LVADs support (bridge to cardiac replacement or bridge to recovery).
It has been generally believed that heart failure (HF) is a progressive and irreversible disease due to complex mechanisms of cardiomyopathy. However, there is increasing evidence that mechanical unloading obtained by the use of CF-LVADs may reverse the progression of HF, permit myocardial function recovery, and ultimately the explantation of the device [28]. For instance, Klotz et al. [29] reported that left ventricular function recovery is possible when given sufficient mechanical unloading. Manginas et al. [30] found that after CF-LVADs implantation, a transient increase occurs in the number of circulating progenitor cells, which may contribute to the improvement of tissue perfusion and cardiac recovery. Drakos et al. [31] reported that the sympathetic innervation in the failing heart was significantly improved by LVADs. Chen et al. [32] reported that LVADs support could alter the gene expression and found that there are 130 gene transcripts achieving the strict criteria for up-regulation and 49 gene transcripts for down-regulation after LVADs support. Saito et al. [33] found that cardiac fibrosis, which has a significant correlation with the cardiac function, was significantly reduced after support by LVADs. These various studies confirm that mechanical left ventricular unloading is the key factor in the improvement of the ventricular reverse remodeling.
In this paper, the LVEW was chosen as the indicator to evaluate the ventricular unloading performance of varied support modes. LVEW reflects the left ventricular load level, having a direct effect on the left ventricular reverse remodeling, in the whole cardiac cycle [34]. A lower LVEW value corresponds with a lower left ventricular load. In the present work, the continuous flow mode achieved the lowest LVEW value compared with other 2 support modes, indicating that the continuous flow mode can achieve better left ventricular unloading performance and promotes myocardial reverse remodeling.
EBF represents the input energy of blood, which is injected into the ascending aorta. A higher EBF value corresponds with more blood input energy. Generally, the aortic pressure and the blood flow are considered as the important indicators, reflecting the capacity of blood perfusion. However, the change of peripheral resistance of the circulatory system may affect the performance of aortic pressure and blood flow, which will reduce the accuracy of the evaluation. According to the hemodynamic theory, the energy is the essential reason for keeping the blood circulating. Hence, it is reasonable to think that in evaluation of the capacity of blood perfusion, neither use of aortic pressure nor direct blood flow, but rather a combination of them in the form of energy, is best. In the present work, the constant speed mode achieved the highest EBF among the 3 modes, meaning that the constant speed mode improves blood perfusion.
The above-mentioned results show that various support modes have different physiological significances and the operators should choose the appropriate support mode in response to patient state. If the aim of treatment is to satisfy the blood demand of the circulatory system, the constant speed mode will be chosen. In contrast, if the aim of treatment is to promote myocardial reverse remodeling, the continuous flow mode will be better.
The present study clearly shows that the different support modes of the CF-LVADs have a very different impact on the pulsatility. Both PI and SHE are important indicators of the pulsatility of aortic pressure or blood flow. The higher their values are, the higher the pulsatility of the pressure is. At the same support level, the constant pressure head strategy can achieve the highest pulsatility of the 3 support modes. The role of the pulsatility of the aortic blood flow is quite controversial and differing opinions have been published. However, it seems now that there is general agreement on some facts: the pulsatility is quite beneficial in patients in cardiogenic shock with peripheral organ dysfunction [35], and is less necessary in patients with an adequate peripheral end-organ function [36,37]. The effect of pulsatility on the vascular function is also quite controversial. Prolonged diminished pulsatility might lead to vascular stiffening, which increases the ventricular afterload, reduces myocardial perfusion because of early (systolic) AOP wave reflections, and attenuates baroreflex sensitivity [38]. Finally, pulsatility has an impact on the viscoelastic properties. With increased pulsatility, the viscoelastic interaction of the erythrocytes is reduced, which in turn reduces viscosity and, therefore, blood flow resistance [39]. As a result, tissue oxygen delivery is enhanced in the renal circulation and brain compared with continuous-flow pump. Consequently, it can be assumed that the constant pressure head mode is optimal for restoring blood and vascular function.
The biomechanics of the aortic valve change during CF-LVADs support [40]. The clinical impacts of these changes are now clearly shown, as the number of patients on CF-LVADs support is increasing and as the time of support is prolonged over many months and even years [41]. Martina et al. [42] reported that 58% of patients who receive CF-LVADs treatment have commissural fusion of the aortic valve leaflets. Aggarwal et al. [43] reported that aortic insufficiency developed over time in a significant number of patients who received CF-LVADs treatment. The function of the aortic valve should be preserved by a selection of the optimal support mode for driving the CF-LVADs. The present data show that the aortic valve, if the constant pressure head mode is used, is always closed at a BAI ranging from 20% to 90%, as shown in Figure 6. The aortic valves in the constant rotational speed mode and in the continuous flow support mode are closed at 40% and 70% BAI, respectively. This suggests that the continuous flow support mode may be optimal to protect the function of the native aortic valve.
The limitations of study
The interaction between support modes and right ventricular function is a very important issue for heart failure patients with CF-LVADs support. Many studies found that left ventricular unloading can affect the position of the ventricular septum [44], and further affect the right ventricular function [45,46]. For instance, if the left ventricular unloading level exceeds the normal range, the ventricular septum will be shifted to the left ventricle by the pressure gradient between left and right ventricles. This phenomenon will impair the right ventricular function. In the future, the mechanism of varied support modes on the left ventricular septum and right ventricular function will be studied.
These data, obtained in a simulation model, have to be confirmed by precise animal experimentation and the evaluation of the hemodynamic changes in the 3 different modes of function of a continuous flow CF-LVADs. They emphasize the need for precise study of hemodynamic and perfusion to optimize peripheral perfusion, and the possibility of left ventricular recovery and aortic valve preservation.
Conclusions
Three support modes of function of the CF-LVADs – the continuous flow mode, the constant rotational speed and the constant pressure head – were evaluated in a model using various parameters: the blood assist index (BAI), the left ventricular external work (LVEW), the energy of blood flow (EBF), pulsatility index (PI), and surplus hemodynamic energy (SHE). The numerical studies show that the various support modes can generate different hemodynamic effects on the cardiovascular system. The continuous flow appears to be most beneficial for protecting valve function. The constant rotational speed mode has the best performance in blood perfusion and ventricular unloading. Finally, the constant pressure head strategy can achieve the highest pulsatility of pressure, which may have benefit for keeping vascular functions.
Footnotes
Source of support: This work was partly sponsored by the National Natural Science Foundation of China (Grant No. 11272022). The work is also sponsored by the National Natural Science Foundation of China (Grant No. 1122001, 1372014), the Fundamental Research Foundation of BJUT(015000514312002) Jinghua Foundation of BJUT (015000543114506) and Rixinhoubei Foundation of BJUT
References
- 1.Jhun CS, Reibson JD, Cysyk JP. Effective ventricular unloading by left ventricular assist device varies with stage of heart failure: cardiac simulator study. ASAIO J. 2011;57:407–13. doi: 10.1097/MAT.0b013e318229ca8d. [DOI] [PubMed] [Google Scholar]
- 2.Hayward CS, Salamonsen R, Keogh AM, et al. Effect of alteration in pump speed on pump output and left ventricular filling with continuous-flow left ventricular assist device. ASAIO J. 2011;57:495–500. doi: 10.1097/MAT.0b013e318233b112. [DOI] [PubMed] [Google Scholar]
- 3.Travis AR, Giridharan GA, Pantalos GM, et al. Vascular pulsatility in patients with a pulsatile- or continuous-flow ventricular assist device. J Thorac Cardiovasc Surg. 2007;133:517–24. doi: 10.1016/j.jtcvs.2006.09.057. [DOI] [PubMed] [Google Scholar]
- 4.Tuzun E, Eya K, Chee HK, et al. Myocardial hemodynamics, physiology, and perfusion with an axial flow left ventricular assist device in the calf. ASAIO J. 2004;50:47–53. doi: 10.1097/01.mat.0000104819.23235.2f. [DOI] [PubMed] [Google Scholar]
- 5.Ootaki Y, Kamohara K, Akiyama M, et al. Phasic coronary blood flow pattern during a continuous flow left ventricular assist support. Eur J Cardiothorac Surg. 2005;28:711–16. doi: 10.1016/j.ejcts.2005.08.008. [DOI] [PubMed] [Google Scholar]
- 6.Salamonsen RF, Mason DG, Ayre PJ. Response of rotary blood pumps to changes in preload and afterload at a fixed speed setting are unphysiological when compared with the natural heart. Artif Organs. 2011;35:E47–53. doi: 10.1111/j.1525-1594.2010.01168.x. [DOI] [PubMed] [Google Scholar]
- 7.Chang Y, Gao B. A global sliding mode controller design for an intra-aorta pump. ASAIO J. 2010;56:510–16. doi: 10.1097/MAT.0b013e3181ede369. [DOI] [PubMed] [Google Scholar]
- 8.Ferrari G, Kozarski M, Fresiello L, et al. Continuous-flow pump model study: the effect on pump performance of pump characteristics and cardiovascular conditions. J Artif Organs. 2013;16:149–56. doi: 10.1007/s10047-013-0691-7. [DOI] [PubMed] [Google Scholar]
- 9.Wu Y. Adaptive physiological speed/flow control of rotary blood pumps in permanent implantation using intrinsic pump parameters. ASAIO J. 2009;55:335–39. doi: 10.1097/MAT.0b013e3181aa2554. [DOI] [PubMed] [Google Scholar]
- 10.Giridharan GA, Pantalos GM, Gillars KJ, et al. Physiologic control of rotary blood pumps: an in vitro study. ASAIO J. 2004;50(5):403–9. doi: 10.1097/01.mat.0000136652.78197.58. [DOI] [PubMed] [Google Scholar]
- 11.Luszczak J, Olszowska M, Drapisz S, et al. Assessment of left ventricle function in patients with symptomatic and asymptomatic aortic stenosis by 2-dimensional speckle-tracking imaging. Med Sci Monit. 2012;18(12):MT91–96. doi: 10.12659/MSM.883587. [DOI] [PMC free article] [PubMed] [Google Scholar]
- 12.Gao B, Chang Y, Gu K, et al. A pulsatile control algorithm of continuous-flow pump for heart recovery. ASAIO J. 2012;58:343–52. doi: 10.1097/MAT.0b013e318256bb76. [DOI] [PubMed] [Google Scholar]
- 13.Gu KY, Gao B, Xuan YJ, et al. Intra-Aorta Pump Control Based on Constant Differential Pressure. 2nd International conference on industrial and information systerm; 10–11 July 2010; Dalian. 2010. pp. 303–5. [Google Scholar]
- 14.Gao B, Gu K, Zeng Y, et al. A blood assist index control by intraaorta pump: a control strategy for ventricular recovery. ASAIO J. 2011;57:358–62. doi: 10.1097/MAT.0b013e3182257fac. [DOI] [PubMed] [Google Scholar]
- 15.Gao B, Gu K, Zeng Y, Chang Y. An anti-suction control for an intra-aorta pump using blood assistant index: a numerical simulation. Artif Organs. 2012;36:275–82. doi: 10.1111/j.1525-1594.2011.01309.x. [DOI] [PubMed] [Google Scholar]
- 16.Gao B, Chang Y, Gu K, et al. Baroreflex sensitivity controller by intra-aortic pump: a potential benefit for heart recovery. ASAIO J. 2012;58:197–203. doi: 10.1097/MAT.0b013e31824b1f21. [DOI] [PubMed] [Google Scholar]
- 17.Gao B, Nie LY, Chang Y, Zeng Y. Physiological control of intraaorta pump based on heart rate. ASAIO J. 2011;57:152–57. doi: 10.1097/MAT.0b013e31820bff95. [DOI] [PubMed] [Google Scholar]
- 18.Gu K, Chang Y, Gao B, et al. Lumped parameter model for heart failure with novel regulating mechanisms of peripheral resistance and vascular compliance. ASAIO J. 2012;58:223–31. doi: 10.1097/MAT.0b013e31824ab695. [DOI] [PubMed] [Google Scholar]
- 19.Chang Y, Gao B. Modeling and identification of an intra-aorta pump. ASAIO J. 2010;56:504–9. doi: 10.1097/MAT.0b013e3181efff2d. [DOI] [PubMed] [Google Scholar]
- 20.Kawahito S, Takano T, Nakata K, et al. Analysis of the arterial blood pressure waveform during left ventricular nonpulsatile assistance in animal models. Artif Organs. 2000;24:816–20. doi: 10.1046/j.1525-1594.2000.06646.x. [DOI] [PubMed] [Google Scholar]
- 21.Choi S, James FA, Boston JR, et al. A Sensorless Approach to Control of a Turbodynamic Left Ventricular Assist System. IEEE Transactions On Control Systems Technology. 2001;9:473–82. [Google Scholar]
- 22.Weiss WJ, Lukic B, Undar A. Energy equivalent pressure and total hemodynamic energy associated with the pressure-flow waveforms of a pediatric pulsatile ventricular assist device. ASAIO J. 2005;51:614–17. doi: 10.1097/01.mat.0000179341.95404.f8. [DOI] [PubMed] [Google Scholar]
- 23.Letsou GV, Pate TD, Gohean JR, et al. Improved left ventricular unloading and circulatory support with synchronized pulsatile left ventricular assistance compared with continuous-flow left ventricular assistance in an acute porcine left ventricular failure model. J Thorac Cardiovasc Surg. 2010;140:1181–88. doi: 10.1016/j.jtcvs.2010.03.043. [DOI] [PubMed] [Google Scholar]
- 24.Birks EJ, George RS, Hedger M, et al. Reversal of severe heart failure with a continuous-flow left ventricular assist device and pharmacological therapy: a prospective study. Circulation. 2011;123:381–90. doi: 10.1161/CIRCULATIONAHA.109.933960. [DOI] [PubMed] [Google Scholar]
- 25.Ising M, Warren S, Sobieski MA, et al. Flow Modulation Algorithms for Continuous Flow Left Ventricular Assist Devices to Increase Vascular Pulsatility: A Computer Simulation Study. Cardiovascular Engineering and Technology. 2011;2:90–100. [Google Scholar]
- 26.Kishimoto Y, Takewa Y, Arakawa M, et al. Development of a novel drive mode to prevent aortic insufficiency during continuous-flow LVAD support by synchronizing rotational speed with heartbeat. J Artif Organs. 2013;16:129–37. doi: 10.1007/s10047-012-0685-x. [DOI] [PubMed] [Google Scholar]
- 27.Heredero A, Perez-Caballero R, Otero J, et al. Synchrony relationships between the left ventricle and a left ventricular assist device: an experimental study in pigs. Int J Artif Organs. 2012;35:272–78. doi: 10.5301/ijao.5000086. [DOI] [PubMed] [Google Scholar]
- 28.Frazier OH, Myers TJ. Left ventricular assist system as a bridge to myocardial recovery. Ann Thorac Surg. 1999;68:734–41. doi: 10.1016/s0003-4975(99)00801-2. [DOI] [PubMed] [Google Scholar]
- 29.Klotz S, Jan Danser AH, Burkhoff D. Impact of left ventricular assist device (LVAD) support on the cardiac reverse remodeling process. Prog Biophys Mol Biol. 2008;97:479–96. doi: 10.1016/j.pbiomolbio.2008.02.002. [DOI] [PubMed] [Google Scholar]
- 30.Manginas A, Tsiavou A, Sfyrakis P, et al. Increased number of circulating progenitor cells after implantation of ventricular assist devices. J Heart Lung Transplant. 2009;28:710–17. doi: 10.1016/j.healun.2009.04.006. [DOI] [PubMed] [Google Scholar]
- 31.Drakos SG, Athanasoulis T, Malliaras KG, et al. Myocardial sympathetic innervation and long-term left ventricular mechanical unloading. JACC Cardiovasc Imaging. 2010;3:64–70. doi: 10.1016/j.jcmg.2009.10.008. [DOI] [PubMed] [Google Scholar]
- 32.Chen Y, Park S, Li Y, et al. Alterations of gene expression in failing myocardium following left ventricular assist device support. Physiol Genomics. 2003;14:251–60. doi: 10.1152/physiolgenomics.00022.2003. [DOI] [PubMed] [Google Scholar]
- 33.Saito S, Matsumiya G, Sakaguchi T, et al. Cardiac fibrosis and cellular hypertrophy decrease the degree of reverse remodeling and improvement in cardiac function during left ventricular assist. J Heart Lung Transplant. 2010;29:672–79. doi: 10.1016/j.healun.2010.01.007. [DOI] [PubMed] [Google Scholar]
- 34.Gu K, Chang Y, Gao B, Liu Y. Computational analysis of the effect of the control model of intraaorta pump on ventricular unloading and vessel response. ASAIO J. 2012;58:455–61. doi: 10.1097/MAT.0b013e31825f3353. [DOI] [PubMed] [Google Scholar]
- 35.Drakos SG, Charitos CE, Ntalianis A, et al. Comparison of pulsatile with nonpulsatile mechanical support in a porcine model of profound cardiogenic shock. ASAIO J. 2005;51:26–29. doi: 10.1097/01.mat.0000150323.62708.35. [DOI] [PubMed] [Google Scholar]
- 36.Slaughter MS. Long-term continuous flow left ventricular assist device support and end-organ function: prospects for destination therapy. J Card Surg. 2010;25:490–94. doi: 10.1111/j.1540-8191.2010.01075.x. [DOI] [PubMed] [Google Scholar]
- 37.Osada T, Nagata H, Murase N, et al. Determination of comprehensive arterial blood inflow in abdominal-pelvic organs: impact of respiration and posture on organ perfusion. Med Sci Monit. 2011;17(2):CR57–66. doi: 10.12659/MSM.881388. [DOI] [PMC free article] [PubMed] [Google Scholar]
- 38.Nose Y. Nonpulsatile mode of blood flow required for cardiopulmonary bypass and total body perfusion. Artif Organs. 1993;17:92–102. [PubMed] [Google Scholar]
- 39.Undar A, Henderson N, Thurston GB, et al. The effects of pulsatile versus nonpulsatile perfusion on blood viscoelasticity before and after deep hypothermic circulatory arrest in a neonatal piglet model. Artif Organs. 1999;23:717–21. doi: 10.1046/j.1525-1594.1999.06408.x. [DOI] [PubMed] [Google Scholar]
- 40.John R, Mantz K, Eckman P, et al. Aortic valve pathophysiology during left ventricular assist device support. J Heart Lung Transplant. 2010;29:1321–29. doi: 10.1016/j.healun.2010.06.006. [DOI] [PubMed] [Google Scholar]
- 41.Boilson BA, Schirger AJ, Sareyyupoglu B, et al. Physiological changes following placement of continuous flow and pulsatile flow left ventricular assist devices. The Journal of Heart and Lung Transplantation. 2009;28:598. [Google Scholar]
- 42.Martina JR, Schipper ME, de Jonge N, et al. Analysis of aortic valve commissural fusion after support with continuous-flow left ventricular assist device. Interact Cardiovasc Thorac Surg. 2013;17:616–24. doi: 10.1093/icvts/ivt263. [DOI] [PMC free article] [PubMed] [Google Scholar]
- 43.Aggarwal A, Raghuvir R, Eryazici P, et al. The development of aortic insufficiency in continuous-flow left ventricular assist device-supported patients. Ann Thorac Surg. 2013;95:493–98. doi: 10.1016/j.athoracsur.2012.09.020. [DOI] [PubMed] [Google Scholar]
- 44.Di MA, Fresiello L, Ferrari G, et al. Circulatory Model, Including Interventricular Septum, to Analyze the Right Ventricular Function During LVAD Assistance. Int J Artif Organs. 2010;33:426. [Google Scholar]
- 45.Schwarz K, Singh S, Dawson D, Frenneaux MP. Right ventricular function in left ventricular disease: pathophysiology and implications. Heart Lung Circ. 2013;22:507–11. doi: 10.1016/j.hlc.2013.03.072. [DOI] [PubMed] [Google Scholar]
- 46.Chua J, Zhou W, Ho JK, et al. Acute right ventricular pressure overload compromises left ventricular function by altering septal strain and rotation. J Appl Physiol (1985) 2013;115:186–93. doi: 10.1152/japplphysiol.01208.2012. [DOI] [PMC free article] [PubMed] [Google Scholar]


