
Figure 2.
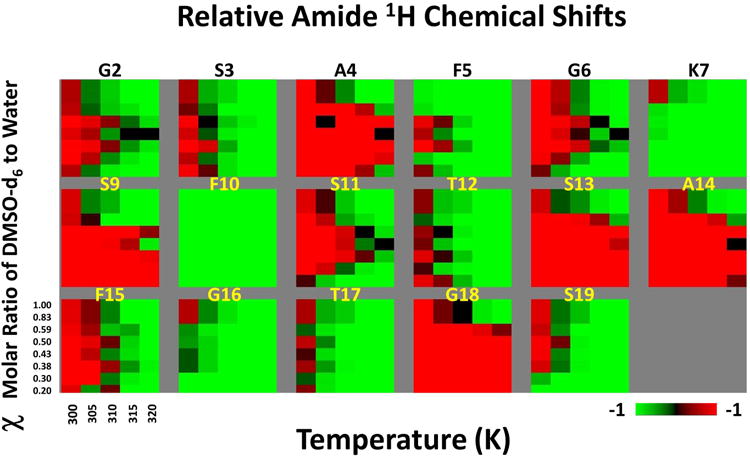
Heat map summarizing the solvent perturbation and temperature effects on the amide proton chemical shifts. Each panel represents a AA residue as labeled. The chemical shifts are normalized between -1 (green) to +1 (red) to highlight the relative effects.