

Abstract
The role of the inflammatory agent fibrinogen (Fg) in increased pial venular permeability has been shown previously. It was suggested that an activation of matrix metalloproteinase-9 (MMP-9) is involved in Fg-induced enhanced transcytosis through endothelial cells. However, direct link between Fg, caveolae formation, and MMP-9 activity has never been shown. We hypothesized that at an elevated level, Fg enhances formation of functional caveolae through activation of MMP-9. Male wild-type (WT, C57BL/6J) or MMP-9 gene knockout (MMP9−/−) mice were infused with Fg (4 mg/ml, final blood concentration) or equal volume of phosphate buffered saline (PBS). After 2 hours, mice were sacrificed and brains were collected for immunohistochemical analyses. Mouse brain endothelial cells were treated with 4 mg/ml of Fg or PBS in the presence or absence of MMP-9 activity inhibitor, tissue inhibitor of metalloproteinases-4 (TIMP-4, 12 ng/ml). Formation of functional caveolae was assessed by confocal microscopy. Fg-induced increased formation of caveolae, which was defined by an increased co-localization of caveolin-1 (Cav-1) and plasmalemmal vesicle-associated protein-1 (PV-1) and was associated with an increased phosphorylation of Cav-1, was ameliorated in the presence of TIMP-4. These results suggest that at high levels, Fg enhances formation of functional caveolae that may involve Cav-1 signaling and MMP-9 activation.
Keywords: Cerebrovascular permeability, Caveolin-1 phosphorylation, endothelial cells, caveolae, MMP-9, TIMP-4
INTRODUCTION
Inflammation is commonly accompanied by a microvascular leakage of plasma substances and proteins and their deposition in subendothelial matrix (SEM) and interstitium (1). These alterations exacerbate complications of blood circulation during vascular diseases and cause edema (1, 2). Blood plasma components may pass through the endothelial barrier via paracellular and transcellular pathways (1, 3, 4). Movement of substances by the paracellular pathway occurs between the endothelial cells (ECs) and involves alterations in tight, gap, and adherence junction proteins (1). The transcellular transport of proteins, transcytosis, is implemented by movement of substances across the endothelium and involve caveolae, caveolae generated transendothelial channels, and fenestrae (3).
Caveolae are distinct flask-shaped invaginated structures present at the surface of many cell types including ECs (5). Their walls are enriched in cholesterol, glycosphingolipids, and sphingomyelin (6). One of the main components of caveolae wall is caveolin-1 (Cav-1) (7). Therefore, caveolae are defined as specialized, morphologically distinct, sphingolipid-cholesterol microdomains, which are stabilized by the Cav-1 protein (8). Plasmalemmal vesicle associated protein-1 (PV-1) is an integral membrane-associated protein found in caveolae and in fenestral and stomatal diaphragms of fenestrated ECs and in transendothelial channels (9). It is considered a functional biomarker for altered vascular permeability following the central nervous system injury (10) and disruption of blood-brain barrier (BBB) (11). Expression of PV-1 is associated with caveolae formation (5, 9, 10, 12).
Matrix metalloproteinases (MMPs) are zinc-dependent endoproteinases expressed in various cell types including ECs. They are involved in physiological and pathological processes, especially in SEM degradation and vascular remodeling that disrupt the BBB (13). Activation of MMP-9, the most abundant MMP, plays an important role in decreasing of brain vascular endothelial layer integrity through degradation of EC junction proteins (13). It was found that MMP-9 can compartmentalize with caveolae structure (14). We have shown involvement of MMP-9 activity in homocysteine-induced EC layer permeability (15). However, role of MMP-9 in caveolae formation and its function is not clear.
Fibrinogen (Fg) is a 340 kDa glycoprotein that is involved in physiological and pathological processes and considered a biomarker (16, 17) and cause of inflammation (2, 18–22). We previously showed that Fg-induced macromolecular leakage occurs through both paracellular and transcellular transport pathways (22). The role of MMP-9 activity in Fg-induced downregulation of some junction proteins and thus in paracellular transport has also been demonstrated (19, 21).
In the present study we tested the hypothesis that at an increased content, Fg can be involved in formation of caveolae and in their function through activation of MMP-9. Our findings show that at high level, Fg enhances co-localization of Cav-1 and PV-1 (a possible marker of caveolae) in mouse brain vessels and in cultured mouse brain endothelial cells (MBECs), and the process can be mitigated by inhibition of MMP-9 activity. These results suggest that an increase in blood level of Fg, that occurs during inflammatory cerebrovascular and cardiovascular diseases such as stroke and hypertension, may be involved in caveolar transcytosis. The latter can be a mechanism for an increased cerebrovascular permeability that was seen in our previous study (22).
Materials and Methods
Animals
In accordance with the National Institutes of Health Guide for Care and Use of Laboratory Animals, all animal procedures for these experiments were reviewed and approved by the Institutional Animal Care and Use Committee of the University of Louisville.
Male wild-type (WT) C57BL/6J and MMP-9 gene knockout (MMP9−/−) homozygous (FVB.Cg-Mmp9tm1Tvu/J; Stock Number: 004104) mice were obtained from the Jackson Laboratory (Bar Harbor, ME). For genotyping of MMP9−/− mice, DNA was extracted from the tail tip of mice and was amplified by polymerase chain reaction (PCR) using specific primer sequences according to the protocol described previously (22).
Twelve-week old mice (26–30 g) were anesthetized with sodium pentobarbital (70 mg/kg, IP). Supplemental anesthesia was given as required during the experiment. 2% Xylocaine (AstraZeneca LP, Wilmington, DE) was used for local analgesia. The left carotid artery was cannulated with polyethylene tubing PE-10 for blood pressure monitoring and necessary infusions, while the trachea was cannulated to maintain a patent airway. Body temperature was kept at 37±1°C with a heating pad. Mean arterial blood pressure (MABP) and heart rate were continuously monitored through a carotid artery cannula connected to a transducer and a blood pressure analyzer (CyQ 103/302, Cybersense, Lexington, KY) and by a tail cuff and a CODA monitor, a non-invasive blood pressure measurement system (Kent Scientific Apparatus, Torrington, CT). The MABP monitoring with the tail cuff was necessary to detect possible blood pressure changes during infusion of phosphate buffered saline (PBS) or Fg.
Endothelial cell culture
MBECs (bEnd.3 cells) were purchased from ATCC (Manassas, VA). The endothelial nature of the cells was verified by uptake of acylated low-density lipoprotein and presence of CD-31 (23). The cells were cultured in complete Dulbecco’s modified eagle’s medium (DMEM), according to the manufacturer’s recommendation at 37 °C with 5% CO2/air in a humidified environment. The cells were used at the 5th or 6th passage for the experiments as described (21). MBECs were grown until confluent in 8-well chambered glass-bottomed plates (Nalge Nunc International, Rochester, NY).
Reagents and antibodies
Human Fg (FIB-3, depleted of plasminogen, von-Willebrand factor, and fibronectin) was purchased from Enzyme Research Laboratories (South Bend, IN). Rat anti-mouse PV-1 monoclonal antibody (clone: MECA-32; Isotype: IgG2a) was from AbD Serotec (Raleigh, NC). Polyclonal antibody against Cav-1 was obtained from Novus Biological (Littleton, CO). Purified mouse anti phospho-Cav-1 (pCav-1; pY14) and A431- Epidermal growth factor (A431-EGF) cell lysate were purchased from BD Biosciences (San Diego, CA). 4,6-diamidino-2-phenyl-indole HCl (DAPI) was from Santa Cruz Biotechnology (Santa Cruz, CA). Secondary antibodies conjugated with Alexa-Fluor 488 (chicken anti-rat IgG), or with Alexa-Fluor 594 (chicken anti-rat IgG and rabbit anti-goat IgG) were purchased from Invitrogen (Carlsbad, CA). Bovine serum albumin (BSA) was from Sigma Aldrich Chemicals Co. (St. Louis, MO). Normal Donkey Serum (NDS) was obtained from Jackson ImmunoResearch (West Grove, PA). Tetramethylrhodamine β-isothiocyanate (TRITC)- or fluorescein isothiocyanate (FITC)-conjugated Lycopersicon esculentum agglutinin (LEA) tomato lectin was from Vector laboratories (Burlingame, CA). Artificial cerebrospinal fluid (CSF, composition: Na 150 mM Na; 3.0 mM K; 1.4 mM Ca; 0.8 mM Mg; 1.0 mM P; 155 mM Cl) was purchased from Harvard Apparatus (Holliston, MA). RIPA buffer was from Boston BioProducts (Worcester, MA)
Immunohistochemistry
Fg (20 mg per 100 g of body weight) was infused (20 μl/min, over 10 min time period to have its total blood content of 4 mg/ml) through the carotid artery cannulation into the experimental mice. Mice in the control group were infused with the equal volume of PBS. Two hours after Fg or PBS infusion mice were infused with FITC- or TRITC-conjugated LEA via the carotid cannulation to fluorescently label moieties on the intravascular surface (2, 10, 22). Animals were deeply anesthetized with an overdose of pentobarbital and then sacrificed by exsanguination. The cranium was opened and the brain was gently dissected and removed for fresh tissue processing. Mouse brain tissue immunohistochemistry was done according to the method described earlier (10, 22). The brain was mounted in protective matrix (Polyscience, Inc, Warrington, PA) and cryosectioned using a Leica CM 1850 Cryocut (Bannockburn, IL). Twenty micrometer thick slices of the cortex were thaw-mounted on charged microscope slides (VWR, West Chester, PA) and stored at −80°C. Prior to immunostaining, slides were kept at −20°C overnight, and then warmed at 37°C for 20 min to remove the mounting matrix. The sections were post-fixed in ice-cold 100% methanol for 10 min, washed three times in Tris buffered saline (TBS) and blocked for non-specific epitope binding in 0.1% TritonX-100 TBS (TBS-T), 0.5% BSA and 10% NDS for 1 h at room temperature.
Primary antibodies (anti-Cav-1, anti-pCav-1, or anti-PV-1; dilution 1:50) were applied to brain slices overnight in a humidified chamber placed on a rotator at 4°C. After washing, corresponding fluorescent dye-conjugated secondary antibodies (dilution 1:100) were applied for 1 h at RT. Cell nuclei were labeled with DAPI (1:10000). Immunohistochemistry and confocal microscopy were used to detect Fg-induced changes in Cav-1 and PV-1 expressions in brain vasculature. The laser-scanning confocal microscope (Olympus FluoView1000, objective 100x) was used for image capture. Cav-1 was visualized using a HeNe-G laser (556 nm) to excite the dye, while emission was observed above 573 nm. FITC-LEA and PV-1 were visualized using a Multi Argon laser (495 nm) to excite the dye, while emission was observed above 519 nm. Cell nuclei (DAPI) were visualized using a 405-laser Diode (372 nm) to excite the dye, while emission was observed above 456 nm. Since in these experiments we compared fluorescence intensities between the groups, fluorescence intensity (for each color) was adjusted to its saturation point in an experimental group with the maximum fluorescence intensity for the color of interest (in our case, the group with the high Fg) and laser and multipliers’ settings were kept unaltered during measurements in each experimental series.
Off-line image analysis software (Image-Pro Plus, Media Cybernetics, Inc., Bethesda, MD) was used to assess expressions of Cav-1 and PV-1 and to detect level of pCav-1. For detection of Cav-1 or PV-1, corresponding rectangular areas of interests (AOIs) of the same size in all respective experimental groups were placed along the vessel wall (identified by presence of LEA). For each experimental group, 3–4 brain slices were analyzed. In each brain slice, three to five vascular images were analyzed for Cav-1, PV-1, and pCav-1 level assessments and normalized per length of the respective vascular segment. Fluorescence intensity in 4 randomly placed AOIs were measured. The results were averaged for each experimental group and presented as fluorescence intensity units (FIU).
To confirm that activation of MMP-9 has an effect on Fg-induced expression of Cav-1 and PV-1, we calculated the ratio of all variables (Cav-1 and PV-1 expression) for Fg-infused to PBS-infused in WT and MMP9−/− mice. To allow for statistical comparisons, the values of Fg-infused/PBS-infused for each WT or MMP9−/− mouse were calculated by dividing the each value in Fg-infused group by the mean value of the PBS-infused response. Average values determined for the Fg-induced/PBS-infused ratios in WT mice were compared with those in MMP9−/− mice. During image analysis, it is recommended to define co-localization of different objects in deconvoluted images (24). Therefore, to identify co-localization of Cav-1 and PV-1, the images were deconvoluted. Then “Masks” of co-localized objects for Cav-1 and PV-1 pairs were created and number and intensity of co-localized objects were analyzed. Degree of co-localization of these objects was assessed by measuring Pearson’s correlation (Rr), Overlap coefficient (R), and Mander’s coefficients k2 and m2.
Western blot analysis for expressions of Cav-1 and PV-1 and phosphorylation of Cav-1 in mouse brain and endothelial cells
Changes in protein content of Cav-1 and PV-1 in mouse brain samples and in cultured MBECs and phosphorylation of Cav-1 in MBECs were assessed by Western blot analysis according to the method described earlier (21). Briefly, brain cortical tissue or EC lysates were prepared by homogenization in ice-cold RIPA Lysis buffer. Cell debris was removed by centrifugation (20000xg, for 15 min). Protein concentration in samples was assessed using Bradford assay. Equal amount (30 μg) of proteins were resolved on 10% sodium-dodecyl sulfate-Polyacrylamide Gel Electrophoresis (SDS-PAGE) and blotted onto a polyvinylidene difluoride membrane. During Cav-1 phosphorylation assessment, A431-EGF cell lysate was used as a positive control for pCav-1. After transfer and washing with washing buffer, blots were incubated with anti-Cav-1 (1:200 dilutions), anti-PV-1(1:500 dilutions), or anti-pCav-1 (dilution 1:100) antibodies overnight at 4C° with gentle agitation. After incubation and washing with washing buffer, blots were incubated with appropriate secondary antibodies (1:5000 dilutions) and detected using a Pierce enhanced chemiluminescence (ECL) kit (Rockford, IL). Then, membranes were stripped and re-probed for GAPDH used as a loading control. The blots were analyzed with Image-Pro Plus software. Levels of protein expressions were assessed by the changes in integrated optical density (IOD) of each of the protein of interest and presented as a ration of IOD of each band of the protein of interest to the IOD of the respective GAPDH band.
Formation of functional caveolae
Since it is known that PV-1 is associated with caveolae (9) and Cav-1 is a main component of caveolae wall (7), it is likely that co-localization of these two proteins would define caveolae. However, not all caveolae are involved in transcytosis. Therefore, to define functional caveolae, for example the caveolae involved in albumin transcytosis, co-localization of PV-1 and BSA, Cav-1 and BSA, and PV-1, Cav-1, and BSA were identified. Therefore, Fg-induced possible formation of functional caveolae in cultured ECs was studied using the modified method described previously (15). Briefly, MBECs were treated with 4 mg/ml of Fg for 18 hours in the presence or absence of MMP-9 activity inhibitor TIMP-4 (12 ng/ml). The longer incubation of cultured cells with Fg and TIMP-4, as in our previous studies (19, 21), was necessary to establish their effects in cells. In contrast, the ECs in animals are already exposed to the basal level of Fg or lack MMP-9 activity (as in MMP9−/− mice). Cells treated with medium alone were used as a control group. Cells were incubated with FITC-BSA (50 μM) for 2 hours. After incubation, to remove free FITC-BSA cells were washed four times with PBS, fixed, and probed with primary antibodies against Cav-1 and PV-1 (dilution 1:100) and then stained with secondary antibodies (dilution 1:200) conjugated with Alexa Fluor-594 or Alexa Fluor-647 (respectively). Changes in caveolae formation and up take of FITC-BSA by caveolae were observed with the Olympus laser-scanning confocal microscope (FluoView1000, objective 100x).
The confocal image analyses were done by Image-Pro Plus software. Results were obtained as fluorescence intensities of Cav-1 and PV-1 and expressed as FIU. Virtual colors were given to each dye using Olympus Flouview software: Cav-1 is shown in red, PV-1 is green, and FITC-BSA is shown in blue. Co-localization of Cav-1 and PV-1 was detected as yellow color, while co-localization of Cav-1, PV-1, and FITC-BSA was shown in cyan color. While co-localization of Cav-1 and PV-1 indicated only the formed caveolae, co-localization of Cav-1 and BSA or PV-1 and BSA indicated the BSA up-taken by caveolae, which in this case can define caveolae as functional.
Similarly as above, to confirm that inhibition of MMP-9 activity affects Fg-induced expressions of Cav-1 and PV-1, ratios of all variables (Cav-1 and PV-1 expression) in Fg-treated group to control and Fg- and TIMP4-treated groups to TIMP4-treated group were calculated. To define co-localization of Cav-1, PV-1, and BSA, deconvolution of images were performed. “Masks” of co-localized objects for each pair (Cav-1 and PV-1, Cav-1 and BSA, and PV-1 and BSA) of objects were created and number and intensity of co-localized objects were analyzed. Degree of co-localization of these objects was assessed by measuring Rr, R, and Mander’s coefficients k2 and m2.
Data analysis
All data are expressed as mean ± SEM. The experimental groups were compared by one-way ANOVA. If ANOVA indicated a significant difference (P < 0.05), Tukey’s multiple comparison test was used to compare group means. Differences were considered significant if P < 0.05.
RESULTS
Fg-induced expression of Cav-1 and PV-1 in mouse cortical vessels
We did not find difference in MABP in animals after infusion of PBS: 114 ± 4 mmHg (before) vs 112 ± 5 mmHg (after) in WT, and 112 ± 3 mmHg (before) vs 111 ± 5 mmHg (after) in MMP9−/−mice, or after infusion of Fg: 110 ± 4 mmHg (before) vs 116 ± 5 mmHg (after) in WT and 113 ± 3 mmHg (before) vs 115 ± 4 mmHg (after) in MMP9−/− mice. Expressions of Cav-1 (red) and PV-1 (green) were greater after Fg than those after PBS infusion in both WT and MMP9−/− mice (Fig. 1). However, expressions of Cav-1 and PV-1 induced by the increased level of Fg were lesser in MMP9−/− mice than those in WT mice (Fig. 1). Expressions of Cav-1 and PV-1 were lesser after infusion of PBS in MMP9−/− than in WT mice (Fig. 1). Co-localization (defined by yellow spots) of these proteins in brain vessels of mice infused with Fg was also increased compared to that in mice infused with PBS suggesting a possible enhanced formation of caveolae (Fig. 1). Values of Pearson’s correlation, Overlap coefficient, and Mander’s coefficients that reflect analyses of co-localization of Cav-1 and PV-1 done on deconvoluted images shown on Fig. 1 are presented in Table 1. These effects of Fg were ameliorated in cortical vessels of MMP9−/− mice (Fig. 1 and Table 1). The presence of LEA (blue) clearly indicated vascular endothelium (Fig. 1). These data indicate a role of increased blood content of Fg in possible formation of caveolae in brain cortex vasculature.
Figure 1. Expression of caveolin-1 (Cav-1) and plasmalemmal vesicle-associated protein-1 (PV-1) in mouse brain cortical vessels.


A) Examples of vessel images in samples obtained from wild type (WT; two upper rows) and MMP-9 gene knockout (MMP9−/−; two lower rows) mice infused with phosphate buffered saline (PBS; first and third rows) or fibrinogen (Fg, final blood content - 4 mg/ml; second and forth rows). Expression of Cav-1 (red, first column) and PV-1 (green, second column) were assessed by measuring the fluorescence intensity of respective fluorochromes along the vascular segments. The third column represents images of co-localized (merged) Cav-1 and PV-1 with Lycopersicon esculentum agglutinin tomato lectin (blue) that was used as an endothelial marker. Images in the fourth column are obtained after deconvolution of images in the third column and show spots of co-localized Cav-1 and PV-1. Summaries of fluorescence intensity changes of Cav-1 (B), PV-1 (C), and their co-localization (D-fluorescence intensity and E-number of spots) in vascular segments after infusion of PBS or Fg.
P < 0.05 for all. * - vs. WT+PBS, † - vs. WT+Fg, ‡ - vs. (MMP9−/−)+PBS. n=4 for all groups.
Note: Data analyses were done on original images. However, for better visualization, brightness of “mask” images (the fourth column) has been increased by 90%.
Table 1.
Co-localization coefficients to assess level of co-localization of caveolin-1 (Cav-1, red) and plasmalemmal vesicle-associated protein-1 (PV-1, green) in wild type (WT) and MMP-9 gene knockout (MMP9−/−) mice infused with phosphate buffered saline (PBS) or fibrinogen (Fg).
| Co-localization | WT | MMP9−/− | ||
|---|---|---|---|---|
| PBS | Fg | PBS | Fg | |
| Cav-1/PV-1 (red/green) | ||||
| Pearson’s correlation Rr | 0.85 | 0.90 | 0.82 | 0.85 |
| Overlap coefficient R | 0.86 | 0.90 | 0.84 | 0.87 |
| Overlap coefficient k2 | 0.55 | 0.58 | 0.53 | 0.56 |
| Co-localization (ch1>0) m2 | 0.92 | 0.97 | 0.93 | 0.96 |
In WT mice, ratio of Fg-infused/PBS-infused for Cav-1 expression (2.02±0.18) was greater than that (1.33±0.04) in MMP9−/− mice (Fig. 1B). Similarly, ratio of Fg-infused/PBS-infused for PV-1 expression in WT mice (2.14±0.15) was greater than that (1.46±0.12) in MMP9−/− mice (Fig. 1C). These results suggest that although at an elevated level, Fg increases possible formation of caveolae in cortex of MMP9−/− mice, its effect in the presence of MMP-9 activity in WT mice is greater.
Protein content of Cav-1 and PV-1 in mouse brain tissue
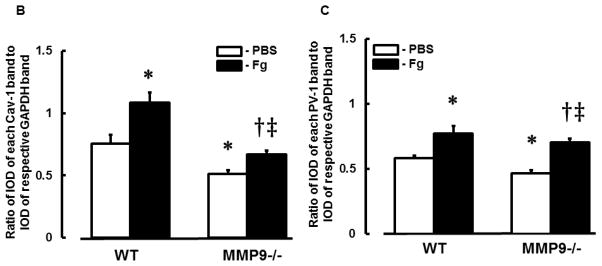
Content of both caveolae markers Cav-1 (Fig. 2, A and B) and PV-1 (Fig. 2, A and C) were greater in Fg-infused animals compared to those in PBS-infused mice. However, levels of Cav-1 and PV-1 were more in WT than in MMP9−/− animals (Fig. 2). These results confirm our findings presented in Fig. 1.
Figure 2. Content of caveolin-1 (Cav-1) and plasmalemmal vesicle-associated protein-1 (PV-1) in mouse brain.
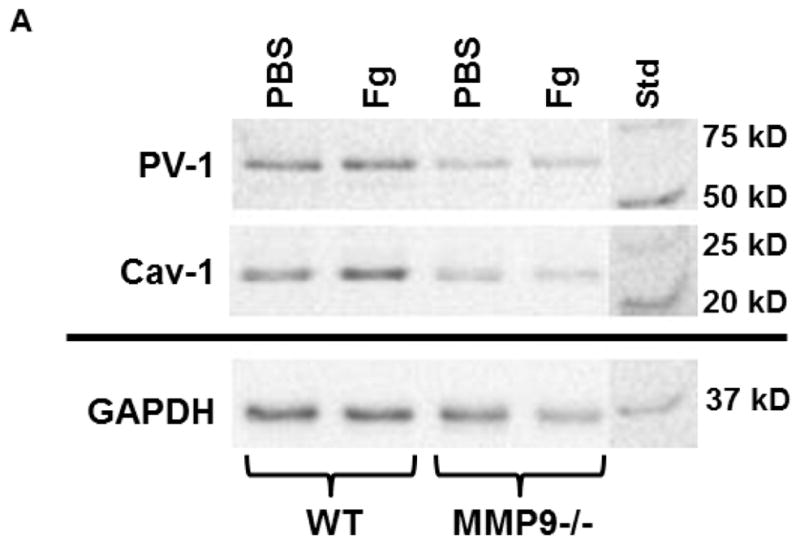
A) A representative Western blot for protein content of Cav-1 and PV-1 in WT and MMP9−/− mice infused with phosphate buffered saline (PBS) or 4 mg/ml fibrinogen (Fg) (top two rows). Membranes were reprobed for GAPDH (bottom row).
Data analyses for Cav-1 (B) and PV-1 (C) are shown. Relative protein expression in samples is presented as a ratio of integrated optical density (IOD) of each band to the IOD of the respective GAPDH band.
P < 0.05 for all. * - vs. WT+PBS, † - vs. WT+Fg, ‡ - vs. (MMP9−/−)+PBS. n=3 for all groups.
Fg-induced phosphorylation of Cav-1 in mouse cortical vessels
At an elevated level, Fg caused a greater phosphorylation of Cav-1 in cortical vessels of WT mice (Fg-infused) compared to that in vessels of WT mice infused with PBS (Fig. 3). This effect of Fg was significantly less in MMP9−/− mice (Fig. 3). Moreover, phosphorylation of Cav-1 was almost absent in MMP9−/− mice infused with PBS indicating a role of MMP-9 activation in Cav-1 regulation (Fig. 3). These data suggest that Fg-induced possible formation of caveolae found in mouse brain cortical vessels can occur via Cav-1 signaling mechanism.
Figure 3. Phosphorylation of caveolin-1 (pCav-1) in mouse brain cortical vessels.

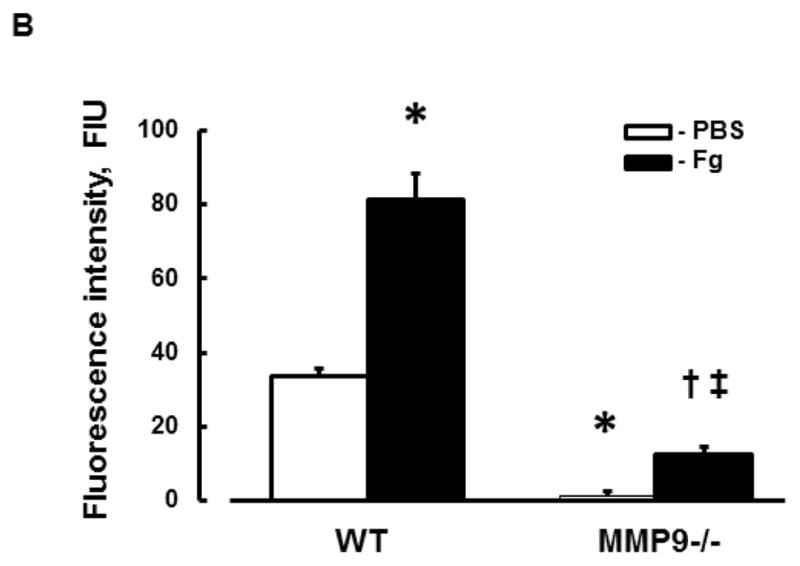
A) Examples of mouse brain cortical vessel images in samples obtained from wild type (WT; first column) and MMP-9 gene knockout (MMP9−/−; second column) mice infused with phosphate buffered saline (PBS; first row) or fibrinogen (Fg, final blood content - 4 mg/ml; second row). The level of pCav-1 (green) was assessed by measurement of fluorescence intensity along the vascular segment. DAPI-labeled vascular cell nuclei (blue).
B) Summary of fluorescence intensity changes in vascular segments after infusion of PBS or Fg.
P < 0.05 for all. * - vs. WT+PBS, † - vs. WT+Fg, ‡ - vs. (MMP9−/−)+PBS; n=3 for all groups.
Fg-induced possible formation of functional caveolae in MBECs
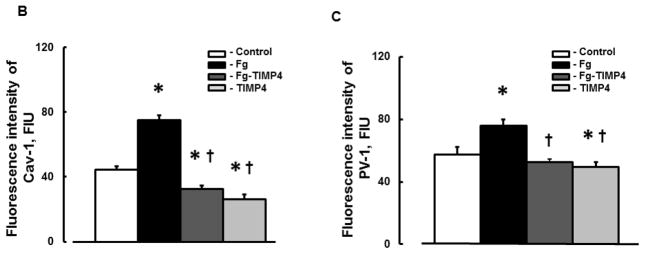
Expressions of Cav-1 (red) and PV-1 (green) were increased in MBECs treated with 4 mg/ml of Fg than those in the cells treated with medium alone (Fig. 4). Co-localization (yellow) of these proteins in cells treated with Fg was also greater than that in control, medium-treated cells (Fig. 4). Expression of each of the caveolae markers (Cav-1 and PV-1) and intensity of their co-localization, as well as the number of objects with co-localized Cav-1 and PV-1, were mitigated by the presence of MMP-9 activity inhibitor TIMP-4 (Fig. 4). TIMP-4 alone did not have an effect on expression of Cav-1 or PV-1 or on their co-localization (Fig. 4).
Figure 4. Fibrinogen (Fg)-induced formation of functional caveolae in mouse brain endothelial cells (MBECs).


A) Examples of images of MBECs treated with medium alone (control, first row), 4 mg/ml of Fg (Fg, second row), 4 mg/ml of Fg in the presence of 12 ng/ml tissue inhibitor of metalloproteinases-4 (TIMP-4)(Fg-TIMP4, third row), and with 12 ng/ml TIMP-4 alone (TIMP4, forth row). Expression of caveolin-1 (Cav-1, red; first column) and plasmalemmal vesicle-associated protein-1 (PV-1, green; second column) were detected by measuring the fluorescence intensity of respective dyes in cells. Co-localization of anti-Cav-1 antibody (red) and anti-PV-1 (green) defines caveolae (yellow). White arrows indicate free, fluorescently-labeled (blue color) bovine serum albumin (BSA) located in cell cytosol or outside of cells; Red arrows indicate fluorescently-labeled BSA taken up by caveolae (cyan color as a result of co-localization of Cav-1, PV-1, and BSA), which defines the functional caveolae.
Summaries of fluorescence intensity changes of Cav-1 (B) and PV-1 (C) in MBECs
D) Examples of mask images of co-localization of Cav-1 and PV-1 (second column), Cav-1 and BSA (third column), and PV-1 and BSA (forth column) obtained after deconvolution (Deconvoluted; first column) of merged images (Merged) shown in Fig. 4, A.
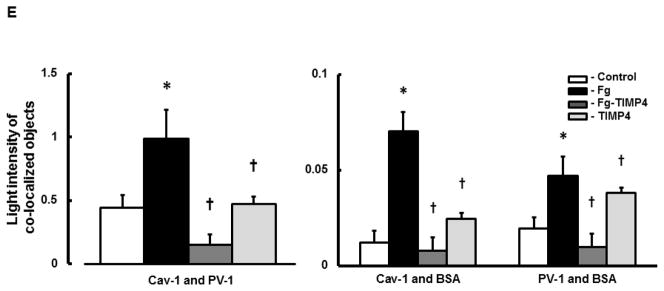
E) Light intensity values of co-localized Cav-1 and PV-1(second column), Cav-1 and BSA (third column), and PV-1 and BSA (fourth column) objects in mask images.
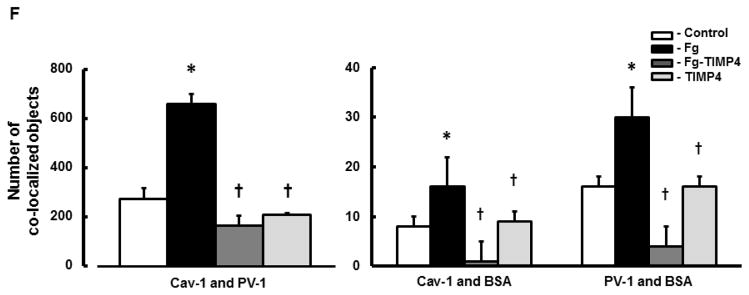
F) Number of co-localized Cav-1 and PV-1 (second column), Cav-1 and BSA (third column), and PV-1 and BSA (fourth column) objects in mask images.
P < 0.05 for both. * - vs. Control, † - vs. Fg; n=5 for all groups.
Note: Co-localization of Cav-1 and PV-1 indicates formed caveolae. Co-localization of Cav-1 and BSA and PV-1 and BSA indicate functional caveolae that have taken up BSA. Data analyses were done on original images. However, for better visualization, brightness of mask images (the last three columns on D) has been increased by 90%.
Functional caveolae identified by co-localization of Cav-1, PV-1, and BSA (defined by cyan color), most likely indicated caveolae with engulfed BSA (Fig. 4, red arrows). Some BSA (blue), not associated with Cav-1 or PV-1, most likely were located in cytosol, cellular wall, or outside of the cells (Fig. 4, indicated with white arrows). Co-localization of caveolae markers (Cav-1 and PV-1) with BSA (indicated with red arrows) was greater in Fg treated cells compared to those in cells treated with medium or TIMP-4 alone (Fig. 4). The association (co-localization) of PV-1 and/or Cav-1 with BSA was ameliorated in Fg treated cells in the presence of TIMP-4 (Fig. 4). Values of Pearson’s correlation, Overlap coefficient, and Mander’s coefficients presented in Table 2, were all higher in Fg-treated than in medium-treated (control) cells. These effects of Fg were ameliorated in the presence of TIMP-4 (Table 2). Results of these experiments confirm that at an elevated Fg enhances possible formation of functional caveolae (shown by association of Cav-1 and PV-1 with BSA).
Table 2.
Co-localization coefficients to assess level of co-localization of caveolin-1 (Cav-1, red), plasmalemmal vesicle-associated protein-1 (PV-1, green), and fluorescein isothiocyanate-conjugated bovine serum albumin (FITC-BSA, blue) in cultured mouse brain endothelial cells treated with medium alone (control), 4 mg/ml of Fg, (Fg), 4 mg/ml of Fg in the presence of 12 ng/ml tissue inhibitor of metalloproteinases-4 (Fg-TIMP4), and with TIMP-4 alone (TIMP4).
| Co-localization | Control | Fg | Fg-TIMP4 | TIMP4 |
|---|---|---|---|---|
| Cav-1/PV-1 (red/green) | ||||
| Pearson’s correlation Rr | 0.74 | 0.79 | 0.71 | 0.75 |
| Overlap coefficient R | 0.78 | 0.83 | 0.75 | 0.78 |
| Overlap coefficient k2 | 0.57 | 0.8 | 0.47 | 0.6 |
| Co-localization (ch1>0) m2 | 0.76 | 0.82 | 0.7 | 0.75 |
| Cav-1/BSA (red/blue) | ||||
| Pearson’s correlation Rr | 0.09 | 0.16 | 0.09 | 0.09 |
| Overlap coefficient R | 0.15 | 0.25 | 0.16 | 0.16 |
| Overlap coefficient k2 | 0.14 | 0.4 | 0.2 | 0.14 |
| Co-localization (ch1>0) m2 | 0.47 | 0.6 | 0.46 | 0.43 |
| PV-1/BSA (green/blue) | ||||
| Pearson’s correlation Rr | 0.11 | 0.23 | 0.14 | 0.13 |
| Overlap coefficient R | 0.19 | 0.33 | 0.22 | 0.2 |
| Overlap coefficient k2 | 0.24 | 0.7 | 0.4 | 0.22 |
| Co-localization (ch1>0) m2 | 0.68 | 0.9 | 0.73 | 0.64 |
In cells treated with or without Fg, ratio of Fg-treated/control for Cav-1 expression (1.69 ± 0.06) was greater than ratio of Fg-TIMP4/TIMP4 (1.25 ± 0.07) for Cav-1 expression (from Fig. 4B). Similarly, ratio of Fg-treated/control for PV-1 expression (1.33 ± 0.07) was greater than ratio of Fg-TIMP4/TIMP4 (1.06 ± 0.05) for PV-1 expression (from Fig. 4C). These results suggest that effect of elevated level of Fg in possible formation of functional caveolae is greater in the presence of MMP-9 activity than in its absence.
Protein content of Cav-1 and PV-1 in MBECs
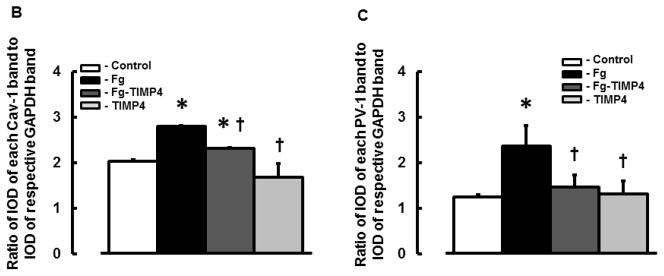
Content of both caveolae markers Cav-1 (Fig. 5, A and B) and PV-1 (Fig. 5, A and C) were greater in Fg-treated cells compared to those in cells treated with medium alone (control). Presence of TIMP-4 decreased expression of Fg-induced expression of Cav-1 and PV-1 (Fig. 5). Treatment of cells with TIMP-4 alone did not have an effect on cell expression of Cav-1 or PV-1 (Fig. 5). These results confirm our findings presented in Fig. 4.
Figure 5. Content of caveolin-1 (Cav-1) and plasmalemmal vesicle-associated protein-1 (PV-1) in cultured mouse brain endothelial cells (MBECs).
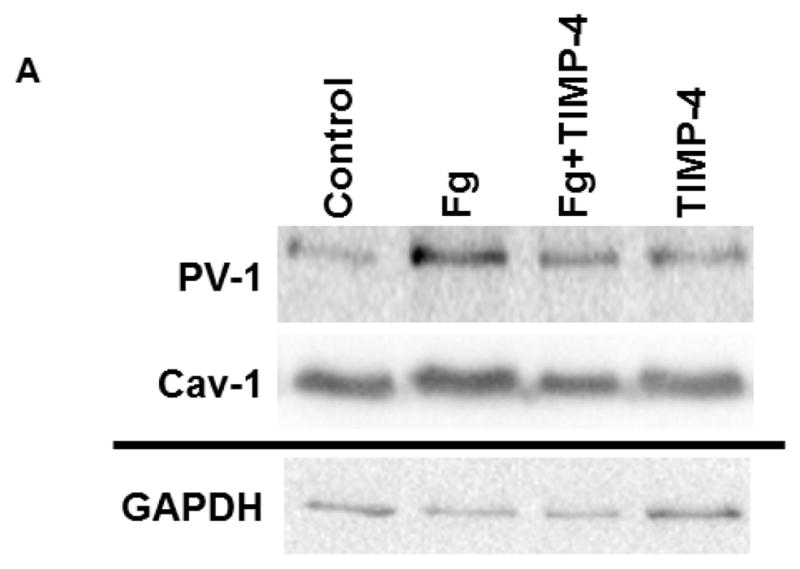
A) A representative Western blots for protein contents of PV-1 and Cav-1 in MBECs treated with medium alone (control), 4 mg/ml of Fg, 4 mg/ml of Fg in the presence of 12 ng/ml TIMP-4 (Fg-TIMP4), and with 12 ng/ml TIMP-4 alone (TIMP4). Membranes were reprobed for GAPDH (bottom row).
Data analyses for Cav-1 (B) and PV-1 (C) are shown. Relative protein expression in samples is presented as a ratio of integrated optical density (IOD) of each band to the IOD of the respective GAPDH band.
P < 0.05 for all. * - vs. control, † - vs. Fg. n=3 for all groups.
Fg-induced phosphorylation of Cav-1 in MBECs
At an elevated level, Fg enhanced phosphorylation of Cav-1 in cultured MBECs (Fig. 6, A and B). This effect of Fg was lesser in the presence of TIMP-4 (Fig. 6). Treatment of cells with TIMP-4 alone did not have an effect on phosphorylation of Cav-1 (Fig. 6). These results indicate a strong effect of high level of Fg on phosphorylation of Cav-1 and the role MMP-9 activity in this process.
Figure 6. Phosphorylation of Cav-1 (pCav-1) in cultured mouse brain endothelial cells (MBECs).
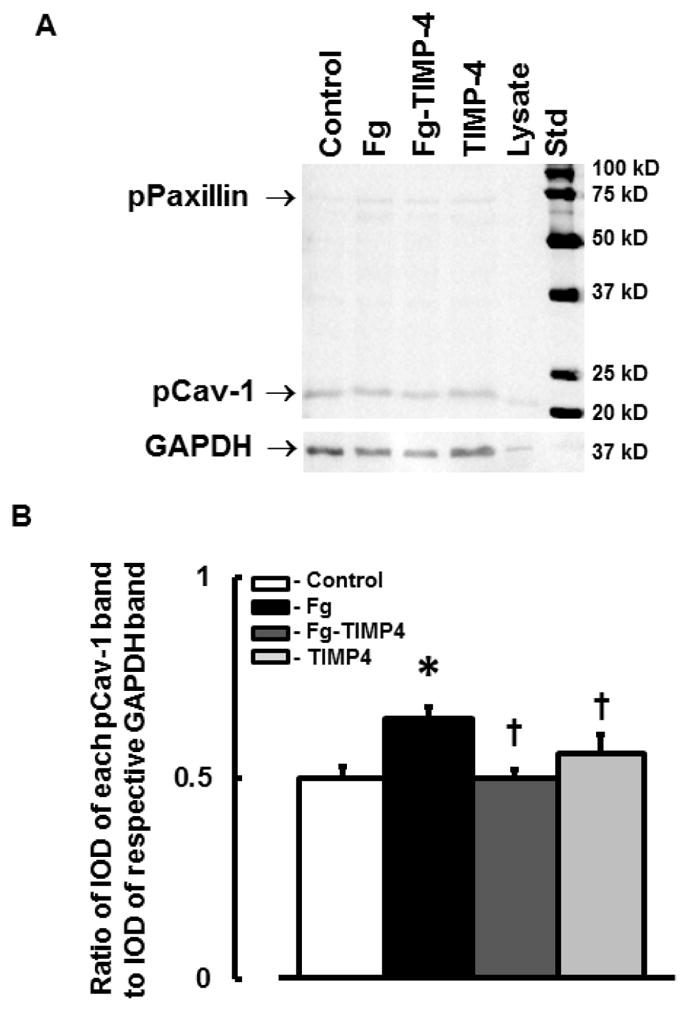
A) A representative Western blot image for phosphorylation of Cav-1 in MBECs treated with medium alone (control), 4 mg/ml of Fg, 4 mg/ml of Fg in the presence of 12 ng/ml TIMP-4 (Fg-TIMP4), and with 12 ng/ml TIMP-4 alone (TIMP4). Cell lysate (Lysate) was used as a positive control for pCav-1. The membrane was reprobed for GAPDH (bottom row).
B) Data analyses for pCav-1. Relative protein expression in samples is presented as a ratio of integrated optical density (IOD) of each band to the IOD of the respective GAPDH band.
P < 0.05 for all. * - vs. control, † - vs. Fg, n=3 for all groups.
Note: The antibody pY14 used to identify phosphorylated Cav-1 also cross-reacts with phosphorylated paxillin (pPaxillin). Phosphorylation of paxillin was significantly lesser than that of Cav-1. In addition, changes in paxillin phosphorylation correlated with that of Cav-1 (data are not presented).
DISCUSSION
Previously we showed that an increase in blood content of Fg enhances macromolecular leakage in mouse pial venules (22). Fg-induced changes in BBB integrity were accompanied with increased expression of PV-1 and activation of MMP-9 in mouse cortical vessels (22). Both increased pial venular permeability and enhanced expression of PV-1 were ameliorated in MMP9−/− mice (22). Since expression of PV-1 is associated with caveolae (9), these results suggested that at high level, Fg enhances pial venular permeability by increasing formation of caveolae secondary to MMP-9 activation. In the present study, we showed that at an increased level, Fg increases expression of both caveolae markers PV-1 and Cav-1 and increases an extent of their co-localization in mouse cortical vessels and MBECs compared to those in respective control groups. These effects of Fg were ameliorated in the absence of MMP-9 activity. These results confirm our hypothesis that at an increased level, Fg enhances caveolae formation and this process involves activation of MMP-9.
It is well documented that Cav-1 is a main building component of caveolae wall (7). Studies from several laboratories suggested that phosphorylation of Cav-1 plays an essential role in the caveolae formation mechanisms (25–29). Phosphorylation of another protein, dynamin signals assembly of the dynamin ring on caveolar necks indicating formation of static caveolae (30). However, motility of caveolae is mediated by phosphorylation-dependent signaling events associated with caveolae following the binding of albumin to its endothelial receptor gp60 in caveolae (29). We found that expression of Cav-1 is lower in MMP9−/− mice and, as a result, there is a limited or no phosphorylation of Cav-1 in these mice. Greater phosphorylation of Cav-1 in Fg-treated MMP9−/− mice than in PBS-treated MMP9−/− mice, confirms that Fg-induces Cav-1 signaling (phosphorylation). These results, in general, were confirmed in our study on cultured MBECs, where phosphorylation of Cav-1 was enhanced after Fg treatment and it was diminished during inhibition of MMP-9 activity. Others have shown correlation of MMP-9 activity with protein level of Cav-1 (31, 32). Our data indicate a role of MMP-9 activity on expression of Cav-1 and its phosphorylation, and thus confirm a strong interaction between activity of MMP-9 and Cav-1 expression. Moreover, it has been shown that Cav-1 co-localizes with MMP’s on cellular surface which facilitate directed proteolysis essential for early migratory and invasive processes (14). Our findings indicate that at an elevated level, Fg enhances possible formation of caveolae in mouse cortical vessels and in cultured MBECs triggering the phosphorylation of Cav-1. Co-localization of albumin with caveolae (defined by association of BSA with Cav-1 and BSA with PV-1) indicates possible uptake of the protein by caveolae. Although we did not define precise location of caveolae with engulfed albumin (in cytosol or plasma membrane), our findings suggest that since caveolae are associated with albumin they are most likely functional and carry albumin across the cell. This caveolae formation and its function (uptake of albumin) were closely associated with activation of MMP-9.
Upregulation of PV-1 in brain vasculature during BBB disruption in rodents has already been demonstrated (11). Our finding that increased blood content of Fg causes greater expression of PV-1 in WT than in MMP9−/− mice, indicates that at high level, Fg may enhance transendothelial transport through formation of caveolae and/or fenestrae or transendothelial channel via activation of MMP-9. We have shown that at high blood content, Fg enhances cerebrovascular leakage (22) and permeability of MBEC layer to albumin (21) through Fg-induced activation of MMP-9. In combination with the present findings and considering that expression of PV-1 is associated with caveolae formation, these results suggest that an increase in blood content of Fg activates transendothelial transport mechanism through activation of MMP-9.
Thus, our data show that at an elevated level, Fg most likely enhances formation of caveolae and its functionality are in strong association with activity of MMP-9. However, it is not clear if activation of MMP-9 leads to caveolae formation or the latter causes the activation of MMP-9. We have previously shown that at an elevated level, Fg decreases expression of EC junction proteins and causes their translocation to cytosol (19, 21, 22) through activation of MMP-9 (21, 22). In addition, we found that at higher levels, Fg enhances formation of filamentous actin (18). It has been shown that junction proteins and caveolae are interconnected (33). Therefore, it is possible that MMP-9 activity and caveolae formation and its function, in addition to the direct interaction of Cav-1 and MMP-9 (14), can be associated through junction proteins and filamentous actin (which can serve as a channel for caveolae movement. We have also shown that hyperhomocysteinemia increases formation of caveolae and its function along with activation of MMP-9 (15). These results indicate that there may be a source-independent association between the activity of MMP-9 and formation of functional caveolae. In other words, an inflammatory stimulation enhances caveolae formation through activation of MMP-9. However, additional studies are needed to define a prevailing role of one or the other during an inflammation.
In conclusion, the present study suggests that at an increased blood level, Fg enhances formation of functional caveolae in MBECs. This enhanced functionality of caveolae can be one of the mechanisms involved in Fg-induced increased cerebrovascular permeability via mainly the transcellular transport pathway seen in our previous study (34). However, the involvement of paracellular transport should not be ruled out. There is evidence that both paracellular and transcellular transport pathways can be governed by activation of MMP-9. Thus, the present study suggests a possible role of increased Fg content in alteration of BBB leading to edema, which can exacerbate vascular complications during inflammatory cardiovascular and cerebrovascular pathologies, such as hypertension, stroke, and traumatic brain injury.
Limitations of the study
The samples used for Western blot analyses were from brain tissue and not specifically from brain vessels. It has been show that Cav-1 is present in brain astroglial cells (35). Therefore, Western blot analyses may not necessarily show effects of elevated level of Fg on Cav-1 in brain vessels. In this respect, immunohistochemical analysis of animal brain samples provides the more adequate information on co-localization of Cav-1 and PV-1 and thus possible formation of caveolae in brain vessels. Although the method to define functional caveolae by co-localization of caveolae markers and albumin is quite an adequate technique, further studies are needed to define caveolae motility. This can be done by fluorescence resonance energy transfer (FRET) and total internal reflection fluorescence microscopies. These studies are ongoing in our lab.
The antibody (pY14 ) used in the present study, to define phosphorylated Cav-1 has also been reported to cross-react to phosphorylated paxillin, observable to migrate at ~ 68 kDa (36). Therefore, images shown in Fig. 6 indicate phosphorylation of both Cav-1 and paxillin. Since we have shown that Fg can affect EC actin filaments (18) and paxillin is known to be connected to regulators of actin organization, it is possible that Fg increases phosphorylation of Cav-1 and paxillin. The results of the present study show that these effects of Fg are lesser in the absence of MMP-9 activity. In our previous study we showed that Fg increases cerebrovascular permeability via mainly transcellular transport pathway (34). Based on these results and the results of the present study we may conclude that Fg induces phosphorylation mainly of Cav-1 and to lesser extent that of paxillin. Similar effects are expected for immunohistochemical analyses of the brain vessels (Fig. 3): high level of Fg increases phosphorylation predominantly of Cav-1 and has lesser effect on paxillin.
In the present study we found that MMP-9 activity is involved in Fg-induced possible formation of caveolae. However, precise mechanism of its action is not clear. It was indicated that MMP-9 compartmentalizes within caveolae (14). It is also known that MMP-9 can digest junction proteins that are linked to actin filaments. This may affect caveolar motility. As a result, MMP-9 may act as an internal (inside the caveolae) and external (digesting the junction proteins) factor. As this is a speculation, the precise mechanisms of MMP-9-mediated caveolae formation need to be investigated further.
Acknowledgments
Grant sponsors:
Contract grant sponsor: NIH; Contract grant number: P30 GM-103507 (to DL)
Contract grant sponsor: NIH; Contract grant number: NS-084823 (to DL and SCT)
Contract grant sponsor: NIH; Contract grant number: HL-071010 (to SCT)
Contract grant sponsor: NIH; Contract grant number: NS-051568 (to SCT)
References
- 1.Mehta D, Malik AB. Signaling mechanisms regulating endothelial permeability. Physiological Reviews. 2006;86:279–367. doi: 10.1152/physrev.00012.2005. [DOI] [PubMed] [Google Scholar]
- 2.Lominadze D, Dean WL, Tyagi SC, Roberts AM. Mechanisms of fibrinogen-induced microvascular dysfunction during cardiovascular disease. Acta Physiologica. 2010;198:1–13. doi: 10.1111/j.1748-1716.2009.02037.x. [DOI] [PMC free article] [PubMed] [Google Scholar]
- 3.Simionescu M, Popov D, Sima A. Endothelial transcytosis in health and disease. Cell and Tissue Research. 2009;335:27–40. doi: 10.1007/s00441-008-0688-3. [DOI] [PubMed] [Google Scholar]
- 4.Komarova Y, Malik AB. Regulation of endothelial permeability via paracellular and transcellular transport pathways. Annual Review of Physiology. 2010;72:463–493. doi: 10.1146/annurev-physiol-021909-135833. [DOI] [PubMed] [Google Scholar]
- 5.Stan RV, Marion K, Palade GE. PV-1 is a component of the fenestral and stomatal diaphragms in fenestrated endothelia. Proceedings of the National Academy of Sciences of the United States of America. 1999;96:13203–13207. doi: 10.1073/pnas.96.23.13203. [DOI] [PMC free article] [PubMed] [Google Scholar]
- 6.Razani B, Woodman SE, Lisanti MP. Caveolae: From Cell Biology to Animal Physiology. Pharmacological Reviews. 2002;54:431–467. doi: 10.1124/pr.54.3.431. [DOI] [PubMed] [Google Scholar]
- 7.Yu J, Bergaya S, Murata T, Alp IF, Bauer MP, Lin MI, Drab M, Kurzchalia TV, Stan RV, Sessa WC. Direct evidence for the role of caveolin-1 and caveolae in mechanotransduction and remodeling of blood vessels. Journal of Clinical Investigation. 2006;116:1284. doi: 10.1172/JCI27100. [DOI] [PMC free article] [PubMed] [Google Scholar]
- 8.Parton RG, Simons K. The multiple faces of caveolae. Nat Rev Mol Cell Biol. 2007;8:185–194. doi: 10.1038/nrm2122. [DOI] [PubMed] [Google Scholar]
- 9.Hnasko R, McFarland M, Ben-Jonathan N. Distribution and characterization of plasmalemma vesicle protein-1 in rat endocrine glands. J Endocrinol. 2002;175:649–661. doi: 10.1677/joe.0.1750649. [DOI] [PubMed] [Google Scholar]
- 10.Mozer A, Whittemore S, Benton R. Spinal microvascular expression of PV-1 is associated with inflammation, perivascular astrocyte loss, and diminished EC glucose transport potential in acute SCI. Current Neurovascular Research. 2010;7:238–250. doi: 10.2174/156720210792231840. [DOI] [PubMed] [Google Scholar]
- 11.Shue E, Carson-Walter E, Liu Y, Winans B, Ali Z, Chen J, Walter K. Plasmalemmal vesicle associated protein-1 (PV-1) is a marker of blood-brain barrier disruption in rodent models. BMC Neuroscience. 2008;9:29. doi: 10.1186/1471-2202-9-29. [DOI] [PMC free article] [PubMed] [Google Scholar]
- 12.Carson-Walter E, Hampton J, Shue E, Geynisman D, Pillai P, Sathanoori R, Madden S, Hamilton R, Walter K. Plasmalemmal vesicle associated protein-1 is a novel marker implicated in brain tumor angiogenesis. Clinical Cancer Research. 2005;11:7643–7650. doi: 10.1158/1078-0432.CCR-05-1099. [DOI] [PubMed] [Google Scholar]
- 13.Rosell A, Ortega-Aznar A, Alvarez-Sabin J, Fernandez-Cadenas I, Ribo M, Molina CA, Lo EH, Montaner J. Increased brain expression of matrix metalloproteinase-9 after ischemic and hemorrhagic human stroke. Stroke. 2006;37:1399–1406. doi: 10.1161/01.STR.0000223001.06264.af. [DOI] [PubMed] [Google Scholar]
- 14.Phillips PG, Birnby LM. Nitric oxide modulates caveolin-1 and matrix metalloproteinase-9 expression and distribution at the endothelial cell/tumor cell interface. American Journal of Physiology - Lung Cellular and Molecular Physiology. 2004;286:L1055–L1065. doi: 10.1152/ajplung.00262.2003. [DOI] [PubMed] [Google Scholar]
- 15.Munjal C, Tyagi N, Lominadze D, Tyagi S. Matrix metalloproteinase-9 in homocysteine-induced intestinal microvascular endothelial paracellular and transcellular permeability. J Cell Biochem. 2012;113:1159–1169. doi: 10.1002/jcb.23451. [DOI] [PMC free article] [PubMed] [Google Scholar]
- 16.Danesh J, Lewington S, Thompson SG, Lowe GD, Collins R, Kostis JB, Wilson AC, Folsom AR, Wu K, Benderly M, Goldbourt U, Willeit J, Kiechl S, Yarnell JW, Sweetnam PM, Elwood PC, Cushman M, Psaty BM, Tracy RP, Tybjaerg-Hansen A, Haverkate F, de Maat MP, Fowkes FG, Lee AJ, Smith FB, Salomaa V, Harald K, Rasi R, Vahtera E, Jousilahti P, Pekkanen J, D’Agostino R, Kannel WB, Wilson PW, Tofler G, Arocha-Pinango CL, Rodriguez-Larralde A, Nagy E, Mijares M, Espinosa R, Rodriquez-Roa E, Ryder E, Diez-Ewald MP, Campos G, Fernandez V, Torres E, Coll E, Marchioli R, Valagussa F, Rosengren A, Wilhelmsen L, Lappas G, Eriksson H, Cremer P, Nagel D, Curb JD, Rodriguez B, Yano K, Salonen JT, Nyyssonen K, Tuomainen TP, Hedblad B, Lind P, Loewel H, Koenig W, Meade TW, Cooper JA, De Stavola B, Knottenbelt C, Miller GJ, Bauer KA, Rosenberg RD, Sato S, Kitamura A, Naito Y, Iso H, Rasi V, Palosuo T, Ducimetiere P, Amouyel P, Arveiler D, Evans AE, Ferrieres J, Juhan-Vague I, Bingham A, Schulte H, Assmann G, Cantin B, Lamarche B, Despres JP, Dagenais GR, Tunstall-Pedoe H, Woodward M, Ben Shlomo Y, Davey SG, Palmieri V, Yeh JL, Rudnicka A, Ridker P, Rodeghiero F, Tosetto A, Shepherd J, Ford I, Robertson M, Brunner E, Shipley M, Feskens EJ, Kromhout D, Fibrinogen SC. Plasma fibrinogen level and the risk of major cardiovascular diseases and nonvascular mortality: an individual participant meta-analysis. JAMA. 2005;294(14):1799–809. doi: 10.1001/jama.294.14.1799. [DOI] [PubMed] [Google Scholar]
- 17.Ross R. Mechanisms of disease - Atherosclerosis - An inflammatory disease. New England Journal of Medicine. 1999;340:115–126. doi: 10.1056/NEJM199901143400207. [DOI] [PubMed] [Google Scholar]
- 18.Tyagi N, Roberts AM, Dean WL, Tyagi SC, Lominadze D. Fibrinogen induces endothelial cell permeability. Molecular & Cellular Biochemistry. 2008;307:13–22. doi: 10.1007/s11010-007-9579-2. [DOI] [PMC free article] [PubMed] [Google Scholar]
- 19.Patibandla PK, Tyagi N, Dean WL, Tyagi SC, Roberts AM, Lominadze D. Fibrinogen induces alterations of endothelial cell tight junction proteins. Journal of Cellular Physiology. 2009;221:195–203. doi: 10.1002/jcp.21845. [DOI] [PMC free article] [PubMed] [Google Scholar]
- 20.Kerlin B, Cooley BC, Isermann BH, Hernandez I, Sood R, Zogg M, Hendrickson SB, Mosesson MW, Lord S, Weiler H. Cause-effect relation between hyperfibrinogenemia and vascular disease. Current Opinion in Hematology. 2004;103:1728–1734. doi: 10.1182/blood-2003-08-2886. [DOI] [PubMed] [Google Scholar]
- 21.Muradashvili N, Tyagi N, Tyagi R, Munjal C, Lominadze D. Fibrinogen alters mouse brain endothelial cell layer integrity affecting vascular endothelial cadherin. Biochemical and Biophysical Research Communications. 2011;413:509–514. doi: 10.1016/j.bbrc.2011.07.133. [DOI] [PMC free article] [PubMed] [Google Scholar]
- 22.Muradashvili N, Qipshidze N, Munjal C, Givvimani S, Benton RL, Roberts AM, Tyagi SC, Lominadze D. Fibrinogen-induced increased pial venular permeability in mice. Journal of Cerebral Blood Flow and Metabolism. 2012;32:150–163. doi: 10.1038/jcbfm.2011.144. [DOI] [PMC free article] [PubMed] [Google Scholar]
- 23.Lincoln DW, Larsen AM, Phillips PG, Bove K. Isolation of murine aortic endothelial cells in culture and the effects of sex steroids on their growth. In Vitro Cell Dev Biol Anim. 2003;39:140–145. doi: 10.1007/s11626-003-0008-x. [DOI] [PubMed] [Google Scholar]
- 24.Manders EMM, Verbeek FJ, Aten JA. Measurement of co-localization of objects in dual-colour confocal images. Journal of Microscopy. 1993;169:375–382. doi: 10.1111/j.1365-2818.1993.tb03313.x. [DOI] [PubMed] [Google Scholar]
- 25.Hu G, Vogel SM, Schwartz DE, Malik AB, Minshall RD. Intercellular Adhesion Molecule-1–Dependent Neutrophil Adhesion to Endothelial Cells Induces Caveolae-Mediated Pulmonary Vascular Hyperpermeability. Circulation Research. 2008;102:e120–e131. doi: 10.1161/CIRCRESAHA.107.167486. [DOI] [PMC free article] [PubMed] [Google Scholar]
- 26.Sun Y, Hu G, Zhang X, Minshall RD. Phosphorylation of Caveolin-1 Regulates Oxidant–Induced Pulmonary Vascular Permeability via Paracellular and Transcellular Pathways. Circulation Research. 2009;105:676–685. doi: 10.1161/CIRCRESAHA.109.201673. [DOI] [PMC free article] [PubMed] [Google Scholar]
- 27.Wei E, Hamm R, Baranova A, Povlishock J. The long-term microvascular and behavioral consequences of experimental traumatic brain injury after hypothermic intervention. Journal of Neurotrauma. 2009;26:527–537. doi: 10.1089/neu.2008.0797. [DOI] [PMC free article] [PubMed] [Google Scholar]
- 28.Parton RG, Joggerst B, Simons K. Regulated internalization of caveolae. The Journal of Cell Biology. 1994;127:1199–1215. doi: 10.1083/jcb.127.5.1199. [DOI] [PMC free article] [PubMed] [Google Scholar]
- 29.Minshall RD, Tiruppathi C, Vogel SM, Niles WD, Gilchrist A, Hamm HE, Malik AB. Endothelial cell-surface gp60 activates vesicle formation and trafficking via G(i)-coupled Src kinase signaling pathway. The Journal of Cell Biology. 2000;150:1057–1070. doi: 10.1083/jcb.150.5.1057. [DOI] [PMC free article] [PubMed] [Google Scholar]
- 30.Shajahan AN, Timblin BK, Sandoval R, Tiruppathi C, Malik AB, Minshall RD. Role of Src-induced dynamin-2 phosphorylation in caveolae-mediated endocytosis in endothelial cells. J Biol Chem. 2004;279:20392–20400. doi: 10.1074/jbc.M308710200. [DOI] [PubMed] [Google Scholar]
- 31.Chang CF, Chen SF, Lee TS, Lee HF, Chen SF, Shyue SK. Caveolin-1 deletion reduces early brain injury after experimental intracerebral hemorrhage. The American Journal of Pathology. 2011;178:1749–1761. doi: 10.1016/j.ajpath.2010.12.023. [DOI] [PMC free article] [PubMed] [Google Scholar]
- 32.Williams TM, Medina F, Badano I, Hazan RB, Hutchinson J, Muller WJ, Chopra NG, Scherer PE, Pestell RG, Lisanti MP. Caveolin-1 gene disruption promotes mammary tumorigenesis and dramatically enhances lung metastasis in vivo: Role of Cav-1 in cell invasivness and matrix metalloproteinase (MMP-2/9) secretion. Journal of Biological Chemistry. 2004;279:51630–51646. doi: 10.1074/jbc.M409214200. [DOI] [PubMed] [Google Scholar]
- 33.Miyawaki-Shimizu K, Predescu D, Shimizu J, Broman M, Predescu S, Malik AB. siRNA-induced caveolin-1 knockdown in mice increases lung vascular permeability via the junctional pathway. American Journal of Physiology - Lung Cellular and Molecular Physiology. 2006;290:L405–L413. doi: 10.1152/ajplung.00292.2005. [DOI] [PubMed] [Google Scholar]
- 34.Muradashvili N, Tyagi R, Lominadze D. A dual-tracer method for differentiating transendothelial transport from paracellular leakage in vivo and in vitro. Frontiers in Physiology. 2012;3:166–172. doi: 10.3389/fphys.2012.00166. [DOI] [PMC free article] [PubMed] [Google Scholar]
- 35.Cameron PL, Ruffin JW, Bollag R, Rasmussen H, Cameron RS. Identification of caveolin and caveolin-related proteins in the brain. The Journal of Neuroscience. 1997;17:9520–9535. doi: 10.1523/JNEUROSCI.17-24-09520.1997. [DOI] [PMC free article] [PubMed] [Google Scholar]
- 36.Hill MM, Scherbakov N, Schiefermeier N, Baran J, Hancock JF, Huber LA, Parton RG, Parat MO. Reassessing the role of phosphocaveolin-1 in cell adhesion and migration. Traffic. 2007;8:1695–1705. doi: 10.1111/j.1600-0854.2007.00653.x. [DOI] [PubMed] [Google Scholar]