Abstract
Purpose
We report enhanced signal detection for measuring N-acetyl-aspartyl-glutamate (NAAG) in the human brain at 7T by TE-optimized point-resolved spectroscopy (PRESS) and improved Wiener filtering.
Methods
Using a highly efficient in-house developed numerical simulation program, a PRESS sequence with (TE1, TE2) = (26, 72) ms was found to maximize the NAAG signals relative to the overlapping Glu signals. A new Wiener filtering water reference deconvolution method was developed to reduce broadening and distortions of metabolite peaks caused by B0 inhomogeneity and eddy currents.
Results
Monte Carlo simulation results demonstrated that the new Wiener filtering method offered higher spectral resolution, reduced spectral artifacts, and higher accuracy in NAAG quantification compared to the original Wiener filtering method. In vivo spectra and point spread functions of signal distortion confirmed that the new Wiener filtering method lead to improved spectral resolution and reduced spectral artifacts.
Conclusions
TE-optimized PRESS in combination with a new Wiener filtering method made it possible to fully utilize both the NAAG singlet signal at 2.05 ppm and the NAAG multiplet signal at 2.18 ppm in the quantification of NAAG. A more accurate characterization of lineshape distortion for Wiener filtering needs B0 field maps and segmented anatomical images to exclude contribution from cerebral spinal fluid.
Keywords: NAAG, GAMMA simulation, Wiener filter, TE optimization
INTRODUCTION
N-acetyl-aspartyl-glutamate (NAAG) is a neurotransmitter in the human brain that consists of N-acetyl-aspartate (NAA) and glutamate (Glu) coupled via a peptide bond. Its functions include modulating synaptic release of Glu and regulating γ-aminobutyric acid (GABA) receptor expression. NAAG is implicated in the pathophysiology of several neurological diseases such as amyotrophic lateral sclerosis (1), schizophrenia (2), ischemia (3), chronic pain (4), and traumatic brain injury (5).
Accurate quantification of NAAG in the human brain by 1H magnetic resonance spectroscopy (MRS) is difficult due to strong overlapping signals from NAA, Glu, and macromolecules. Several methods have been used with variable results. For example, NAAG detection by spectral fitting of short echo-time (TE) spectra (6–8) seeks to minimize T2 decay but suffers from strong overlapping signals which compromises accuracy. With this approach, the NAAG multiplet of the glutamate moiety at 2.18 ppm is indistinguishable, the NAAG acetyl singlet peak at 2.05 ppm is dominated by the NAA acetyl singlet peak at 2.01 ppm, and there are strong macromolecule signals at the NAAG resonances. Another approach to NAAG detection utilizes difference editing to measure the NAAG aspartyl multiplet at 2.6 ppm (9,10). While the overlapping signals are eliminated by difference editing, the peak amplitude of the NAAG multiplet at 2.6 ppm is much lower than both the multiplet at 2.18 ppm and the singlet at 2.05 ppm. A recently reported method for NAAG detection uses TE-averaged PRESS at 3T with line shape deconvolution (11). TE-averaging simplifies the spectrum around the NAA and NAAG singlets by canceling nearby multiplet signals but pays the price of complicated data acquisition, phase corrections, and metabolite quantification. Additionally, Tikhonov regularization is used for line shape deconvolution to restrain noise amplification, however, the optimization of the regularization parameter using the L-curve method is nontrivial and not fully automatic. For all existing NAAG detection methods, the NAAG multiplet at 2.18 ppm from the glutamate moiety has not been effectively used for quantification.
In this study, we optimize the TE1 and TE2 values of a PRESS sequence to maximize the total signal of the NAAG singlet at 2.05 ppm and multiple at 2.18 ppm relative to the overlapping Glu signals. In addition, a new Wiener filtering lineshape deconvolution method is developed to enhance spectral resolution.
METHODS
TE Optimization
Numerical simulations programmed using the GAMMA C++ library (12) were conducted to optimize TE1 and TE2 of a PRESS sequence for the detection of NAAG at 7T. The simulations used published chemical shift and J-coupling constants (13). Experimental RF waveforms were used with 3D spatial localization. The excitation pulse was an amplitude-modulated pulse with a 3.1 kHz FWHH (full width at half height) bandwidth. The two refocusing pulses were also amplitude-modulated and had a bandwidth of 2.0 kHz. The effects of localization gradients were simulated as frequency shifts of the spin systems (14). Instead of directly computing the evolution of the density operators for 3-dimensional (3D) spatial points within the voxel, the propagator operators of six time periods were computed first, which consisted of the excitation pulse and its refocusing gradient, a free evolution period, the first refocusing pulse and its two crusher gradients, another free evolution period, the second refocusing pulse and its two crusher gradients, and the final free evolution period before data acquisition. To avoid coupling of different spatial dimensions when computing the propagator operators, the pair of crusher gradients for each refocusing pulse were placed in the direction of the localization gradient. For each free evolution period, only one propagator operator was computed since all spatial points were identical. For each of the three time periods involving a RF pulse and gradients, propagator operators were computed for every plane along the gradient direction and stored in a one-dimensional (1D) data array. These propagator operators for the six time periods were sequentially multiplied together to get the final propagator operator for each spatial point in 3D. Evolving the equilibrium density operator with the final propagator operators yields the density operators for all spatial points in 3D, of which the sum is the final density operator for the whole voxel. Pseudo code of this simulation program is provided online as supplemental material.
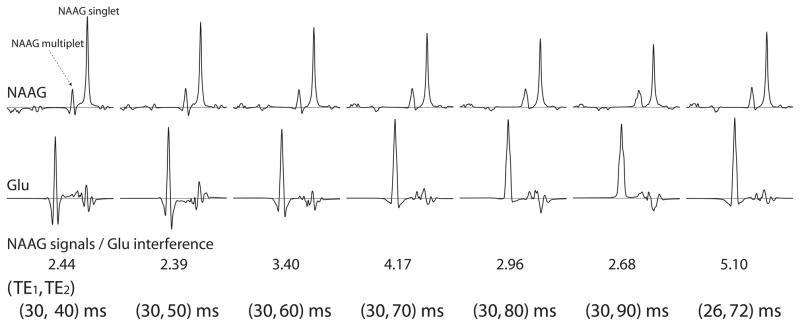
The NAAG and Glu spectra were calculated for TE1 and TE2 values in the range of 20 – 100 ms with 10 ms increment (15). The objective of this TE optimization was to maximize the ratio of the integral of NAAG signals between 2.0 – 2.25 ppm to the integral of absolute values of Glu signals in the same range. The integral of NAAG signals between 2.0 – 2.25 ppm gives the total area of the NAAG singlet at 2.05 ppm and multiplet at 2.18 pm. The integral of absolute values of Glu signals between 2.0 – 2.25 ppm is a good measure of Glu signal interference to the detection of NAAG signals. The ratio of the two integrals was found to be near maximum at (TE1, TE2) = (30, 70) ms. Further calculations in the vicinity found (TE1, TE2) = (26, 72) ms maximized the ratio.
Water Reference Deconvolution
The separation between the singlets of NAA and NAAG is approximately 0.037 ppm (13), which is 11 Hz at 7T. The line broadening and line shape distortion caused by B0 inhomogeneity and eddy currents merge the two singlet peaks into one peak for most in vivo MRS experiments. The accuracy of NAAG quantification would improve if the two peaks could be separated to some degree by a lineshape correction method such as QUALITY (Quantification Improvement by Converting Lineshapes to the Lorentzian Type) (16). In QUALITY, the water-suppressed metabolite free induction decay (FID) signal is divided by the water reference signal, i.e. FID without water suppression, to remove lineshape distortions. Because the T2* of water is shorter than those of the metabolites, the water reference signal drops faster than the metabolite signals, especially at high magnetic field strength such as 7T. Dividing by the near-zero water reference signal at later points in time would amplify noise and errors in the deconvolved FID. This zero-division problem can be solved by incorporating Tikhonov regularization (11) or the original Wiener filtering (17) into QUALITY (18,19). However, Wiener filtering also introduces artifacts to the deconvolved signal. We developed a new Wiener filtering water reference deconvolution method to minimize spectral artifacts. A point spread function (PSF) of signal distortion caused by the filtering was also computed to compare the original and our new Wiener filtering method.
For both the original and new Wiener filtering method, the FID signal after Wiener filtering, FIDc(t), is given by (17):
| [1] |
where FID(t) is the FID before Wiener filtering; W(t) is the water reference signal divided by the T2 decay function of water; W(t)* is the complex conjugate of W(t); σ2 is the noise variance in FID(t); S(t) is the mean power spectral density of the ideal undistorted FID, which needs to be estimated. A derivation of Eq. [1] is given in the appendix. FIDc(t) is often apodized by a Lorentzian or Gaussian function to remove ringing artifacts in the frequency domain and to improve signal-to-noise ratio (SNR). We chose a Gaussian function for apodization to retain narrow metabolite peaks. After incorporating the Gaussian apodization into Eq. [1], we have the following equation for Wiener filtering:
| [2] |
where the Gaussian apodization term is obtained by Fourier transforming a frequency domain Gaussian function exp[−ln2(2v/WG)2] which has a FWHH linewidth of WG Hz into time domain (20). Using the original Wiener filtering method (18,19), S(t) is approximated by:
| [3] |
which may lead to artifacts in the final reconstructed spectrum because FID(t) suffers from line broadening and lineshape distortions. We propose to use the squared magnitude of the ideal T2 decay function as S(t), which is expressed as:
| [4] |
where AreaNAA is the area of the NAA peak in the spectrum reconstructed from the uncorrected signal FID(t); T2NAA is the estimated T2 value of NAA. The term 2AreaNAA gives the signal amplitude of the first point of the ideal NAA T2 decay function. The factor 2 is used to compensate for the 50% spectral signal loss when Fourier transforming the FID, which constitutes only half of the whole time-domain spin-echo signal, into frequency domain and taking the real part of the transformed signal as the spectrum (21). For computing the signal distortion caused by Wiener filtering, Eq. [2] is rewritten into:
| [5] |
According to QUALITY, FID(t)/W(t) recovers the ideal undistorted FID if W(t) is free of noise and error. The rest of the factors in Eq. [5] constitute the time domain signal distortion function of the Wiener filter. Fourier transforming the signal distortion function into frequency domain yields the PSF for the Wiener filtering signal distortion:
| [6] |
Multiplying the signal distortion function to the FID in time domain is equivalent to convolving the PSF with the spectrum in frequency domain. The shape of the PSF can reveal the amount of artifact produced by Wiener filtering in the reconstructed spectrum. To quantify the amount of artifact in a PSF, a new parameter, leakage ratio, is defined as:
| [7] |
where ppm_range is the ppm range that contains the main peak of the PSF such as ±0.04 ppm in our experiments.
Monte Carlo simulations were performed to compare the performances of the original and new Wiener filtering methods. The density matrix simulated FIDs of NAA, NAAG, Glu, creatine (Cr), and choline (Cho) were multiplied by trial concentration values and T2 decay functions to generate the ideal FID. The trial concentration values for NAA, NAAG, Glu, Cr, and Cho were 13, 2.6, 10, 10, and 3, respectively. Meanwhile, the trial T2 values for the metabolites were set to 130 ms, 130 ms, 90 ms, 90 ms, and 150 ms, respectively (22). In order to simulate the effect of B0 inhomogeneity on the FID, the voxel was divided into 20 × 20 × 20 spatial points and the off-resonance phase factor due to 3D linear and quadratic B0 inhomogeneity was computed for each spatial point. The ideal FID was multiplied by the sum of the off-resonance phase factors (16) and added with random noise to simulate a realistic metabolite FID. The water reference signal was also generated with the same B0 inhomogeneity. The simulated FID was processed in three different ways, i.e. no lineshape correction, lineshape correction using the original Wiener filtering method according to Eqs. [2] and [3], and lineshape correction using the new Wiener filtering method according to Eqs. [2] and [4]. The filtered FIDs were Fourier transformed into the frequency domain to give the reconstructed spectra. Using an in-house developed fitting software, these spectra were fitted by a linear combination of the basis functions of NAA, NAAG, Glu, Cr, and Cho to quantify the metabolite concentrations. This whole process was repeated 100 times with the same spatial B0 inhomogeneity and the same level but different realizations of random noise. PSFs were also computed based on Eq. [6] to evaluate the amount of spectral artifact created by Wiener filtering.
In Vivo Experiments
Seven healthy volunteers (one woman and six men; aged 20 – 39 years), who gave informed consent in accordance with procedures approved by our local institutional review board, were scanned on a Siemens 7T scanner equipped with a 32-channel receiver head coil. A 3D T1-weighted MPRAGE (magnetization prepared rapid gradient echo) image acquired with TR = 3 s, TE = 3.9 ms, matrix = 256 × 256 × 256, resolution = 1 mm × 1 mm × 1 mm was used to localize the MRS voxel and perform tissue segmentation of the voxel using an in-house developed software. This software could overlay the MRS voxel onto the T1-weighted image and display a histogram of pixel intensity values inside the MRS voxel. Based on the histogram, a user could enter two threshold values into the software to partition the MRS voxel into three regions, i.e. cerebral spinal fluid (CSF), grey matter (GM), and white matter (WM) regions. A map of these three regions was then overlaid onto the T1-weighted image by the software to allow the user to visually determine if the three regions match the corresponding areas in the image and adjust the threshold values until the match is satisfactory. Segmentation results may vary slightly depending on the experience of the user in distinguishing tissue types based on T1-weighted images. For each subject, MRS data were collected from a 2 × 2 × 2 cm3 voxel in the white matter (WM) dominant right frontal lobe. Before running the PRESS sequence, first- and second-order B0 shim coefficients were adjusted using a FASTMAP sequence (23). The PRESS sequence used TR = 2.5 s, TE1 = 26 ms, TE2 = 72 ms, spectral width = 4000 Hz, number of data points = 2048, and number of transients = 128. Water suppression was accomplished using eight RF pulses of ~350 Hz bandwidth. In addition, eight interleaved unsuppressed water acquisitions were performed, one after every 15 water-suppressed transients.
The first step of post-processing is to perform frequency- and phase-correction on each of the 128 transients to align the data before averaging. One channel that had the strongest signal was selected out of the 32 channels. For the selected channel, each transient was fitted to the average of the first eight transients to determine the frequency- and phase-correction values for the transient by minimizing the sum of squared differences in the frequency domain between 1.6 – 3.5 ppm. These frequency- and phase-correction values were applied to all 32 channels, and subsequently, the averaged FID for each channel was computed. These 32-channel metabolite FID averages were merged into a single-channel combined metabolite FID by a generalized least square method (24). A combined water reference FID was similarly computed from the eight water-unsuppressed FIDs. For computing the SNR of the NAA peak, an unfiltered spectrum was computed by Fourier transforming the combined metabolite FID into frequency domain without any line broadening or filtering. The SNR was computed as the ratio of the NAA peak amplitude to the standard deviation (SD) of the noise measured between 9 – 12 ppm.
The combined metabolite FID was processed in three different ways, i.e. no lineshape correction, lineshape correction by the original Wiener filtering method using Eqs. [2] and [3], and lineshape correction by the new Wiener filtering method using Eqs. [2] and [4]. For the Wiener filtering methods, the combined water-unsuppressed FID was divided by the water T2 decay function to give W(t), where a published water T2 value of 47 ms was used (22). When computing S(t) for the new Wiener filtering method using Eq. [4], a published NAA T2 value of 130 ms was used (22). The same amount of Gaussian line broadening was used for the two Wiener filtering methods, which ranges from 5 to 7 Hz over different subjects. A 3 Hz Gaussian line broadening was applied to the spectra with no lineshape correction. The filtered FIDs were Fourier transformed into the frequency domain to give the reconstructed spectra. To quantify the concentration of the metabolites, the spectral data were fitted by basis functions of NAA, NAAG, GABA, Glu, glutamine (Gln), glutathione (GSH), aspartate (ASP), creatine + phosphocreatine (tCr), glycerophosphocholine + phosphocholine (tCho), and myo-inositol (mI) using the in-house developed linear combination fitting program. Cramer-Rao lower bounds (CRLB) for the quantifications were also computed (25). A Levenberg-Marquardt least square minimization algorithm was used in spectral fitting. The basis functions of the metabolites were scaled, apodized using a Voigt lineshape, frequency shifted, zero-order phase corrected, Fourier transformed to the frequency domain, and added with a spline baseline with 8 control points to fit the spectral data between 1.8 – 3.3 ppm. Each metabolite could have different linewidth but was constrained to have the same Lorentzian/Gaussian ratio. The frequency of each metabolite was constrained to vary within ±6 Hz from its theoretical value. The zero-order phase of the spectral data was allowed to vary without any constraint. The first-order phase of the spectral data was fixed to zero because the timing of the data acquisition window in the PRESS sequence had been carefully adjusted through phantom experiments to eliminate first-order phase in the acquired spectra.
RESULTS
TE Optimization
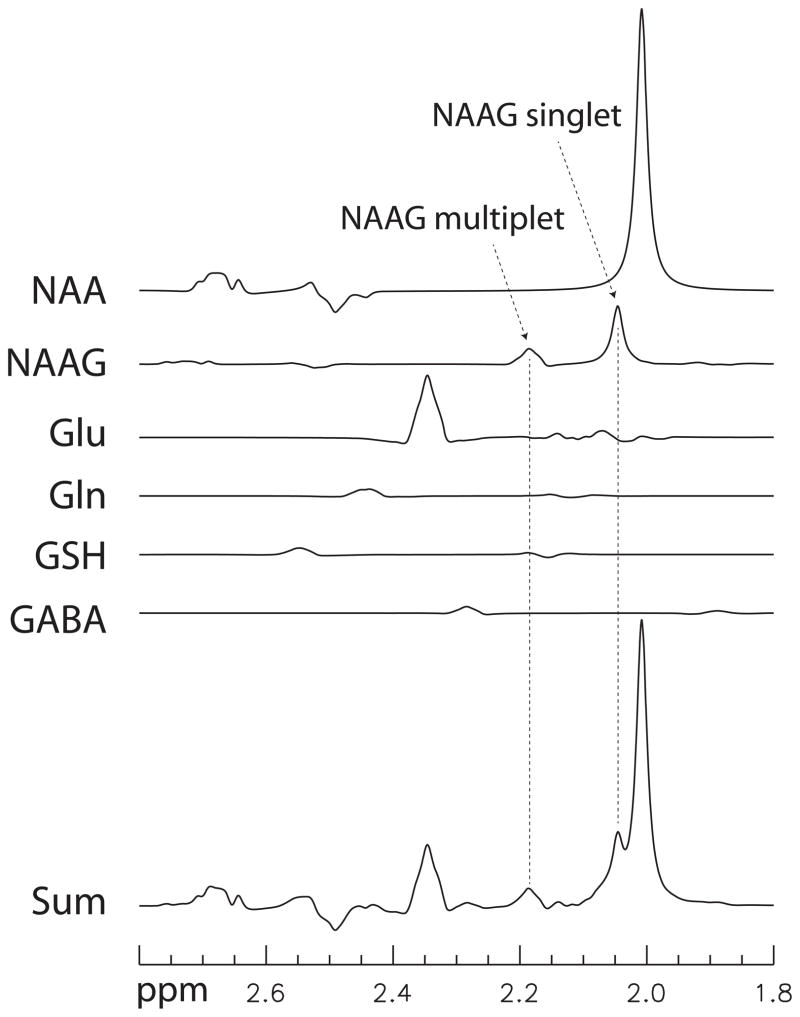
Seven selected numerically calculated spectra of NAAG and Glu are plotted in Fig. 1. As listed in the figure, the ratio of the integral of NAAG signals between 2.0 – 2.25 ppm to the integral of absolute values of Glu signals in the same range had a maximum value of 5.10 at (TE1, TE2) = (26, 72) ms. Numerically calculated spectra of NAA, NAAG, Glu, Gln, GSH, and GABA at (TE1, TE2) = (26, 72) ms are plotted in Fig. 2. Concentration ratios of NAA, NAAG, Glu, Gln, GSH, and GABA used in the simulation were 13:2.6:10:2:1.5:1.
Fig. 1.
Density matrix simulated spectra of NAAG and Glu at 7T for different TE1 and TE2 values. The spectral range is 1.8 – 2.8 ppm from right to left. All spectra were broadened to singlet width of 6 Hz. The spectra were scaled by the T2 decay factor exp[−(TE1+TE2)/T2] with T2 = 130 ms.
Fig. 2.
Density matrix simulated spectra of NAA, NAAG, Glu, Gln, GSH, and GABA for (TE1, TE2) = (26, 72) with a concentration ratio of 13:2.6:10:2:1.5:1, respectively. All spectra were broadened to singlet width of 6 Hz. The spectra were scaled by the T2 decay factor exp[−(TE1+TE2)/T2] with T2 = 130 ms for all metabolites.
Monte Carlo Simulations
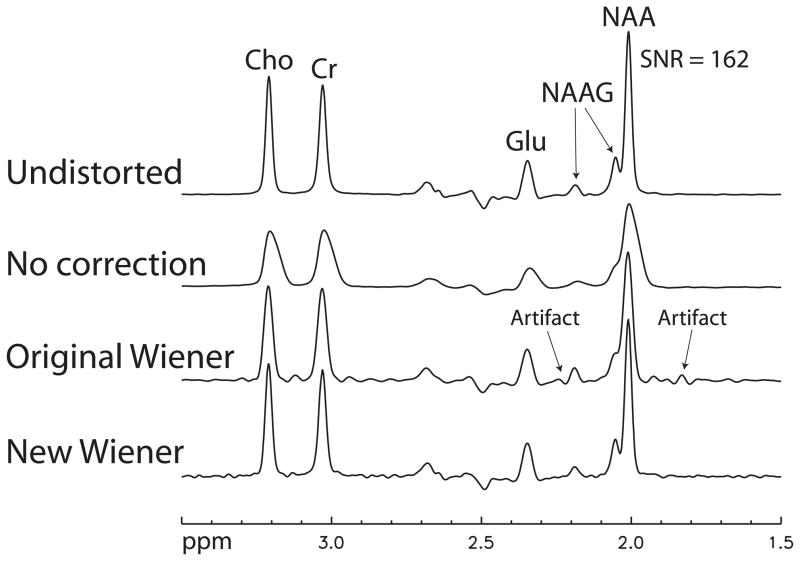
Four reconstructed spectra of the simulation experiments are displayed in Fig. 3. The top spectrum in the figure was reconstructed from a noise-added but distortion free FID. No lineshape distortions are present in this spectrum. The second spectrum from the top was reconstructed from a FID distorted by B0 inhomogeneity without using a lineshape correction method. The metabolite peaks in this spectrum are severely distorted and broadened. The third spectrum from the top was reconstructed from the same distorted FID but was lineshape corrected using the original Wiener filtering method that uses |FID(t)|2 to approximate the ideal signal. In the third spectrum, we see that the metabolite peaks are narrower and have better shapes than those in the second spectrum, however, the NAA and NAAG singlet peaks overlap, and the NAAG multiplet peak at 2.18 ppm is significantly distorted by artifact compared to that of the undistorted spectrum on the top. The bottom spectrum was reconstructed from the same distorted FID and was corrected by the new Wiener filtering method. The spectrum has significant improvements over that of the original Wiener filtering method as the NAA and NAAG singlet peaks are partially separated and the NAAG peak at 2.18 ppm has no visible distortion.
Fig. 3.
Stack plots of simulated spectra reconstructed from a noise-added but distortion-free FID, a distorted FID without any lineshape correction, the same distorted FID corrected by the original Wiener filtering method, and the same distorted FID corrected by the new Wiener filtering method. All four spectra were apodized with Gaussian line broadening of 6 Hz.
Quantification results from spectra without lineshape correction, lineshape corrected using the original Wiener filtering method, and lineshape corrected using the new Wiener filtering method are given in Table 1. To test T2NAA error tolerance for the new Wiener filtering method, T2NAA values of 100 ms and 160 ms, along with the correct value of 130 ms, were used to compute S(t). The results given in Table 1 show that the new Wiener filtering method offers significantly lower error in NAAG quantification and is not sensitive to the estimated T2NAA value.
Table 1.
Quantification results from the simulated data and test of sensitivity to T2NAA.
| NAA | NAAG | Glu | ||||
|---|---|---|---|---|---|---|
| Mean±SD | Error(%) | Mean±SD | Error(%) | Mean±SD | Error(%) | |
| True concentration | 13.0 | 2.6 | 10.0 | |||
| No lineshape correction | 14.45±0.07 | 11 | 1.23±0.04 | 53 | 9.9±0.1 | 1.0 |
| Original Wiener method | 12.91±0.06 | 0.69 | 2.38±0.05 | 8.5 | 9.5±0.1 | 5.2 |
| New Wiener (T2NAA=130 ms) | 13.02±0.05 | 0.15 | 2.64±0.04 | 1.5 | 9.7±0.1 | 2.9 |
| New Wiener (T2NAA=100 ms) | 12.98±0.06 | 0.15 | 2.63±0.03 | 1.3 | 9.7±0.2 | 3.3 |
| New Wiener (T2NAA=160 ms) | 13.06±0.05 | 0.46 | 2.63±0.04 | 1.2 | 9.7±0.2 | 2.5 |
T2NAA: T2 value of NAA used in the reconstruction.
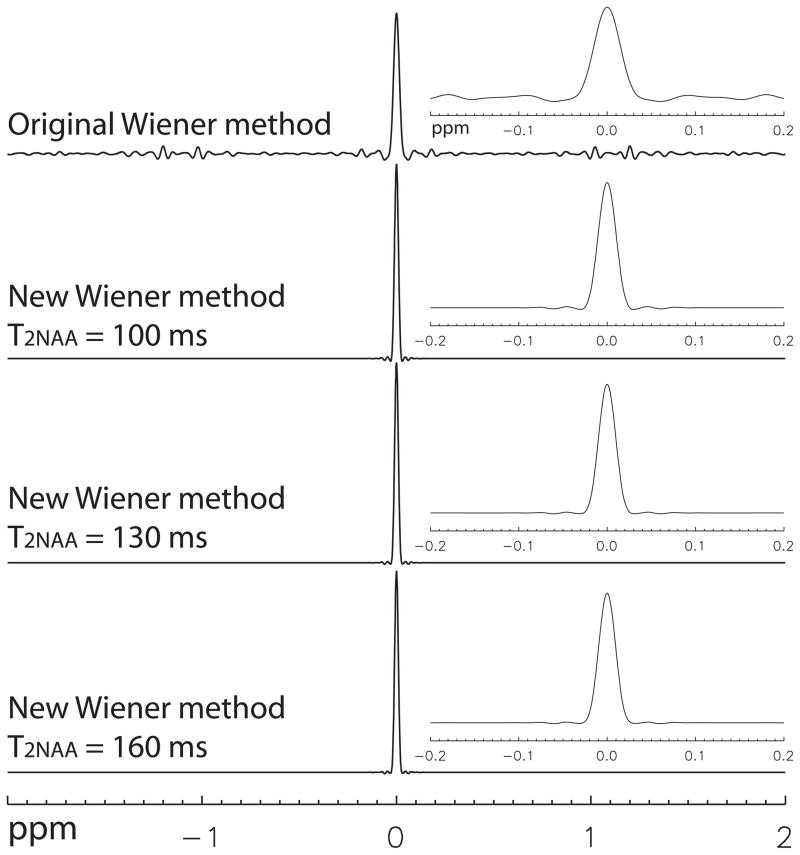
Signal distortion PSFs for the original and new Wiener filtering methods are plotted in Fig. 4. For the original Wiener filtering method, the PSF main peak has a linewith of 9.8 Hz. There are some ripples and small spikes on both sides of the main peak. In the range of ±0.04 ppm, the leakage ratio is 1.79. Convolving this PSF with a spectrum will cause some ripples and small spikes in the final spectrum, which explains the source of artifact in the spectrum of the original Wiener filtering method (Fig. 3). The three PSFs for the new Wiener filtering method using three different T2NAA values have almost no artifact outside the range of ±0.04 ppm. The leakage ratios for the new Wiener filtering method with T2NAA = 100, 130, and 160 ms are 0.026, 0.023, and 0.019, respectively. The main peaks have a linewidth of about 6.5 Hz. Convolving one of these PSFs with a spectrum will increase the linewidth of the metabolite peaks by less than 6.5 Hz and cause only negligible errors in metabolite quantification.
Fig. 4.
Signal distortion PSFs computed from the simulated data using the original and new Wiener filtering methods. An exploded view of each PSF is insert on the right of the corresponding PSF. Three different values of T2NAA were used by the new Wiener filtering method to test the error tolerance in the estimated value of T2NAA.
In Vivo Experiments
Tissue segmentation based on the 3D MPRAGE image found that the MRS voxel in the right frontal lobe of seven healthy volunteers contained (85±6)% WM, (14±6)% GM, and (1±1)% CSF. The mean SNR of the NAA peak was 242 and the mean water linewidth was 11.2 Hz.
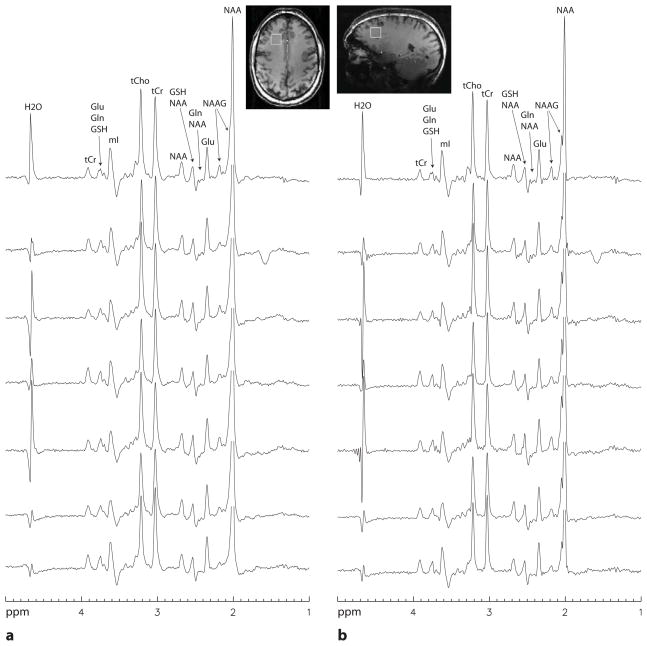
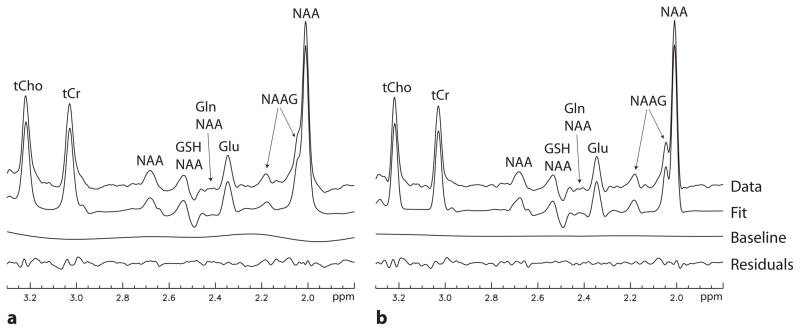
Spectra for the seven volunteers reconstructed without lineshape correction and with lineshape correction using the new Wiener filtering method are displayed in Fig. 5. Linear combination fitting plots for one healthy volunteer, whose spectra are displayed on the third row from the top in Fig. 5, are displayed in Fig. 6. For the spectra reconstructed without lineshape correction (Fig. 5a), the NAA and NAAG singlet peaks are merged together and the fitting residual for the NAAG multiplet peak at 2.18 ppm is relatively large (Fig. 6a) due to line broadening and lineshape distortions caused by B0 inhomogeneity and eddy currents. For the spectra with lineshape correction using the new Wiener filtering method (Fig. 5b), a partial split between the NAA and NAAG singlets is visible in each spectrum; the NAAG multiplet peak at 2.18 ppm is well defined in each spectrum; and the fitting residual for the NAAG multiplet peak at 2.18 ppm is very small (Fig. 6b).
Fig. 5.
Stack plots of spectra from the right frontal lobe of seven healthy volunteers acquired with TR = 2.5 s, TE1 = 26 ms, TE2 = 72 ms, voxel size = 2×2×2 cm3, spectral width = 4000 Hz, number of data points = 2048, and number of averages = 128. The metabolite peaks over 3.7 ppm were partially suppressed by the water suppression pulses that had a bandwidth of ~350 Hz. a: Spectra that had no lineshape correction. Gaussian line broadening of 3 Hz was used. b: Spectra that were lineshape corrected using the new Wiener filtering method. Gaussian line broadening of 5 – 7 Hz was used. The NAA peaks are truncated except the two on the top row.
Fig. 6.
Linear combination fitting plots for one healthy volunteer, whose spectra are displayed on the third row from the top in Fig. 5. Spectral data between 1.8 – 3.3 ppm were used in the fitting process to quantify metabolite concentrations. a: Fitting results for the spectrum that had no lineshape correction. b: Fitting results for the spectrum that was lineshape corrected using the new Wiener filtering method.
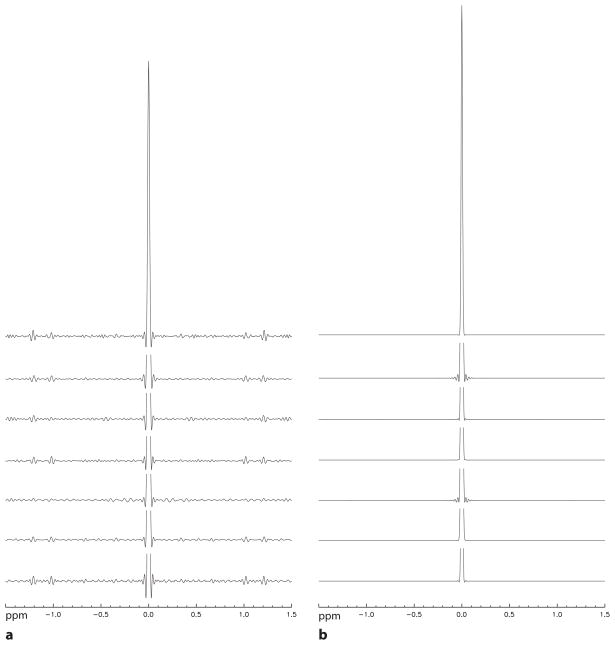
Spectra that were lineshape corrected using the original Wiener filtering method are similar to those of the new Wiener filtering method. In order to quantitatively compare the two Wiener filtering methods, the signal distortion PSFs for the two methods are plotted in Fig. 7. The central PSF peak for the new Wiener filtering method has a linewidth of 6.3 Hz which is smaller than the 7.3 Hz linewidth for the original Wiener filtering method. The PSF for the new Wiener filtering method also has less artifact than that of the original method. Using a range of ±0.04 ppm, the leakage ratios for the original and new Wiener filtering methods were found to be 0.9±0.2 and 0.02±0.02, respectively.
Fig. 7.
Stack plots of signal distortion PSFs for the seven healthy volunteers. a: PSFs for the original Wiener filtering method. b: PSFs for the new Wiener filtering method. Same amount of Gaussian line broadening was used in generating the PSFs for the two different methods, which ranges from 5 – 7 Hz for all subjects. The PSF main peaks are truncated except the two on the top row.
Table 2 gives the concentrations of NAA, NAAG, Glu, tCr, and tCho as ratios to NAA concentration, which were obtained by quantifying spectra without lineshape correction and with lineshape correction respectively using the new Wiener filtering method. The concentration values of Gln, GSH, GABA, ASP, and mI are not listed because they are prone to systematic modeling errors such as errors in modeling the baseline.
Table 2.
Metabolite ratios in the right frontal lobe of seven healthy volunteers, which were obtained by quantifying spectra without lineshape correction and with lineshape correction using the new Wiener filtering method, respectively.
| No lineshape correction | New Wiener method | |||
|---|---|---|---|---|
| Metabolite ratios (/[NAA]) | CRLB (%) | Metabolite ratios (/[NAA]) | CRLB (%) | |
| NAA | 1 | 0.48±0.01 | 1 | 0.49±0.02 |
| NAAG | 0.19±0.04 | 1.4±0.4 | 0.23±0.04 | 1.0±0.2 |
| Glu | 0.57±0.03 | 1.6±0.2 | 0.57±0.04 | 1.6±0.1 |
| tCr | 0.54±0.05 | 0.62±0.04 | 0.51±0.05 | 0.69±0.04 |
| tCho | 0.17±0.02 | 0.73±0.07 | 0.17±0.02 | 0.8±0.1 |
DISCUSSION
In density matrix simulations, computing the evolution of the density operator of one spatial point during a RF pulse takes several steps including calculating the spin system under the localization gradient, calculating the static Hamiltonian, and calculating the propagator operator or density operator at each step of the RF pulse. Repeating this computation over 3D spatial points is extremely time consuming. By separately computing the propagator operators of a few time periods first, the three spatial dimensions are decoupled and the computations only involve looping through 1D spatial positions. When computing the final density operator for the whole voxel by looping through all the 3D spatial points, only simple multiplications and additions of propagator and density operators are needed. This design made our simulation code many times faster than existing GAMMA simulation programs which directly compute the evolution of density operators over 3D spatial points. On a 2.6 GHz laptop computer, our simulation program took 60 minutes to compute a five-spin metabolite such as Glu using 3D localization with 201 × 201 × 201 spatial points. Because the spatial inhomogeneity of J-coupling is mainly caused by the limited bandwidth of the two refocusing pulses, an ideal excitation pulse without localization combined with experimental refocusing pulses with 2D localization can yield simulation results very similar to those with 3D localization. On the laptop computer, it took only one minute to compute a five-spin metabolite using an ideal excitation pulse and experimental refocusing pulses with 201 × 201 spatial points for 2D localization.
Wiener filtering is a widely used technique for removal of blurring and noise in photographic images due to unfocused optics and/or linear motion. It operates in the frequency domain by minimizing the effect of deconvolved noise at frequencies with low SNR. Wiener filtering produces a reconstructed image that is close to the true image in the least-mean-square sense. Wiener filtering is comparable to spatial-frequency domain regularization techniques except that regularization parameters are spatial-frequency dependent and automatically varied based on the SNR of the spatial-frequency domain signals. Two previous studies (18,19) have incorporated the original Wiener filtering to lineshape deconvolution in NMR spectroscopy with S(t), the mean power spectral density of the ideal undistorted FID, being approximated by the squared magnitude of the acquired FID. As shown by point spread function analysis (Figs 4 and 7), the original Wiener filtering method is suboptimal for MRS lineshape deconvolution as it creates significant spectral artifacts (Fig. 3). Due to the close proximity between NAA and NAAG resonances, spectral artifact generated by the original Wiener filtering method is problematic for the NAAG measurements. We proposed to use the squared magnitude of the ideal T2 decay function of NAA as S(t). This version of S(t) is distortion-free and follows the decay of the true ideal S(t). Reconstructed spectra, signal distortion PSFs, and quantification results for the simulated data show that our choice of S(t) leads to enhanced resolution, reduced spectral artifacts, and improved accuracy in NAAG quantification. PSFs and quantification results also show that the new Wiener filtering method is not sensitive to errors in the estimated value of T2NAA. Small errors in the estimated value of T2NAA have little influence on the lineshape of the PSF, do not meaningfully change the leakage ratio of the PSF, and have no significant effects on the quantification results. Similarly, quantification results are also not sensitive to the estimated value of water T2 although the corresponding simulation results are not presented in this article.
As pointed out by de Graaf et al. (16), spatial distributions of metabolites need to be similar to the spatial distribution of water in the MRS voxel in order for QUALITY to work properly. The new Wiener filtering method has the same limitations. Tissue segmentation of the MRS voxels in the right frontal lobe of seven healthy volunteers showed that the voxels contained (85±6)% WM, (14±6)% GM, and (1±1)% CSF. Because the amount of CSF in these voxels are negligible, the spatial distributions of tissue water and metabolites were close enough for Wiener filtering to work properly. For a voxel containing a significant amount of CSF, the spatial distribution of water signal is quite different from those of the metabolites because there are almost no metabolite signals in the CSF and the T1 and T2 values of CSF water are much longer than those of tissue water. Therefore, the unsuppressed water FID cannot be directly used in Wiener filtering. Instead, a synthetic tissue water FID can be generated based on B0 field maps and segmented anatomical images, which can be subsequently used by Wiener filtering.
The metabolite quantification for the in vivo experiments had very low CRLB values due to high SNR (SNR of the NAA peak = 242), narrow linewidth (water linewidth = 11.2 Hz), and good spectral resolution. Because of differences in fitting algorithms and constraints between our in-house fitting software and LCModel (26), our computed CRLB values may not be directly comparable to those produced by LCModel.
CONCLUSIONS
In this study, the total NAAG signal from the singlet and the multiplet at 2.18 ppm was maximized relative to the overlapping Glu signals by TE optimization of a PRESS sequence at 7T. Additionally, the NAAG singlet was partially separated from the NAA singlet by a new Wiener filtering water reference deconvolution method. TE optimization and Wiener filtering made it possible to fully use both the NAAG multiplet signal from the glutamate moiety and the NAAG singlet signal in the quantification of NAAG. Reconstructed spectra, point spread functions of signal distortion, and quantification results of simulated data demonstrated that the new Wiener filtering method offered higher spectral resolution, reduced spectral artifacts, and higher accuracy in NAAG quantification compared to the original Wiener filtering method. The in vivo spectra and corresponding PSFs of seven healthy volunteers confirmed that the proposed TE-optimized PRESS and the new Wiener filtering method lead to well defined NAAG multiplet peak at 2.18 ppm, resolved NAAG singlet peak, and reduced spectral artifacts. The NAAG/NAA ratio was found to be 0.23±0.04 in the right frontal lobe, which agrees well with published results (10).
Supplementary Material
Acknowledgments
We gratefully acknowledge Mr. Christopher Johnson and Mrs. Maria Ferraris Araneta for recruiting and caring for the healthy volunteers. This work was supported by the intramural programs of the NIH, NIMH, and NINDS.
APPENDIX
Since Wiener filtering is relatively unknown to the field of MRS, a derivation of Eq. [1] is provided here. Paraphrasing Ref. (17), the MRS signal is modeled in the time domain as:
| [A1] |
where FIDtrue(t) is the ideal undistorted FID. Here the time domain corresponds to the frequency domain in the conventional applications of Wiener filtering. As described in the main text, W(t) serves as the Fourier transform of the lineshape distortion. In the frequency domain, Eq. [A1] states that the true MRS peaks are convolved by a common distortion given by Fourier transform of W(t). Wiener filter minimizes the mean difference between FIDtrue(t) and FIDc(t) in the least square sense:
| [A2] |
where F(t) is the Wiener filtering function. Substituting Eq. [A1] into Eq. [A2] one obtains:
| [A3] |
where S(t) is the mean power spectral density given by:
| [A4] |
Assuming that noise(t) is a random function, the last term in Eq. [A3] becomes zero and we have:
| [A5] |
F(t) is extracted from Eq. [A5] by setting ddiff(t)/dF(t) to zero which corresponds to the minimum least square difference between FIDtrue(t) and FIDc(t):
| [A6] |
References
- 1.Tsai GC, Stauchslusher B, Sim L, et al. Reductions in Acidic Amino-Acids and N-Acetylaspartylglutamate in Amyotrophic-Lateral-Sclerosis Cns. Brain Research. 1991;556(1):151–156. doi: 10.1016/0006-8993(91)90560-i. [DOI] [PubMed] [Google Scholar]
- 2.Olszewski RT, Bukhari N, Zhou J, et al. NAAG peptidase inhibition reduces locomotor activity and some stereotypes in the PCP model of schizophrenia via group II mGluR. Journal of Neurochemistry. 2004;89(4):876–885. doi: 10.1111/j.1471-4159.2004.02358.x. [DOI] [PubMed] [Google Scholar]
- 3.Slusher BS, Vornov JJ, Thomas AG, et al. Selective inhibition of NAALADase, which converts NAAG to glutamate, reduces ischemic brain injury. Nat Med. 1999;5(12):1396–1402. doi: 10.1038/70971. [DOI] [PubMed] [Google Scholar]
- 4.Nagel J, Belozertseva I, Greco S, et al. Effects of NAAG peptidase inhibitor 2-PMPA in model chronic pain - relation to brain concentration. Neuropharmacology. 2006;51(7–8):1163–1171. doi: 10.1016/j.neuropharm.2006.07.018. [DOI] [PubMed] [Google Scholar]
- 5.Zhong C, Zhao X, Sarva J, Kozikowski A, Neale JH, Lyeth BG. NAAG peptidase inhibitor reduces acute neuronal degeneration and astrocyte damage following lateral fluid percussion TBI in rats. J Neurotrauma. 2005;22(2):266–276. doi: 10.1089/neu.2005.22.266. [DOI] [PubMed] [Google Scholar]
- 6.Pouwels PJW, Frahm J. Differential distribution of NAA and NAAG in human brain as determined by quantitative localized protein MRS. Nmr in Biomedicine. 1997;10(2):73–78. doi: 10.1002/(sici)1099-1492(199704)10:2<73::aid-nbm448>3.0.co;2-4. [DOI] [PubMed] [Google Scholar]
- 7.Rowland LM, Kontson K, Edden R, West JT, Holcomb HH, Barker PB. In Vivo Gaba, Glutamate, and Naag Measurements in Schizophrenia. Schizophrenia Bull. 2011;37:127–127. doi: 10.1093/schbul/sbs092. [DOI] [PMC free article] [PubMed] [Google Scholar]
- 8.Jessen F, Fingerhut N, Sprinkart AM, et al. N-Acetylaspartylglutamate (NAAG) and N-Acetylaspartate (NAA) in Patients With Schizophrenia. Schizophrenia Bull. 2013;39(1):197–205. doi: 10.1093/schbul/sbr127. [DOI] [PMC free article] [PubMed] [Google Scholar]
- 9.Edden RAE, Pomper MG, Barker PB. In vivo differentiation of N-acetyl aspartyl glutamate from N-acetyl aspartate at 3 Tesla. Magnetic Resonance in Medicine. 2007;57(6):977–982. doi: 10.1002/mrm.21234. [DOI] [PubMed] [Google Scholar]
- 10.Choi CH, Ghose S, Uh J, et al. Measurement of N-Acetylaspartylglutamate in the Human Frontal Brain by H-1-MRS at 7 T. Magnetic Resonance in Medicine. 2010;64(5):1247–1251. doi: 10.1002/mrm.22536. [DOI] [PMC free article] [PubMed] [Google Scholar]
- 11.Zhang Y, Li SZ, Marenco S, Shen J. Quantitative Measurement of N-Acetyl-aspartyl-glutamate at 3 T Using TE-Averaged PRESS Spectroscopy and Regularized Lineshape Deconvolution. Magnetic Resonance in Medicine. 2011;66(2):307–313. doi: 10.1002/mrm.23029. [DOI] [PMC free article] [PubMed] [Google Scholar]
- 12.Smith SA, Levante TO, Meier BH, Ernst RR. Computer-Simulations in Magnetic-Resonance - an Object-Oriented Programming Approach. Journal of Magnetic Resonance Series A. 1994;106(1):75–105. [Google Scholar]
- 13.Govindaraju V, Young K, Maudsley AA. Proton NMR chemical shifts and coupling constants for brain metabolites. Nmr in Biomedicine. 2000;13(3):129–153. doi: 10.1002/1099-1492(200005)13:3<129::aid-nbm619>3.0.co;2-v. [DOI] [PubMed] [Google Scholar]
- 14.Kaiser LG, Young K, Matson GB. Numerical simulations of localized high field H-1 MR spectroscopy. Journal of Magnetic Resonance. 2008;195(1):67–75. doi: 10.1016/j.jmr.2008.08.010. [DOI] [PMC free article] [PubMed] [Google Scholar]
- 15.Choi CH, Dimitrov IE, Douglas D, et al. Improvement of resolution for brain coupled metabolites by optimized (1)H MRS at 7 T. Nmr in Biomedicine. 2010;23(9):1044–1052. doi: 10.1002/nbm.1529. [DOI] [PubMed] [Google Scholar]
- 16.De Graaf AA, Vandijk JE, Bovee WMMJ. Quality - Quantification Improvement by Converting Lineshapes to the Lorentzian Type. Magnetic Resonance in Medicine. 1990;13(3):343–357. doi: 10.1002/mrm.1910130302. [DOI] [PubMed] [Google Scholar]
- 17.Wiener N. Extrapolation, Interpolation and Smoothing of Stationary Time Series with Engineering Applications. The MIT Press; Cambridge, MA: Wiley and Sons; New York: 1949. [Google Scholar]
- 18.Bhat H, Sajja BR, Narayana PA. Fast quantification of proton magnetic resonance spectroscopic imaging with artificial neural networks. Journal of Magnetic Resonance. 2006;183(1):110–122. doi: 10.1016/j.jmr.2006.08.004. [DOI] [PMC free article] [PubMed] [Google Scholar]
- 19.Dong ZC, Peterson BS. Spectral Resolution Amelioration by Deconvolution (SPREAD) in MR Spectroscopic Imaging. Journal of Magnetic Resonance Imaging. 2009;29(6):1395–1405. doi: 10.1002/jmri.21784. [DOI] [PMC free article] [PubMed] [Google Scholar]
- 20.Pearson GA. Optimization of Gaussian Resolution Enhancement. Journal of Magnetic Resonance. 1987;74(3):541–545. [Google Scholar]
- 21.Starcuk Z, Bartusek K, Starcuk Z. First-Data-Point Problem and the Base-Line Distortion in Fourier-Transform Nmr-Spectroscopy with Simultaneous Sampling. Journal of Magnetic Resonance Series A. 1994;108(2):177–188. [Google Scholar]
- 22.Marjanska M, Auerbach EJ, Valabregue R, Van de Moortele PF, Adriany G, Garwood M. Localized H-1 NMR spectroscopy in different regions of human brain in vivo at 7T: T-2 relaxation times and concentrations of cerebral metabolites. Nmr in Biomedicine. 2012;25(2):332–339. doi: 10.1002/nbm.1754. [DOI] [PMC free article] [PubMed] [Google Scholar]
- 23.Gruetter R, Boesch C. Fast, Noniterative Shimming of Spatially Localized Signals - Invivo Analysis of the Magnetic-Field Along Axes. Journal of Magnetic Resonance. 1992;96(2):323–334. [Google Scholar]
- 24.An L, van der Veen JW, Li SZ, Thomasson DM, Shen J. Combination of multichannel single-voxel MRS signals using generalized least squares. Journal of Magnetic Resonance Imaging. 2013;37(6):1445–1450. doi: 10.1002/jmri.23941. [DOI] [PMC free article] [PubMed] [Google Scholar]
- 25.Cavassila S, Deval S, Huegen C, van Ormondt D, Graveron-Demilly D. Cramer-Rao bound expressions for parametric estimation of overlapping peaks: Influence of prior knowledge. Journal of Magnetic Resonance. 2000;143(2):311–320. doi: 10.1006/jmre.1999.2002. [DOI] [PubMed] [Google Scholar]
- 26.Provencher SW. Automatic quantitation of localized in vivo H-1 spectra with LCModel. Nmr in Biomedicine. 2001;14(4):260–264. doi: 10.1002/nbm.698. [DOI] [PubMed] [Google Scholar]
Associated Data
This section collects any data citations, data availability statements, or supplementary materials included in this article.


