Abstract
Background
Host-plasmid interactions have been discussed largely in terms of the influences of plasmids, whereas the contributions of variations in host genomes to host interactions with foreign DNA remain unclear. A strain with a so-called “clean genome” (i.e., MDS42) of reduced genome size has recently been generated from the wild-type strain MG1655, a commonly used host strain. A quantitative evaluation of the influence of plasmid burdens in these two Escherichia coli strains can not only provide an understanding of how a reduced genome responds to foreign DNA but also offer insights into the proper application of these strains.
Results
The decreases in growth caused by the cost of carrying foreign DNA were similar for the wild-type and clean-genome strains. A negative correlation between the growth rate and the total amount of exogenous DNA was observed in both strains, but a better theoretical fit with a higher statistical significance was found for the strain with the clean genome. Compared to the wild-type strain, the clean-genome strain exhibited a reduced carrying capacity for exogenous DNA, which was largely attributed to its ability to restrict the replication of foreign DNA. A tendency to allocate energy and resources toward gene expression, but not DNA replication, was observed in the strain with the clean genome.
Conclusions
The possession of a clean genome constrained the plasmid copy number to a wild-type-equivalent load. The results indicate that the wild-type strain possesses a greater tolerance for foreign DNA, as in endosymbiosis, and that the use of strains with clean genomes will be favorable in the applications that require precise control and theoretical prediction.
Keywords: Reduced genome, Growth rate, Exogenous DNAs, Replication, Plasmid carrying capacity, Expression, Escherichia coli
Background
Host-plasmid interactions have been intensively studied in both bacterial and yeast cells, with the aim of developing a quantitative understanding of how exogenous DNA, i.e., plasmids, contribute to host growth [1-8]. Decreases in the growth rates of host cells that carry foreign DNA (e.g., plasmids) have mainly been attributed to the additional costs associated with the expression of plasmid genes [9,10]. Because the size of the prokaryotic genome is considered to be constrained by bioenergetics, (gene expression across an entire genome is assumed to consume approximately 75% of the total energy produced by bacterial cells [11]), whether changes in the size of a host genome can improve a host’s capacity for DNA replication is an intriguing question.
Furthermore, evaluations of the contributions of host genomes to host-plasmid interactions are also relevant to biotechnological applications. A strain with a clean genome of reduced size (i.e., MDS42) has recently been generated from the wild-type genome of strain MG1655 [12]. The MDS42 genome possesses significant advantages in terms of plasmid stability [13,14], protein production [15] and other applications in synthetic biology [16,17]. These advantages for biotechnological applications are largely attributed to genetic characteristics such as a low mutation rate and limited amount of recombination [13,14,17].
The latest genome-wide analyses have revealed that the reduced genome of MDS42 exhibits both a higher level of gene expression and a more fixed chromosomal periodicity [18] compared to its mother strain, MG1655 [19]. These novel properties of MDS42 largely result from the complete deletion of insertion sequences [12], which are considered to be nonessential for cellular life. Thus, MDS42 is believed to be an ideal host for plasmid production [20] because plasmids exhibit a greater degree of structural stability in MDS42 compared to MG1655 [12]. However, to date, the increase in the productivity of plasmids inserted into MDS42 has not been well studied [21].
In this study, we investigated whether a reduction in host genome size would benefit the replication of foreign DNA by comparing two closely related strains (i.e., MG1655 and MDS42) of different genome sizes. Estimating the burden of foreign DNA (i.e., plasmids) in both MG1655 and MDS42 allows us to determine how a reduction in genome size influences the carrying capacity for foreign DNA, and this information also provides further insight into the relationships among DNA replication, host growth and the cost distribution of cellular energetics. Any novel information concerning the nature of the host-plasmid interactions in strains with a clean genome (e.g., MDS42) can be taken into consideration when choosing strains for various applications.
Results and discussion
The growth cost of foreign DNA is similar for a wild-type or a clean genome
To evaluate the contribution of the host genome to the carrying capacity for foreign DNA, three plasmids of different sizes (S, M and L) were constructed, based on the sequences of pUC19 and pSC101 (Figure 1A). All three plasmids possessed a common replication site (ori), a pMB1-derived origin from pUC19, and primarily followed identical replication mechanisms, in a temperature-inducible manner [22]. These plasmids were subsequently transformed into two closely related host strains of different genome sizes, the wild type E. coli strain MG1655 and its derivate MDS42, which possesses a reduced genome (i.e., a so-called ‘clean genome’). Exponentially growing host cells bearing these plasmids were repeatedly analyzed at various temperatures (Additional file 1: Figure S1), to alter the plasmid copy numbers. Host cells that lacked plasmids were used as controls for data normalization at each temperature (Additional file 1: Figure S2).
Figure 1.
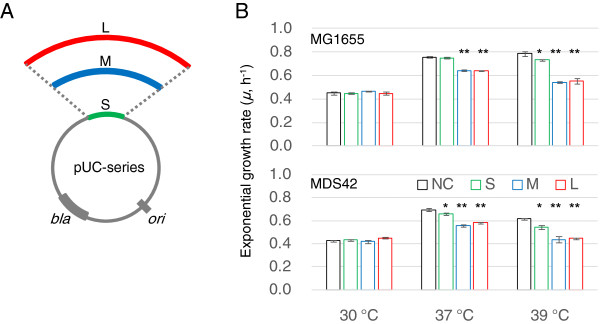
Contributions of plasmids to cell growth. A. Schematic drawing of the plasmids. All plasmids (pUC-S, pUC-M and pUC-L) were derived from pUC19. The lengths of S, M and L represent the plasmid sizes of 2,334, 6,426 and 9,573 bp, respectively. The site of initiation for replication and the ampicillin resistance gene are indicated as ori and bla, respectively. B. Cell growth rates. The exponential growth rates of E. coli strains MG1655 (upper panel) and MDS42 (lower panel) in a minimal medium are shown for different temperatures. The green, blue and red colors indicate the cells bearing the plasmids S, M and L, respectively. The strains that did not contain plasmids, which were used as controls (i.e., native growth fitness), are shown in black. The bars represent the standard errors of triplicates. Statistic significance is indicated (*, p < 0.05; **, p < 0.005).
Decreases in growth rate were detected in both host strains when they contained plasmids (Figure 1B, Additional file 1: Figure S2). A trend toward a decrease in host cell growth rate with an increase in plasmid size was observed. The decrease in growth rate caused by the presence of foreign DNA was more significant when the host cells were grown at normal and higher than normal temperatures but was insignificant at the lowest temperature. The results strongly suggest that the burden of foreign DNA was roughly equivalent for the two hosts, although the genome of MDS42 was shorter in length. The costs associated with the replication and/or expression of exogenous DNA were similar for the wild-type and the clean genomes. In addition, the results suggested not only the plasmid copy number (as previously reported [3,4]) but also the plasmid size (Figure 1B) played a role in host growth. The total DNA amount, comprising the information of both copy number and plasmid size, might be a proper parameter to evaluate the host-plasmid relations in common.
The decrease in growth rate is dependent on the total amount of exogenous DNA
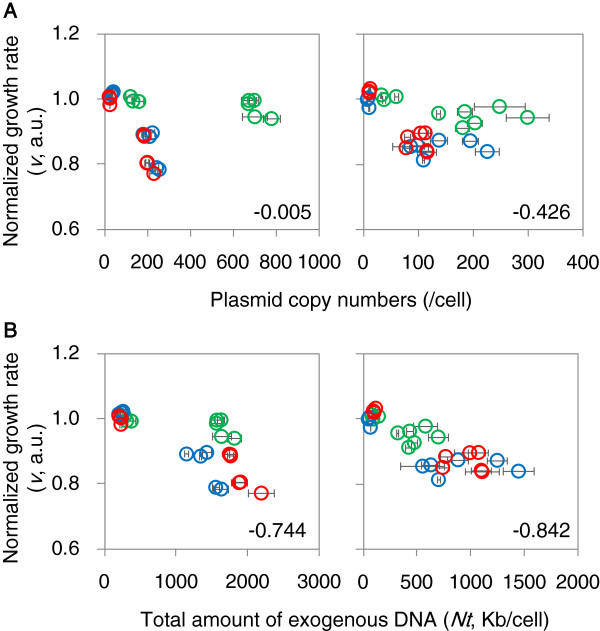
In exponentially growing cells, the growth rates of the host cells depended more on the total number of nucleotides contained within the plasmids than on the number of plasmid molecules. Individual analyses of each plasmid-host construct revealed a highly significant negative correlation between normalized growth rates and plasmid copy numbers (PCNs) (Additional file 1: Figure S3). Negative correlations were detected for all three plasmids and for both strains. This finding agrees well with the results of previous studies that examined the costs of plasmids to their hosts [9,10]. Intriguingly, even stronger correlations were found between host growth rates and the total length of exogenous DNA (Nt) when all three plasmid-host interactions were plotted together (Figure 2), indicating that the cost of plasmid replication for host growth is considerable under the experimental conditions examined. The negative correlation between growth and PCN found when combining the data for all three plasmids was significant for MDS42 but not for MG1655 (Figure 2A). The higher significance and greater strength of the negative correlation for Nt, compared to PCN, was a finding common to both genomes. Both the wild-type and the clean genomes appear to be similarly affected by the burden of foreign DNA.
Figure 2.
Relationship between cell growth and the amount of exogenous DNA. A. Relationship between cell growth and the plasmid copy number. B. Relationship between cell growth and the amount of exogenous DNA. The growth rate was normalized to a linear scale. The standard errors and correlation coefficients are given. The left and right panels show the results for strains MG1655 and MDS42, respectively. The color scheme is as described in Figure 1.
Enhanced predictability of the clean genome
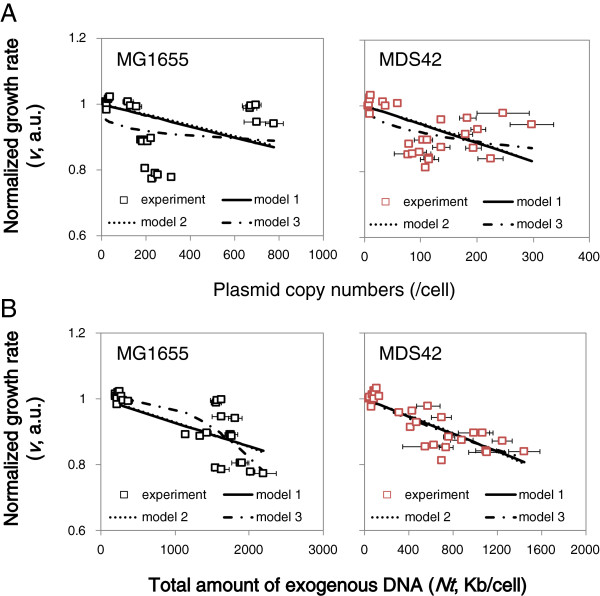
To achieve a quantitative understanding of the negative correlations described above, the adherence of the data to a simple linear regression model (model 1) and two models presented in previous studies [23,24] (models 2 and 3) was assessed. The experimental data sets were used to fit these three models individually (Figure 3), and the parameter constants for these models were calculated by applying least squares regression (Table 1). The significances of the models were evaluated by their residual sum of squares (RSS) (Table 2). When considering the relationship between host cell growth and Nt, we found that none of the three models provided a better fit to the data than the other models. However, model 3 produced the lowest RSS value when the effect of PCN on growth rate was considered. Additionally, for all three models, the analyses of the effect of Nt produced lower RSS values compared to those of PCN, regardless of the host strain. These theoretical analyses support our new findings (Figure 2) and show that a better quantitative evaluation of the cost of plasmids on host growth is achieved by using the relationship between host growth and the total amount of DNA (Nt), as opposed to the plasmid copy number (PCN).
Figure 3.
Comparison among three models. A. Relationships between cell growth rate and either plasmid copy number. B. Relationships between cell growth rate and the total amount of exogenous DNA.. The black and red open squares represent the data for the host strains MG1655 and MDS42, respectively. The bars represent the standard errors of triplicates. The solid, broken and chained lines denote the regression lines for the three models represented by Eqs. 1 (model 1), 2 (model 2) and 3 (model 3), respectively.
Table 1.
Estimated parameter constants in the models
| Host strain | x | a | c | n | K |
|---|---|---|---|---|---|
| MG1655 |
PCN |
-1.7e-4 |
3272 |
0.25 |
44 |
| MDS42 |
PCN |
-5.6e-4 |
973 |
0.48 |
106 |
| MG1655 |
Nt |
-7.2e-5 |
7340 |
2.87 |
1.3e10 |
| MDS42 | Nt | -1.3e-4 | 4065 | 0.97 | 5223 |
The parameter constants (a, c, n and K) for the three models examined (Eqs. 1, 2 and 3, details in the Methods section) were calculated using least squares regression.PCN and Nt are the copy number of plasmids and the total amount of plasmid DNA (the number of nucleotides), respectively.
Table 2.
Residual sums of squares (RSS)
| Host strains | Models | RSS_ PCN | RSS_ Nt |
|---|---|---|---|
| MG1655 |
Eq. 1 |
0.26 |
0.09 |
| MG1655 |
Eq. 2 |
0.26 |
0.09 |
| MG1655 |
Eq. 3 |
0.18 |
0.08 |
| MDS42 |
Eq. 1 |
0.11 |
0.04 |
| MDS42 |
Eq. 2 |
0.12 |
0.04 |
| MDS42 | Eq. 3 | 0.09 | 0.04 |
The RSS values for the regression analyses were used to evaluate the three models.
Interestingly, the clean genome exhibited better fitting irrespective of the regression model employed. The data for the clean genome fit the models better than the native host genome, and the RSS values were lower for MDS42 than MG1655 for both the PCN and Nt data (Table 2). Both the increased significance of the correlation between host growth and the amount of exogenous DNA (Figure 3, Table 2) and the higher correlation coefficients (Figure 2) indicate the highly precise control of either cell growth or DNA replication in MDS42. More predictable levels of performance may occur in hosts with fewer nonessential sequences in its genome (i.e., MDS42). The results from this study were consistent with previous findings that have indicated a highly regular, predictable and well-organized behavior for MDS42 at the genome-wide expression level [18,25,26].
Reduced carrying capacity of the clean genome
Because the linear regression model (model 1) examines the relationship between cell growth rate and the amount of exogenous DNA, the slope (a) represents the magnitude of the growth cost of exogenous DNA to the host. A greater decrease in growth was clearly observed in MDS42 compared to MG1655 (Table 1), indicating that the difference in the carrying capacity for exogenous DNA depended on the host genome size. For example, when the linear regression was normalized by the genome size (Additional file 1: Figure S5), in the case of a 50% decrease in fitness, MG1655 could bear an amount of exogenous DNA that was 1.5-fold greater than its genome size, whereas MDS42 could only bear an amount of exogenous DNAs that was equivalent to its genome size. The clean genome might save cellular energy and/or resources for its own genome and restrict energy and/or resources spent on foreign DNA.
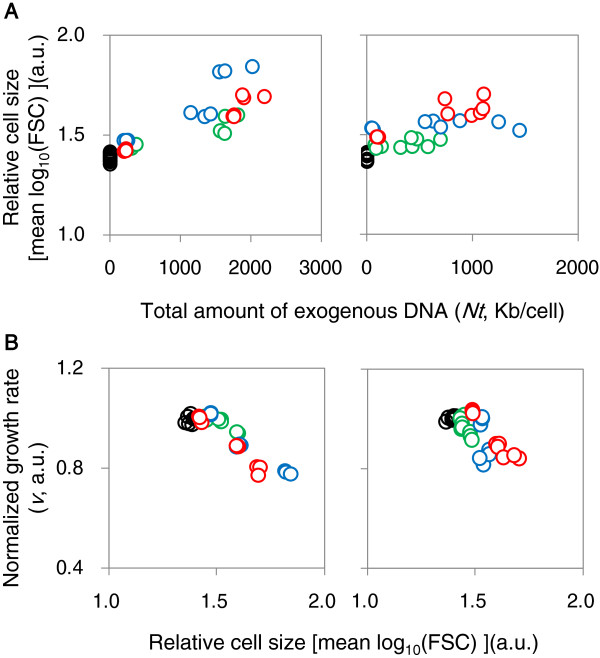
A similar limit to the carrying capacity of foreign DNA was also detected based on cell size, as estimated by flow cytometry. The relative size of the host cells was positively correlated with the total amount of exogenous DNA (Figure 4A) and negatively correlated with the growth rate (Figure 4B), independent of the host strain. That is, the cell sizes of both host strains increased when they contained foreign DNA. However, MG1655 was able to provide a larger amount of cellular space than MDS42 (Figure 4, Additional file 1: Figure S4), which could directly influence the carrying capacity of foreign DNA. The wild-type genome seemed to be more receptive of foreign DNA, while the clean genome appeared to provide more authoritarian control over the cellular conditions for foreign DNA.
Figure 4.
Relationships between cell size and cell growth and between cell size and the amount of exogenous DNA. A. Relationship between cell size and the amount of exogenous DNA. B. Relationship between cell size and cell growth. Cell size is presented as the mean value of FSC signals measured using flow cytometry. The left and right panels indicate the strains MG1655 and MDS42, respectively. The color scheme is as described in Figure 1.
Restricted replication allows for higher expression levels in the clean genome
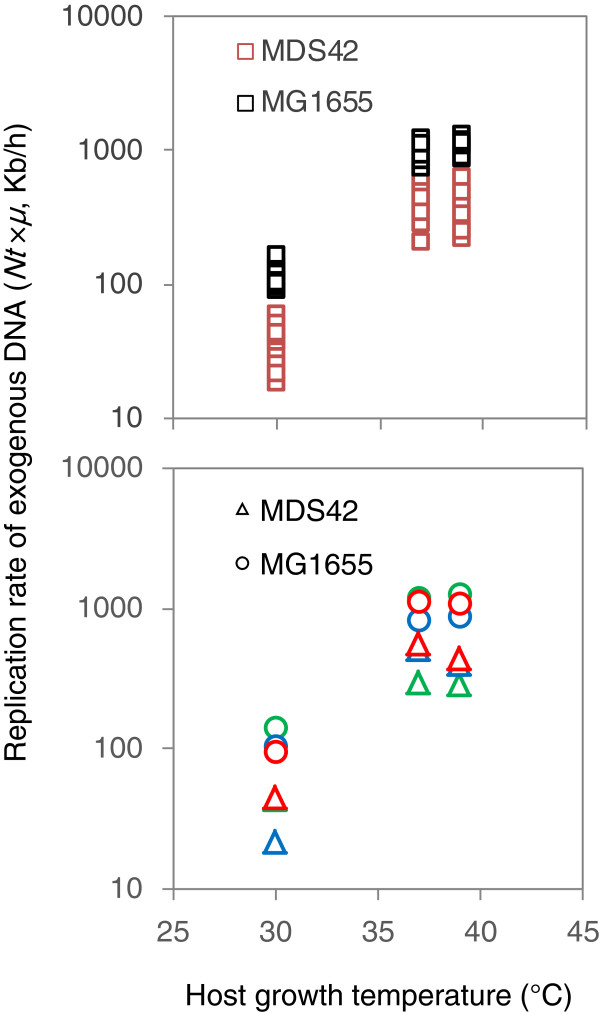
Further analysis demonstrated that the greater decrease in growth with increasing plasmid load (i.e., PCN and/or Nt) in MDS42 compared to MG1655 was due to a slower replication rate of the plasmids (Figure 5). The total amount of exogenous DNA is determined by the equilibrium between production and dilution. As both strains exhibited approximately equal growth rates under identical conditions (Figure 1B), the dilution rates in the two strains were equivalent. Therefore, the accelerated decreases in the amount of exogenous DNA in MDS42 (Table 1) were caused by decreases in the production (replication rates) of the plasmids. A reduced replication rate of exogenous DNA in MDS42 was observed independent of both the growth temperature (Figure 5, upper) and the sizes of plasmids (Figure 5, bottom). The reduction in host genome size decreased the replication capacity for foreign DNA. This result indicates the possibility that the removal of genes from MG1655 influenced the replication of foreign DNA in this strain. As the previously reported genes specifically related to the DNA and protein productivity [21] were not comprised in the deletions, there might be some novel functions interfering with replication or expression among those deleted genes. In another word, the regions that were removed most likely had a buffering effect, releasing the stress caused by the replication of exogenous DNA and helping to maintain cellular homeostasis. Further systematic tests on different types of genomes along with transcriptome analysis are required to acquire a solid conclusion in mechanisms.
Figure 5.
Comparison of replication rates of exogenous DNA in MG1655 and MDS42. The replication rates of exogenous DNA in MG1655 (black squares) and MDS42 (red squares) at various growth temperatures (30, 37 and 39°C) are shown in the upper panel. The averaged replication rates for three different sizes of plasmids (S, M and L displayed in green, blue and red, respectively) are shown in the bottom panel. The replication rates of the plasmids in the strains MDS42 and MG1655 are represented by circles and triangles, respectively. The color scheme is as described in Figure 1.
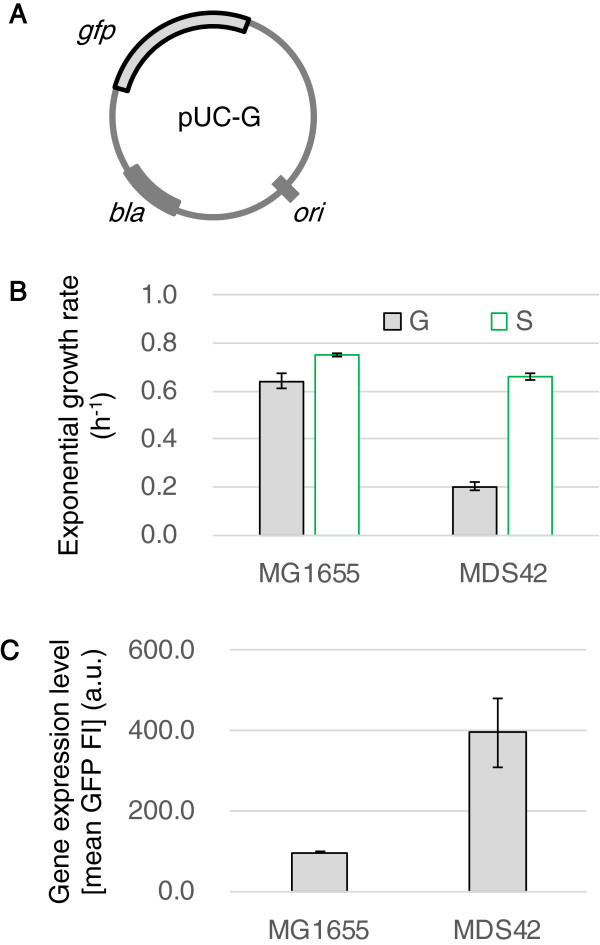
In addition, the expression of the foreign DNA could affect the growth burden to a similar extent as replication. To examine the degree to which the presence of a redundant gene decreases growth rates, the plasmid pUC-G (Figure 6A), which is approximately identical in size to pUC-S but carries a nonessential excess gene (gfp), was inserted into the host cells. For both strains, the growth rates of the host cells that contained pUC-G were much slower than those of host cells that contained pUC-S (Figure 6B). This result verified that the gene expression of plasmids increased the growth burden beyond the cost paid for the replication of the foreign DNA alone. Importantly, MDS42 was more sensitive to this increase in gene expression; the growth rate of MDS42 was approximately one-third of the growth rate of MG1655 in this experiment. The high expression level of the foreign DNA caused the significant decline in the growth rate of MDS42. An approximately three-fold increase in the GFP expression level was detected in MDS42 (Figure 6C), which was consistent with the decrease in growth rate.
Figure 6.
Cost of gene expression of foreign DNA. A. Schematic drawing of the plasmid pUC-G. B. Exponential growth rates of host cells that contain plasmids. G and S indicate the host cells (MG1655 and MDS42) that contain pUC-G or pUC-S, respectively. C. Gene expression levels in MG1655 and MDS42. The mean values of GFP fluorescence intensities (GFP FIs) were calculated to determine the relative levels of gene expression in the host cells, MG1655 and MDS42. The bars represent the standard errors of triplicates. Both increased expression and decreased host growth occurred in MDS42 were highly significant (p < 0.001).
Taken together, the plasmid carrying capacity was lower in MDS42, independent of the growth temperature or the plasmid size (Figure 5), whereas gene expression was definitely higher in MDS42 (Figure 6C), a finding in agreement with previous reports [15,18]. Compared to the wild-type genome, the clean genome assigned a higher priority to the gene expression of foreign DNA than to its replication. Such trade-off like phenomena of increased protein production with decreased plasmid carrying capacity in the reduced genome could be also detected when using the rich medium, despite of the highly accelerated cell growth (Additional file 1: Figure S6). This finding indicates that removing the redundant genes from a host genome can save energy and resources for their direction toward both host genome expression [18] and the expression of foreign genes (Figure 6C), but not DNA replication.
Conclusions
In summary, the burden of foreign DNA was evaluated in two E. coli strains with different genome sizes. The growth rates of both host strains were more negatively correlated with the total amount of exogenous DNA than the plasmid copy numbers. The growth decrease, which was mediated by plasmid replication, was more significant and more theoretically predictable in the strain with the clean genome (MDS42) than that with the wild-type genome (MG1655). The greater decrease in growth that occurred in MDS42 was caused by a slower replication rate of foreign DNA. The results indicate that the MG1655 strain can bear more exogenous DNA but experiences an equivalent loss in growth fitness, whereas MDS42 can restrict the amplification of foreign DNA to maintain its level of growth fitness. Plasmids that are inhibited by constraints in the cellular conditions for replication might benefit from the highly induced level of gene expression found in MDS42. These results indicate that the wild-type strain MG1655 is more suitable for an endosymbiotic application and possesses an advantage in terms of adaptation and evolution, whereas the engineered, clean-genome strain MDS42 more closely resembles a type of living machinery (a controllable cell) and is more suitable for the precise control and production of synthetic materials.
Methods
Plasmid construction
The lacZ region of pUC19 was removed using the In-Fusion HD Cloning Kit (Clontech) and the pUC19_del_lacZ_Fw and pUC19_del_lacZ_Rv primers. Both colony PCR and blue-white selection were performed to verify the deletion. The resultant plasmid had a length of 2,334 bp and was named pUC-S. A DNA sequence (4,092 bp) of pSC101 was amplified with the pSC101_seq_Fw and pSC101_seq_Rv primers. Using the In-Fusion HD Cloning Kit, the resultant fragment was inserted into plasmid pUC19 in the same region where pUC-S was inserted, by using the pUC19_del_lacZ_linearize_Fw and pUC19_del_lacZ_linearize_Rv primers. This increased the plasmid length of pUC-M to a total length of 6,426 bp. A longer fragment (6,986 bp) from pSC101 that included the tetracycline-resistance gene (Tcr) was amplified using the pSC101_seq_Fw2 and pSC101_seq_Rv2 primers and then inserted into pUC19 as described above to create the pUC-preL plasmid. Subsequently, a 198-bp fragment was removed from the translation initiation region for Tcr in pUC-preL using the primers pSC101_del_TcR_Fw and pSC101_del_TcR_Rv, which formed a 9,573-bp-long plasmid, pUC-L. Thus, all three plasmids that were produced had a common site of initiation for replication derived from pUC19, and carried a single gene for ampicillin resistance.
A GFP sequence that includes the promoter Ptet was amplified from the pBRgalKGR plasmid (a pBR322 derivative) [26,27] using the pBR_gfp_kanR_Fw and pBR_gfp_kanR_Rv primers. The lacZ region of pUC19 was also removed using the In-Fusion HD Cloning Kit (Clontech) but with a different primer set (pUC19_del_lacZ_linearize_Fw and pUC19_del_lacZ_linearize_Rv2), resulting in a 2,334-bp-long fragment, the same length as pUC-S. The two fragments were ligated using the In-Fusion HD Cloning Kit. The kanR gene sequence (2,866 bp) was removed using the pUC_del_kanR_Fw and pUC_del_kanR_Rv primers, which finally created the pUC-G plasmid. ECOS™ Competent E. coli DH5α cells (Nippon Gene) were used for the cloning and amplification of the plasmids. All the primers used in this study are listed in Additional file 1: Table S1.
Cell culture and FCM analysis
Cells were cultured in minimal media as described previously [26]. E. coli cells that carried the desired plasmids were grown in media that contained an additional 50 μg/mL of ampicillin. The cell concentrations were determined using a flow cytometer (FACSCanto™II, Becton, Dickson and Company) equipped with a 488-nm argon laser and a 515–545-nm emission filter (GFP), as previously reported [26]. The following PMT voltage settings were applied: forward scattering (FSC), 420; side scattering (SSC), 400; and FITC (GFP), 375. The flow cytometry datasets for FSC and GFP, which measure relative cell sizes and gene expression levels, respectively, were analyzed using custom-made R scripts, as described previously [28]. Cell growth was measured during the exponential growth phase; the initial and final cell concentrations were approximately 1-2 × 10⁶ cells/mL and 0.5-2 × 10⁸ cells/mL, respectively, during this stage of growth. The growth rate (μ) was calculated according from the initial and final cell concentrations and the length of time between initial and final measurements (8 hours) [18]. The growth data was normalized (ν) according to the following equations, as described previously [7,29]:
Plasmid copy number and total amount of exogenous DNA
Plasmid copy numbers were determined by qPCR using the StepOnePlus™ Real-Time PCR System (Applied Biosystems) and SYBR Premix Ex Taq™ II (Tli RNaseH Plus) (TaKaRa). The primers (Additional file 1: Table S1) used to amplify the host genome (dxs_Fw and dxs_Rv) and the plasmid DNA (bla_Fw and bla_Rv) were identical to those used in a previous report [30]. Real-time qPCR reactions were performed using the following program: incubation at 95°C for 30 s, followed by 40 cycles of 95°C for 5 s and 60°C for 60 s. After the final cycle, a melting curve analysis with a temperature gradient of 0.5°C/s from 60°C to 95°C was performed. Aliquots of purified genomic DNA and plasmid DNA were used as the standards for the genome-specific and plasmid-specific qPCR, respectively. The plasmid DNA and genomic DNA were purified using the QIAprep Spin Miniprep Kit (QIAGEN) and the Wizard Genomic DNA Purification Kit (Promega), respectively, according to the manufacturer’s instructions. The abundances of both plasmid DNA and genomic DNA in the E. coli cells were determined using standard curves based on the bla and dxs genes, respectively. The plasmid copy number (PCN) and the total amount of exogenous DNA (Nt) were calculated according to the following equations:
Evaluation of various models
A simple linear regression model was applied to the data for both strains, based on the following equation (Eq. 1, assigned to model 1):
| (1) |
Here, a represents the cost bias of plasmid replication and b is the growth rate of the native host cells without plasmids. For example, when the host does not contain a plasmid (x = 0), the growth rate is equal to b (i.e., b = 1). In addition to the simple linear model (Eq. 1), the model primarily used in this study, two other models (Eqs. 2 and 3) have also been previously used [23,24] to estimate the relationship between plasmid copy number (x) and host growth rate (y):
| (2) |
| (3) |
In all three models (equivalent to Eqs. 1, 2 and 3), y is the normalized growth rate and x indicates either the copy number of plasmids or the total amount of plasmid DNA. The parameter c represents the maximum possible number of plasmids per cell, and the exponent m was set to 0.5 according to the recommendation of a previous study [23].
Competing interests
The authors declare that they have no competing interest.
Authors’ contributions
YA and BWY conceived the research. YA performed experiments. YA, BWY and ST analyzed the data. BWY wrote the paper. TY provided the experimental and analytical tools and revised the manuscript. All authors approved the final manuscript.
Supplementary Material
Supplementary information containing Figures S1-S6 and Table S1.
Contributor Information
Yuya Akeno, Email: akeno-yuya@bio.eng.osaka-u.ac.jp.
Bei-Wen Ying, Email: ying.beiwen.gf@u.tsukuba.ac.jp.
Saburo Tsuru, Email: tsuru_saburo@bio.eng.osaka-u.ac.jp.
Tetsuya Yomo, Email: yomo@ist.osaka-u.ac.jp.
Acknowledgements
This work was partially supported by a Grant-in-Aid for Scientific Research on Innovative Areas No. 25111715 (to BWY) from the Ministry of Education, Culture, Sports, Science and Technology, Japan.
References
- Bailey JE, Da Silva NA, Peretti SW, Seo JH, Srienc F. Studies of host-plasmid interactions in recombinant microorganisms. Ann N Y Acad. 1986;469:194–211. doi: 10.1111/j.1749-6632.1986.tb26498.x. [DOI] [PubMed] [Google Scholar]
- Pinkney M, Thomas CM. Replication and maintenance of promiscuous plasmids of gram-negative bacteria. Microbiol Sci. 1987;4(6):186–191. [PubMed] [Google Scholar]
- Spalding A, Tuite MF. Host-plasmid interactions in Saccharomyces cerevisiae: effect of host ploidy on plasmid stability and copy number. J Gen Microbiol. 1989;135(4):1037–1045. doi: 10.1099/00221287-135-4-1037. [DOI] [PubMed] [Google Scholar]
- Friehs K. Plasmid copy number and plasmid stability. Adv Biochem Eng Biotechnol. 2004;86:47–82. doi: 10.1007/b12440. [DOI] [PubMed] [Google Scholar]
- Haft RJ, Mittler JE, Traxler B. Competition favours reduced cost of plasmids to host bacteria. ISME J. 2009;3(7):761–769. doi: 10.1038/ismej.2009.22. [DOI] [PubMed] [Google Scholar]
- Srivastava P, Singh P, Narayanan N, Deb JK. Physiological and biochemical consequences of host-plasmid interaction–a case study with Corynebacterium renale, a multiple cryptic plasmid containing strain. Plasmid. 2011;65(2):110–117. doi: 10.1016/j.plasmid.2010.11.003. [DOI] [PubMed] [Google Scholar]
- Harrison E, Koufopanou V, Burt A, MacLean RC. The cost of copy number in a selfish genetic element: the 2-μm plasmid of Saccharomyces cerevisiae. J Evol Biol. 2012;25(11):2348–2356. doi: 10.1111/j.1420-9101.2012.02610.x. [DOI] [PubMed] [Google Scholar]
- Hernandez-Arriaga AM, Espinosa M, del Solar G. Fitness of the pMV158 replicon in Streptococcus pneumoniae. Plasmid. 2012;67(2):162–166. doi: 10.1016/j.plasmid.2012.01.005. [DOI] [PubMed] [Google Scholar]
- Seo JH, Bailey JE. Effects of recombinant plasmid content on growth properties and cloned gene product formation in Escherichia coli. Biotechnol Bioeng. 1985;27(12):1668–1674. doi: 10.1002/bit.260271207. [DOI] [PubMed] [Google Scholar]
- Silva F, Queiroz JA, Domingues FC. Evaluating metabolic stress and plasmid stability in plasmid DNA production by Escherichia coli. Biotechnol Adv. 2012;30(3):691–708. doi: 10.1016/j.biotechadv.2011.12.005. [DOI] [PubMed] [Google Scholar]
- Lane N, Martin W. The energetics of genome complexity. Nature. 2010;467(7318):929–934. doi: 10.1038/nature09486. [DOI] [PubMed] [Google Scholar]
- Posfai G, Plunkett G 3rd, Feher T, Frisch D, Keil GM, Umenhoffer K, Kolisnychenko V, Stahl B, Sharma SS, de Arruda M, Burland V, Harcum SW, Blattner FR. Emergent properties of reduced-genome Escherichia coli. Science. 2006;312(5776):1044–1046. doi: 10.1126/science.1126439. [DOI] [PubMed] [Google Scholar]
- Csorgo B, Feher T, Timar E, Blattner FR, Posfai G. Low-mutation-rate, reduced-genome Escherichia coli: an improved host for faithful maintenance of engineered genetic constructs. Microbial Cell Factories. 2012;11:11. doi: 10.1186/1475-2859-11-11. [DOI] [PMC free article] [PubMed] [Google Scholar]
- Chakiath CS, Esposito D. Improved recombinational stability of lentiviral expression vectors using reduced-genome Escherichia coli. Escherichia Coli Biotechniques. 2007;43(4):466–470. doi: 10.2144/000112585. [DOI] [PubMed] [Google Scholar]
- Sharma SS, Campbell JW, Frisch D, Blattner FR, Harcum SW. Expression of two recombinant chloramphenicol acetyltransferase variants in highly reduced genome Escherichia coli strains. Biotechnol Bioeng. 2007;98(5):1056–1070. doi: 10.1002/bit.21491. [DOI] [PubMed] [Google Scholar]
- Lee JH, Sung BH, Kim MS, Blattner FR, Yoon BH, Kim JH, Kim SC. Metabolic engineering of a reduced-genome strain of Escherichia coli for L-threonine production. Microbial Cell Factories. 2009;8:2. doi: 10.1186/1475-2859-8-2. [DOI] [PMC free article] [PubMed] [Google Scholar]
- Umenhoffer K, Feher T, Baliko G, Ayaydin F, Posfai J, Blattner FR, Posfai G. Reduced evolvability of Escherichia coli MDS42, an IS-less cellular chassis for molecular and synthetic biology applications. Microbial Cell Factories. 2010;9:38. doi: 10.1186/1475-2859-9-38. [DOI] [PMC free article] [PubMed] [Google Scholar]
- Ying BW, Seno S, Kaneko F, Matsuda H, Yomo T. Multilevel comparative analysis of the contributions of genome reduction and heat shock to the Escherichia coli transcriptome. BMC Genom. 2013;14:25. doi: 10.1186/1471-2164-14-25. [DOI] [PMC free article] [PubMed] [Google Scholar]
- Blattner FR, Plunkett G 3rd, Bloch CA, Perna NT, Burland V, Riley M, Collado-Vides J, Glasner JD, Rode CK, Mayhew GF, Gregor J, Davis NW, Kirkpatrick HA, Goeden MA, Rose DJ, Mau B, Shao Y. The complete genome sequence of Escherichia coli K-12. Science. 1997;277(5331):1453–1462. doi: 10.1126/science.277.5331.1453. [DOI] [PubMed] [Google Scholar]
- Bower DM, Prather KL. Engineering of bacterial strains and vectors for the production of plasmid DNA. Appl Microbiol Biotechnol. 2009;82(5):805–813. doi: 10.1007/s00253-009-1889-8. [DOI] [PubMed] [Google Scholar]
- Goncalves GA, Bower DM, Prazeres DM, Monteiro GA, Prather KL. Rational engineering of Escherichia coli strains for plasmid biopharmaceutical manufacturing. Biotechnol J. 2012;7(2):251–261. doi: 10.1002/biot.201100062. [DOI] [PubMed] [Google Scholar]
- Lin-Chao S, Chen WT, Wong TT. High copy number of the pUC plasmid results from a Rom/Rop-suppressible point mutation in RNA II. Mol Microbiol. 1992;6(22):3385–3393. doi: 10.1111/j.1365-2958.1992.tb02206.x. [DOI] [PubMed] [Google Scholar]
- Lee SB, Seressiotis A, Bailey JE. A kinetic model for product formation in unstable recombinant populations. Biotechnol Bioeng. 1985;27(12):1699–1709. doi: 10.1002/bit.260271211. [DOI] [PubMed] [Google Scholar]
- Bentley WE, Quiroga OE. Investigation of subpopulation heterogeneity and plasmid stability in recombinant Escherichia coli via a simple segregated model. Biotechnol Bioeng. 1993;42(2):222–234. doi: 10.1002/bit.260420210. [DOI] [PubMed] [Google Scholar]
- Matsumoto Y, Murakami Y, Tsuru S, Ying BW, Yomo T. Growth rate-coordinated transcriptome reorganization in bacteria. BMC Genom. 2013;14(1):808. doi: 10.1186/1471-2164-14-808. [DOI] [PMC free article] [PubMed] [Google Scholar]
- Ying BW, Tsuru S, Seno S, Matsuda H, Yomo T. Gene expression scaled by distance to the genome replication site. Mol Biosyst. 2014;10(3):375–379. doi: 10.1039/c3mb70254e. [DOI] [PubMed] [Google Scholar]
- Ying BW, Ito Y, Shimizu Y, Yomo T. Refined method for the genomic integration of complex synthetic circuits. J Biosci Bioeng. 2010;110(5):529–536. doi: 10.1016/j.jbiosc.2010.05.014. [DOI] [PubMed] [Google Scholar]
- Shimizu Y, Tsuru S, Ito Y, Ying BW, Yomo T. Stochastic switching induced adaptation in a starved Escherichia coli population. PloS One. 2011;6(9):e23953. doi: 10.1371/journal.pone.0023953. [DOI] [PMC free article] [PubMed] [Google Scholar]
- MacLean RC, Perron GG, Gardner A. Diminishing returns from beneficial mutations and pervasive epistasis shape the fitness landscape for rifampicin resistance in Pseudomonas aeruginosa. Genetics. 2010;186(4):1345–1354. doi: 10.1534/genetics.110.123083. [DOI] [PMC free article] [PubMed] [Google Scholar]
- Lee C, Kim J, Shin SG, Hwang S. Absolute and relative QPCR quantification of plasmid copy number in Escherichia coli. J Biotechnol. 2006;123(3):273–280. doi: 10.1016/j.jbiotec.2005.11.014. [DOI] [PubMed] [Google Scholar]
Associated Data
This section collects any data citations, data availability statements, or supplementary materials included in this article.
Supplementary Materials
Supplementary information containing Figures S1-S6 and Table S1.


