

Abstract
Dietary methionine restriction (MR) and calorie restriction (CR) each improve metabolic health and extend life span. We used comprehensive transcriptome profiling and systems biology analysis to interrogate the unique and overlapping molecular responses in rats provided these dietary regimens for 20 mo after weaning. Microarray analysis was conducted on inguinal white adipose (IWAT), brown adipose tissue (BAT), liver, and skeletal muscle. Compared to controls, CR-induced transcriptomic responses (absolute fold change ≥1.5 and P≤0.05) were comparable in IWAT, BAT, and liver (∼800 genes). MR-induced effects were largely restricted to IWAT and liver (∼2400 genes). Pathway enrichment and gene-coexpression analyses showed that induction of fatty acid synthesis in IWAT was common to CR and MR, whereas immunity and proinflammatory signaling pathways were specifically down-regulated in MR-treated IWAT and liver (FDR≤0.07–0.3). BAT demonstrated consistent down-regulation of PPAR-signaling under CR and MR, whereas muscle was largely unaffected. Interactome analysis identified CR-specific down-regulation of cytoskeletal matrix components in IWAT and MR-specific up-regulation of ribosomal genes in liver (FDR≤0.001). Transcriptomic down-regulation of inflammation genes by MR in IWAT was consistent with upstream inhibition of STAT3. Together, these results provide an integrated picture of the breadth of transcriptional responses to MR and CR among key metabolic tissues.—Ghosh, S., Wanders, D., Stone, K. P., Van, N. T., Cortez, C. C., Gettys, T. W. A systems biology analysis of the unique and overlapping transcriptional responses to caloric restriction and dietary methionine restriction in rats.
Keywords: obesity, animal models, insulin sensitivity, amino acid sensing
Calorie restriction (CR) to 60% of ad libitum intake produces a robust and reproducible extension of mean and maximal life span across species (1–3). CR is recognized as the gold standard for life span extension, but the difficulty of adhering to this dietary regimen has spurred the search for CR mimetics that extend life without imposition of severe food intake restriction. Dietary methionine restriction (MR) has emerged as a promising candidate because restriction of methionine from normal levels of ∼0.6–0.8% (e.g., 0.6–0.8 g methionine/100 g diet) to 0.17% has proven particularly effective, reproducing CR's life-extending effects at ad libitum intake of the MR diet (4, 5). In addition to longevity, CR and MR promote healthy aging by reducing adiposity, increasing insulin sensitivity, and producing an improvement in biomarkers of metabolic health (4, 6, 7).
Biological responses to CR or dietary MR are multifaceted and include transcriptional, proteomic, and biochemical changes across multiple tissues. Recent studies advance the concept that the increased disease risk and acceleration of aging linked to excess adiposity is fundamental to the extension of life span by dietary regimens that limit age-associated increases in adiposity (8–10). Accumulation of excess adipose tissue accelerates the development of a chronic, systemic proinflammatory state that predisposes to subsequent development of type 2 diabetes, hepatic steatosis, hypertension, atherosclerosis, cancer, and asthma (11). Obesity-induced inflammation is comparable to the inflammation that accompanies aging, including increased production of reactive oxygen species and inflammatory cytokines (12). Given that chronic CR and dietary MR produce comparable extensions in rodent life span (1, 2, 4, 5), we recently examined the transcriptional effect of the two dietary regimens on the systems biology of systemic inflammation (13). Despite comparable reductions in adiposity, the two dietary regimens produced fundamentally different anti-inflammatory responses in liver and adipose tissue. Our recent studies employed a pathway-directed approach to examine the transcriptional effects of MR on lipid metabolism and found that the diet remodels the integration of lipid metabolism between liver and adipose tissue (14). Although significant effort has been devoted to examining the transcriptional responses to CR over time in multiple tissues (15–17), a rigorous side-by-side comparison of the systems biology of the transcriptional responses to long-term CR and MR has not been published. To that end, we have employed a systematic, unbiased analytical sequence to examine the organization and systems biology of transcriptional responses to the two diets. With this approach, we have sought to identify transcriptional programs common to and unique to the two dietary regimens in peripheral, metabolically active tissues.
MATERIALS AND METHODS
All experiments were reviewed and approved by the Pennington Biomedical Research Center Institutional Animal Care and Use Committee on the basis of guidelines established by the National Research Council, the Animal Welfare Act, and the Public Health Service Policy on the humane care and use of laboratory animals. The experiment was conducted using 24 male F344 rats obtained from Harlan (Indianapolis, IN, USA) at 5 wk of age. They were then singly housed in shoebox cages with corncob bedding and were randomly assigned in equal numbers to a control group, a CR group, or an MR group. As described previously (7), rats in the control group received a purified control diet containing 0.86% methionine, while rats in the MR group received an identical diet except that methionine was restricted to 0.17%. Both of these groups received their diets ad libitum. The CR group was fed the control diet but with intake restricted to 60% of average daily intake of the control group. The energy content of both control and MR diets (Dyets Inc., Bethlehem, PA, USA) was 15.96 kJ/g, with 18.9% of energy coming from fat (corn oil), 64.9% from carbohydrate, and 14.8% from a custom mixture of l-amino acids (7). Water was provided ad libitum, room temperature was maintained at 22–23°C, and lights were on 12 h/d from 7:00 AM to 7:00 PM. All groups received their respective diets for 20 mo, after which, tissues were harvested from each animal and snap-frozen for analysis.
Isolation and analysis of RNA
To assess the transcriptional basis for improvement in metabolic biomarkers after long-term CR and MR reported previously (7), gene expression profiles were generated using rat genome microarrays (Applied Biosystems, Foster City, CA, USA) containing ∼27,000 probes covering ∼43,500 transcripts. In brief, total RNA from liver, gastrocnemius muscle, inguinal white adipose tissue (IWAT), and brown adipose tissue (BAT) from each rat was quickly harvested between 10:00 AM and 12:00 PM. Concentration and integrity of the extracted RNA were assessed by the NanoDrop ND-1000 spectrophotometer (NanoDrop Technologies, Wilmington, DE, USA) and the Agilent 2100 Bioanalyzer (Agilent Technologies, Fort Worth, TX, USA). The RNA integrity number (RIN) for all samples ranged from 8.8 to 9.1.
The gene expression profiles were assessed by pooling equal amounts of RNA from each tissue from randomly selected pairs of animals in each group. The resulting 4 samples from each tissue and diet were used for labeling and hybridization. For each sample, 1 μg of total RNA was used for reverse transcription and 1 round of in vitro transcription (via the Eberwine linear amplification procedure), to generate digoxigenin-labeled cRNA (DIG-cRNA), using the Chemiluminescent NanoAmp RT-IVT Kit (Applied Biosystems). The DIG-cRNA (10 μg) was fragmented at 60°C for 30 min and subsequently used for microarray hybridization (Rat Genome Survey) at 55°C for 18 h. Gene expression signals were obtained by chemiluminescence detection via anti-DIG antibody, alkaline phosphatase, and chemiluminescent substrate. Processing, detection, and image analysis were performed according to Applied Biosystems protocols and the 1700 Chemiluminescent Microarray Analyzer 1.0.3 software (Applied Biosystems).
Microarray data processing and analysis
Features with signal/noise values ≥3 and quality flag values <5000 were considered “detected” and used for further analysis. Signal intensities across microarrays were log transformed (to base 2) and normalized using the quantile–quantile method in the Biometric Research Branch (BRB; U.S. National Cancer Institute, Bethesda, MD, USA) BRB-Array Tools software (18). Statistical significance of the differentially expressed genes was ascertained via a regularized t test based on the bayesian statistical framework (19). The magnitude of gene expression changes was quantified by the difference in the log average signals between the CR- or MR-treated and control samples.
Expression levels of representative genes from the microarray analysis were validated using the individual RNA samples from each animal and tissue by real-time quantitative PCR (qPCR) as described in detail previously (13, 14).
Pathway enrichment analysis
Pathway enrichment analysis was conducted via two independent approaches: gene set enrichment analysis (GSEA) and overrepresentation analysis (ORA). GSEA was performed on an unfiltered, ranked list of genes (ranked by the level of differential expression), and a running-sum statistic was used to determine the enrichment of a priori defined gene sets (pathways) based on the gene ranks. Statistical significance of pathway enrichment score was ascertained by permutation testing over size-matched random gene sets, and multiple testing was controlled by the false discovery rate (FDR; ref. 20). A relatively liberal FDR threshold of 30% was used at this stage to increase power for detection of weak pathway enrichment signals across the different diets and tissues. The analysis was performed via the GSEA module in Genepattern (http://genepattern.broadinstitute.org). Pathway information was obtained from the Kyoto Encyclopedia of Genes and Genomes (KEGG) pathway version (21) available at the Molecular Signatures Database (http://www.broadinstitute.org/gsea/msigdb/index.jsp).
In contrast, ORA calculates enrichment of the number of genes belonging to a pathway from prefiltered gene lists compared to the total number of genes in the pathway. ORA was conducted in the Ingenuity Pathway Analysis (IPA; Ingenuity Systems, Inc., Redwood, CA, USA) environment by employing a prefiltered list of differentially expressed genes with P < 0.05 and absolute fold change ≥ 1.5-fold. For purposes of enrichment analysis, the Ingenuity Knowledge Base was used as the source for the reference genes. Overrepresentation of biological pathways was ascertained via Fisher's exact test and corrected for multiple testing by the Benjamin-Hochberg procedure (22).
Analysis of biological functions
An additional capability in IPA is the analysis of biological functions (biofunctions), which are similar in concept to the Gene Ontology (GO; http://www.geneontology.org) Biological Process and Molecular Function categories but based on the curated knowledge base in IPA. Top-level biofunctions generally describe broad cellular processes, whereas secondary functions provide greater functional specificity (for example, outgrowth of neurites, reorganization of cytoskeleton, cell spreading, polarization of leukocytes, etc., are subfunctions of the top-level biofunction cell morphology). Each subfunction is assigned a list of genes based on the evidence of the genes' involvement in that function (based on information curated by IPA). The principles of ORA described above are applied to the subfunctions to assess enrichment. The enrichment P value is calculated using the right-tailed Fisher's exact test. In addition to the P value, IPA also infers the overall likelihood of activation/inhibition of a biofunction based on the known individual activating/inhibiting effects of the genes on that function (derived from literature). The preponderance of evidence is statistically represented as a z score, and biofunctions with an absolute z score ≥2 are predicted to be activated or inhibited, based on the sign of the z score (http://pages.ingenuity.com/rs/ingenuity/images/0812%20downstream_effects_analysis_whitepaper.pdf). Biofunctions with very small (<20) or very large (>200) numbers of genes were excluded from the analysis to reduce spuriously significant findings or findings lacking sufficient mechanistic specificity.
Analysis of upstream activators
IPA also provides an exploratory analysis platform to predict upstream regulators whose activation/inhibition may explain the observed gene expression patterns. The basis of this analysis is similar to that of biofunctions: Genes are assigned to upstream regulators based on previous experimental evidence from the literature, and the expected effects of the activator/repressor on expression of a gene are compared against the observed direction of gene expression change in the study. An ORA (Fisher's exact test) is first performed to determine whether a regulator is enriched for differential expression of its target genes. The activation/inhibition of the regulator is inferred from the consistencies among the expression patterns of the target genes, via the z score, as described above.
Network enrichment analysis
Network enrichment analysis was conducted on two levels, analysis of gene coexpression networks and analysis of functionally interacting networks.
Gene coexpression network analysis
Networks arising from gene coexpression patterns were analyzed via the FunNet package in R (23). Gene expression data were initially analyzed to identify a set of significantly overrepresented KEGG pathways composed of highly coexpressed transcripts (absolute Pearson correlation >0.8). Next, the topological proximity of the significant KEGG pathways was quantified via a nonlinear dynamic modeling algorithm based on the similarity of the expression profiles of the genes underlying the pathways. A stricter multiple testing correction threshold (5% FDR) was applied at this stage to identify only highly enriched coexpression modules. These pathway modules, composed of functionally related and significantly coexpressed transcripts, were then subjected to unsupervised multi-instance clustering to derive the structure of the coexpression network. The network modules were visualized and further characterized via the FunNetViz plug-in in the Cytoscape 2.8.3 software environment (24).
Functional interaction network (FIN) analysis
Analysis of functionally interacting networks was conducted via the ReactomeFI plug-in (25) in the Cytoscape software environment. Functional interactions were drawn from the Reactome-FIs dataset, which unites molecular interactions from Reactome (http:www.reactome.org) and other pathway databases (21, 25, 26) with pair-wise interactions gleaned from protein–protein interactions, gene coexpression, protein domain–domain interactions, text mining, and GO annotations (27). The complete Reactome-FIs network (December 2012 version) contains 209,988 functional interactions encompassing 10,956 proteins reflecting 46% of SwissProt proteins. The Reactome FI networks thus describe an interactome that is built on validated, mechanism-driven biological processes, leading to greater biological interpretability (27). In our study, functionally interacting networks were identified from an identical list of differentially expressed genes used for IPA analysis (P<0.05 and absolute fold change ≥1.5-fold). The resulting network was subjected to spectral partition clustering (28) to identify its internal modular substructures. Resulting modules were subsequently tested for overrepresentation of biological processes via KEGG pathway terms.
RESULTS
General effects on gene expression
Using a value of P < 0.05 and absolute fold change ≥ 1.5-fold cutoff for differential gene expression, we first compared the overall transcriptomic response among the 4 tissues under conditions of MR and CR, compared to controls. The results summarized in Fig. 1 show that under conditions of CR, the number of differentially expressed genes for IWAT, liver, and BAT were comparable (785, 764, and 858, respectively), with a lower number for skeletal muscle (482). For MR, however, the effects were largely restricted to IWAT and liver (2510 and 2377 differentially expressed genes, respectively), with a comparably smaller number of differentially expressed genes in BAT (990) and skeletal muscle (623). The tissues from the CR group are designated CR_IWAT, CR_Liver, CR_BAT, and CR_Muscle, while the corresponding tissues from the MR group are designated MR_IWAT, MR_Liver, MR_BAT, and MR_Muscle. A 4-way Venn analysis was used to test for coregulation of genes across tissues. A core group of 10 genes for CR (Fig. 1, left panel) and 51 genes for MR (Fig. 1, right panel) were differentially expressed in all 4 tissues (genes differentially regulated by CR and MR in all tissues are listed in Ancillary Table A1; http://www.pbrc.edu/docs/AncillaryTable1.xlsx).
Figure 1.
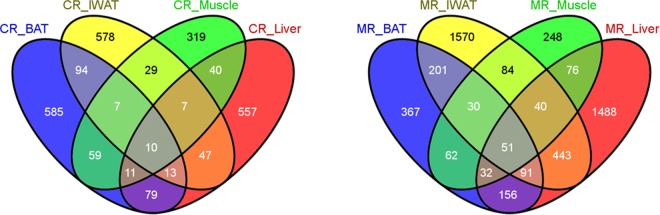
Comparative analysis of differentially expressed genes using Venn diagrams. Differentially expressed genes (defined as genes with an absolute fold change ≥1.5-fold and P≤0.05) were compared among the 4 tissues studied and for each of the treatments (CR, MR). Number of differentially expressed genes for each comparison is indicated, including the number of overlapping genes for any pairwise or higher-order comparisons.
We next compared the extent of overlap among differentially expressed genes in the 4 tissues for each of the dietary treatments (Table 1). Overall, we observed greater overlap among the tissues for MR compared to CR. The highest overlap of differentially expressed genes was observed between MR_IWAT and MR_BAT (38% with respect to BAT). In contrast, the highest overlap observed in tissues from the CR group was only 18%, between CR_Muscle and CR_BAT (with respect to muscle). Also, the overlap between differentially expressed genes in IWAT and liver, the two most transcriptionally responsive tissues, was substantially increased in MR compared to CR (25% vs. 10% with respect to liver).
Table 1.
Proportion of overlapping genes between pairwise comparisons of tissues and treatments
| Tissue | CR |
MR |
||||||
|---|---|---|---|---|---|---|---|---|
| IWAT | Liver | BAT | Muscle | IWAT | Liver | BAT | Muscle | |
| IWAT | 1.00 | 0.10 | 0.16 | 0.07 | 1.00 | 0.25 | 0.15 | 0.08 |
| Liver | 0.10 | 1.00 | 0.15 | 0.09 | 0.26 | 1.00 | 0.14 | 0.08 |
| BAT | 0.14 | 0.13 | 1.00 | 0.10 | 0.38 | 0.33 | 1.00 | 0.18 |
| Muscle | 0.11 | 0.14 | 0.18 | 1.00 | 0.33 | 0.32 | 0.28 | 1.00 |
Proportion of differentially expressed genes that overlap between any pairwise comparison is expressed as a fraction of 1 and always compared with respect to the tissue in the first column.
Analysis of canonical pathways
To begin to identify common and unique molecular signatures of the two diets, we performed gene-set enrichment analysis via the GSEA program to identify canonical pathways drawn from the KEGG database that were enriched in differentially expressed genes across diets and tissues (Fig. 2). The significance of an enrichment of a pathway for any given treatment was assessed by the FDR. No pathways in CR_Liver and CR_Muscle were found to be significant, even after relaxing the FDR threshold to 30%. At a similar FDR threshold, MR_IWAT samples showed an up-regulation of metabolic pathways (biosynthesis of unsaturated fatty acids, glycerophospholipid metabolism, pyruvate metabolism, PPAR signaling, etc.) and a down-regulation of pathways related to immunity and proinflammatory signaling (cytokine-cytokine receptor interaction, chemokine signaling, toll-like receptor signaling, etc.), all at nominal P values < 0.05. CR_IWAT samples displayed a similar enrichment of metabolic pathway up-regulation as in MR but with weaker FDR scores. A distinct set of pathways, related to cytoskeletal matrix organization, were found to be down-regulated in the CR_IWAT samples (focal adhesion, cardiac muscle contraction, tight junction, etc.). MR_Liver displayed a very significant up-regulation of the protein translation machinery (ribosome, aminoacyl tRNA biosynthesis, nitrogen metabolism, etc.), whereas immunity and proinflammatory signaling pathways were down-regulated, similar to the observations in IWAT. A pathway related to protein export was the only significantly up-regulated pathway in MR_BAT, whereas pathways related to complement and coagulation cascade, xenobiotic metabolism and PPAR signaling were down-regulated. CR_BAT also showed an up-regulation of the protein export pathway along with steroid biosynthesis and histidine metabolism. Among the pathways down-regulated in response to CR in BAT, complement coagulation cascade and PPAR signaling were again observed. MR led to up-regulation of only one pathway (PPAR signaling) below the FDR threshold in muscle; however, the expression levels of the genes contributing to the core enrichment of this pathway were 50- to 500-fold lower in muscle compared to IWAT, making the physiological relevance of this observation uncertain. Similarly, only one pathway (pyrimidine metabolism) was significantly down-regulated in MR_Muscle, whereas no pathways satisfied the FDR threshold for CR_Muscle. A summary of the unique and common pathway enrichments observed across the diets and tissues (FDR<30%) is shown via heatmap in Fig. 2. Data on the top 20 putatively enriched pathways in each tissue and for each treatment are shown in Ancillary Table A2 (http://www.pbrc.edu/docs/AncillaryTable2.xlsx).
Figure 2.
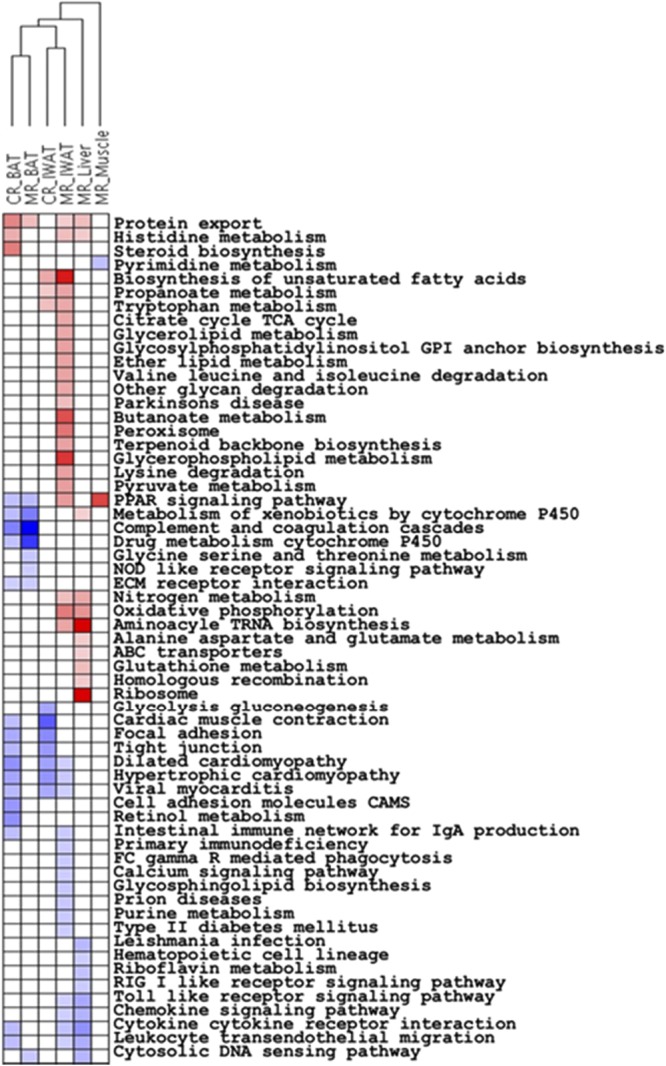
Two-way hierarchical clustering of treatments vs. KEGG pathways. Pathway enrichment was determined by GSEA, and pathways with ≤30% FDR were included. Pathways are colored according to whether they were down-regulated (blue), up-regulated (red), or unchanged (white) in the treated groups (MR, CR) compared to control.
Identification of gene coexpression networks
We next determined whether a subset of the GSEA-identified pathways was also enriched for genes that displayed significantly correlated expression patterns across the samples, leading to the construction of gene coexpression networks. Using the FunNet tool, we measured the transcriptional interaction between overrepresented KEGG pathways (FDR≤5%), based on the similarity of the expression profiles of their component genes (absolute Pearson correlation ≥0.8; ref. 29). These measurements led to the generation of transcriptome interaction networks. The coexpression network was clustered further, which led to the identification of subnetworks (modules) of higher intramodule coexpressivity. These modules are shown for MR_IWAT (Fig. 3A) and for CR_IWAT (Fig. 3B). Consistent with the findings from GSEA, the majority of the coexpression modules consisted of genes down-regulated in response to MR or CR. For MR, we identified 4 separate modules, 2 of which consisted entirely of down-regulated genes (modules 1, 2), while the other 2 contained only one up-regulated module in each of them (modules 3, 4). Module 1 contained pathways related to inflammatory response, cell migration, and cell communication (nodes connected by solid lines showing higher correlations than those connected by dashed lines). Module 2 consisted of only 4 nodes and also consisted of pathways related to inflammatory response and cell adhesion. Module 3 consisted of 3 nodes and was derived from the negative correlation of gene expression between the fatty acid biosynthesis pathway (up-regulated) and pathways related to innate immunity (down-regulated). Module 4 was the most heterogeneous and consisted of an up-regulated node containing genes from several metabolic pathways and several down-regulated nodes representing pathways related to muscle function and inflammatory response (Fig. 3A). In contrast, the coexpression network derived from CR_IWAT was sparser and did not yield significant subnetworks on clustering (Fig. 3B). Also, the strength of the coexpression was generally weaker compared to MR_IWAT, as evidenced by the predominance of dashed edges connecting the nodes. Up-regulation of fatty acid metabolism and metabolic pathways was noted in CR_IWAT (similar to MR), and the pyruvate metabolism pathway was also up-regulated in CR_IWAT. The majority of pathways down-regulated by CR in IWAT (regulation of actin cytoskeleton, tight junction, focal adhesion, etc.) were related to cytoskeletal organization involving gene families such as myosins, collagens, integrins, etc. Again, no coexpression modules involving inflammatory pathways were observed in CR_IWAT. Additional coexpression networks for liver and BAT from the MR and CR groups are shown in Ancillary Fig. A1 (http://www.pbrc.edu/docs/AncillaryFigure1.xlsx).
Figure 3.

KEGG functional profiles and interaction modules, illustrating transcriptomic interactions in IWAT from MR group (A) and CR group (B) animals. Functional themes, represented by the differentially expressed gene-enriched KEGG pathways, were correlated in a proximity interaction network driven by the expression similarity of their annotated genes. KEGG categories are indicated by nodes, and the strength of the proximity between nodes is depicted by the edges in the correlation network. Nodes are colored red or green to represent overall up- or down-regulation, respectively, of the transcripts underlying the nodes. Edges represented by solid lines indicate stronger proximities compared to dashed lines. The network was further clustered to identify topologically proximal transcriptional nodes based on the number of common coexpressed transcripts shared by the nodes.
Analysis of functional networks
We next extended the analysis beyond gene coexpression and related the observed gene expression patterns against other topological properties relevant to gene function. Specifically, we mapped the differentially expressed genes in each tissue to preexisting FINs to determine whether a subset of the differentially expressed genes shared topological relationships with other genes. We clustered the significant FINs to identify subnetworks and investigated whether such topologically determined subnetworks were further enriched in biological processes. The FINs generated from the differentially expressed genes in MR_IWAT, CR_IWAT, and MR_Liver are shown in Fig. 4 (results for other treatments are present in Ancillary Fig. A2; http://www.pbrc.edu/docs/AncillaryFigure2.xlsx). Since the networks are derived from differentially expressed genes, these can be thought of as FINs that are affected by the transcriptomic response to MR and CR. Results from the MR_IWAT samples show that the majority of the observed networks are composed of down-regulated genes (Fig. 4A). Network clustering (≥5 genes/cluster) resulted in 8 clusters. These clusters were significantly enriched for various biological processes (Ancillary Table A3 lists the KEGG pathway terms that were significantly enriched in clusters of CR_IWAT, MR_IWAT, and MR_Liver FINs at FDR<0.001; http://www.pbrc.edu/docs/AncillaryTable3.xlsx). For example, cluster 4 of the MR_IWAT FIN (Fig. 4A, highlighted with red box) was composed of chemokine genes (e.g., CCR5, CCR1, CCR2, CCL7, CCL27) and consequently showed enrichment for the KEGG pathway term chemokine signaling. The main interactions in this cluster consisted of ligand-receptor interactions among the chemokines required for their activation (e.g., associations between CCR5 to multiple partners such as CCL2, CCL27, and CCL7). Additional types of interactions were also predicted (e.g., CCR2–CCR5 interaction from human interactome, CCL2–CD300A interaction via gene coexpression, CCL2–CCL7 interaction between Pfam protein domains, etc.). When the same analysis was conducted on CR_IWAT samples (Fig. 4B), the resulting network was much smaller due to the smaller number of differentially expressed genes resulting from this treatment. This network was dominated by a group of genes that play important roles in cytoskeletal matrix organization (nebulin, desmin, and isoforms of myosin and troponin) and driven mostly by complex formation among the various components. Together, these results show that the effects of CR and MR on the underlying functional and coexpression networks in IWAT are quite distinct and result in very different biological outcomes. Finally, functional network analysis in MR_Liver showed a more equitable distribution of up-regulated and down-regulated genes among the various clusters, with the exception of one (Fig. 4C). This cluster consisted entirely of up-regulated genes corresponding to multiple isoforms of ribosomal proteins. The coordinate expression of ribosomal proteins is well documented (30) and is driven by a unified control mechanism for gene expression (31). The identification of the ribosomal gene cluster as an up-regulated functional network in MR_Liver again matches the earlier observed coexpression of these genes under the same treatment.
Figure 4.

Functional network analysis on differentially expressed genes. Differentially expressed genes were mapped to preexisting interaction networks to generate subnetworks via the ReactomFI plug-in in Cytoscape. Down-regulated nodes (genes) are shown in green, up-regulated nodes in red. Edges are represented variously (arrow, solid line, dashed line) to depict different types of interactions among the nodes. Subnetworks were further clustered to identify substructures. Clustered subnetworks are represented in a circular layout to better visualize the individual clusters and the relationships between clusters. Identities of all genes comprising all clusters are detailed in Ancillary Table A3 (http://www.pbrc.edu/docs/AncillaryTable3.xlsx). A) Network derived from IWAT in MR animals. From the 8 clusters containing ≥5 genes, the cluster enriched in MR down-regulated chemokine genes are highlighted by the red box. Individual components of the chemokine cluster are shown in expanded view. B) Network derived from IWAT in CR animals, showing a highly interconnected module of structural genes. C) Network clusters derived from liver in MR animals. Network clustering identified a distinct MR up-regulated module consisting of ribosomal genes (red box). Gene contents of this module are shown in expanded view.
Comparative analysis of gene set enrichment outcomes
Based on the results obtained from the 3 separate approaches to pathway identification (gene set enrichment via GSEA, gene coexpression via FunNet, and functionally interacting networks via ReactomeFI), we next conducted a comparative analysis to identify pathways that were implicated by two or more approaches (multidimensional pathways). These pathways are of special interest because they not only represent differentially expressed genes but such genes that also have shared expression patterns and/or are known to functionally interact with each other. A progressively stringent FDR threshold was imposed to identify pathways with the strongest evidence for multidimensionality. Thus, the initial analysis in GSEA was conducted at FDR ≤ 0.30. Subsequent gene coexpression networks were built with pathways with an enrichment FDR ≤ 0.05 and absolute correlation of expression ≥0.8. For analysis of FINs, the FDR threshold for pathway enrichment was further reduced to ≤0.001 so as to only include network clusters with the strongest evidence of pathway enrichment. The results of the comparative analysis are shown in Table 2 and elucidate both common and unique tissue and treatment-specific responses. For example, the fatty acid biosynthetic pathway is up-regulated in both CR- and MR-treated IWAT samples and identified by both GSEA and FunNet. Whereas various pathways converging on a down-regulation of immune-inflammatory pathways are enriched in MR_IWAT, however, some of which are identified in all three approaches, these pathways do not change in CR_IWAT. Instead a set of pathways related to cytoskeletal organization of the cellular matrix appear to be down-regulated in IWAT in response to CR and are identified in all 3 approaches. Again while no substantive transcriptomic effects of CR were observed in the liver, MR displayed a robust increase in ribosomal synthetic processes in all three approaches. MR induced a similar down-regulation of immune-inflammatory signaling pathways in the liver as in IWAT, of which the Toll-like receptor signaling pathway was validated in all three approaches. For BAT, the effects of CR and MR appear to be more similar with a down-regulation of pathways related to complement/coagulation cascade, PPAR signaling, and xenobiotic metabolism observed in both treatments. Although the expression of complement-related genes in BAT may be surprising, a recent report found a 4.5-fold overexpression of the complement gene C4A/B in human BAT compared to WAT (32). Also, the core enrichment of the pathway related to xenobiotic mechanism is largely driven by a set of glutathione-S-transferase isoforms (Mgst3, Gsto2, Gstm1, Gstm2), which suggests that this set of genes may be responding to changes in oxidation status in the BAT in response to the diets (33, 34). Due to the small structure of the FINs in BAT, no pathway enrichment analysis could be conducted. Skeletal muscle was not included in the analysis since no reliable coexpression networks or FINs could be constructed with its transcriptome.
Table 2.
Comparative analysis of enrichment of KEGG pathways based on GSEA, gene coexpression (FunNet), and functional interaction networks (ReactomeFI)
| Treatment | Gene set | Status | Ranked list (GSEA) | Coexpression (FunNet) | Interactome (ReactomeFI) |
|---|---|---|---|---|---|
| CR_IWAT | Fatty acid biosynthesis | Up in CR | Yes | Yes | |
| Pyruvate metabolism | Up in CR | Yes | Yes | ||
| Cytoskeletal organization related | Down in CR | ||||
| Regulation of actin cytoskeleton | Yes | Yes | Yes | ||
| Focal adhesion | Yes | Yes | Yes | ||
| Hypertrophic cardiomyopathy | Yes | Yes | Yes | ||
| Cardiac muscle contraction | Yes | Yes | Yes | ||
| Dilated cardiomyopathy | Yes | Yes | Yes | ||
| MR_IWAT | Fatty acid biosynthesis | Up in MR | Yes | Yes | |
| Immune-inflammation signaling | Down in MR | ||||
| Chemokine signaling | Yes | Yes | Yes | ||
| Cytokine-cytokine receptor interaction | Yes | Yes | Yes | ||
| Leukocyte transendothelial migration | Yes | Yes | |||
| Intestinal immune network for IgA production | Yes | Yes | |||
| Focal adhesion | Down in MR | Yes | Yes | Yes | |
| Glycosaminoglycan biosynthesis | Down in MR | Yes | Yes | ||
| CR_Liver | No significant hits, very high FDR | ||||
| Liver_MR | Ribosome | Up in MR | Yes | Yes | Yes |
| Immune-inflammation signaling | Down in MR | ||||
| Toll-like receptor signaling | Yes | Yes | Yes | ||
| Leukocyte transendothelial migration | Yes | Yes | |||
| Chemokine signaling | Yes | Yes | Yes | ||
| CR_BAT | Steroid biosynthesis | Up in CR | Yes | Yes | NA |
| Complement and coagulation cascade | Down in CR | Yes | Yes | ||
| Retinol metabolism | Down in CR | Yes | Yes | ||
| PPAR signalling | Down in CR | Yes | Yes | ||
| Xenobiotic metabolism | Down in CR | Yes | Yes | ||
| MR_BAT | Complement and coagulation cascades | Down in MR | Yes | Yes | NA |
| PPAR signaling | Down in MR | Yes | Yes | ||
| Xenobiotic metabolism | Down in MR | Yes | Yes |
For each approach, pathways are selected based on FDR (FDR≤0.30 for GSEA, ≤0.05 for FunNet, and ≤0.0001 for ReactomeFI). Pathways that are identified in ≥2 approaches are shown. Due to the small number of genes in the BAT Reactome FI networks, no pathway enrichment was conducted on them.
Analysis of inflammatory pathways
Analysis of biofunctions in IPA demonstrated significant down-regulation of a large number of biofunctions in the MR-treated IWAT, followed by MR-treated liver. For this analysis, a biofunction was considered to be significantly activated or inhibited based on a z score ≥ 2.0 or ≤–2.0, respectively. The full list of significantly activated or inhibited biofunctions (defined as having an absolute z score ≥2) across all comparisons is shown in Ancillary Table A4 (http://www.pbrc.edu/docs/AncillaryTable4.xlsx). From this table, the top-level biofunction inflammatory response was found to be significantly down-regulated in MR-treated IWAT and liver samples (minimum P=5.46E-19 and 1.11E-08, respectively) consistent with the observations made in the previously described analyses (FunNet and IGSEA). To gain additional insights into the down-regulation of the inflammatory response biofunction, we next interrogated the activation or inhibition status of its different subfunctions in response to CR or MR in the different tissues. Functions with an absolute z-score ≥ 2 (IPA threshold for predicted activation/inhibition) were selected for each comparison and subjected to 2-way hierarchical clustering. The results are shown in Fig. 5A. In agreement with earlier observations, the number of down-regulated subfunctions was significantly greater in MR_IWAT compared to any other treatments. Conversely, no inflammation-related subfunction was found to be significantly enriched in CR_IWAT, CR_BAT, MR_Muscle, or CR_Muscle samples. In MR_IWAT, the strongest enrichment for down-regulated genes was observed in the subfunctions related to chemotaxis, adhesion, and phagocytosis, as noted from the intensity of the color map (z score <−4). However, since several of the subfunctions were likely to overlap due to similarity in their gene content, we next clustered the subfunctions based on the identities of the differentially expressed genes contained in each of them. The analysis was restricted to a total of 30 subfunctions, each containing 20–200 genes. The resulting dendrogram (Fig. 5B) was color coded to clearly delineate the top clusters and identify the key driver mechanisms that underlie the significantly down-regulated inflammation subfunctions in MR_IWAT. For example, separate clusters were observed for processes leading to activation of immune cells (red), chemotaxis of myeloid cells, neutrophils and phagocytes (magenta), and phagocytosis (light green), to name a few. Notably, the subfunction inflammatory response (same name as the top-level function) formed a distinct branch on the cluster dendrogram, which suggests additional functions beyond those related to immune cell movements. Next, we investigated the distribution of genes across the significant subfunctions to identify genes that could potentially influence multiple functions. The complete data on gene-function membership are present in Ancillary Table A5 (http://www.pbrc.edu/docs/AncillaryTable5.xlsx). Genes that were present in ≥20 of the 30 subfunctions in MR_IWAT are shown in Fig. 5C. In this category, 17 genes were identified, including multiple genes of the chemokine class (CXCL10, CCL13, CCR2) and integrins (ITGAM, ITGB2).
Figure 5.

Two-way clustering of the subcategories of the inflammatory response biofunction in MR- and CR-treated samples. A) Inflammatory response subfunctions with absolute z score ≥ 2.0 in ≥1 treatment and containing 20–200 genes were considered for clustering. Treatments are clustered in columns and functions clustered in rows. Activation or inhibition of a function is shown in shades of red and green, respectively (based on z scores in IPA). Black indicates the absence of a function from a comparison. No biofunction subcategory was found to pass the filter for CR-treated BAT, IWAT, muscle or MR-treated muscle samples. B) Clustering of inflammation-related subfunctions (20–200 genes) in MR-treated IWAT, based on the similarity in their gene contents. Clusters are differentially colored; number of differentially expressed genes in each subfunction is indicated in parentheses. C) Distribution of the most frequently occurring genes across the inflammation subfunctions. Genes present in ≥20 subfunctions are shown in columns and subfunctions in rows. Red indicates presence and blue indicates absence of a gene subfunction.
Analysis of upstream regulators
We conducted an exploratory analysis to determine possible upstream regulators whose activation/inhibition could explain the observed transcriptomic responses to MR or CR in the different tissues. We restricted the analysis to transcription factors (TFs) that influence the transcription of 20–200 target genes and were predicted by IPA to be significantly activated or inhibited. A 2-way hierarchical clustering was conducted to cluster treatments with TFs, and the results were visualized through a heatmap (Fig. 6A). As expected, the largest set of predicted activation/inhibition of TFs occurred in the MR_IWAT treatment, which also contained the largest number of differentially expressed genes. One of the TFs predicted to be strongly down-regulated in MR_IWAT was STAT3 (overlap P 1.04E-11, z score −4.483). Due to the reported involvement of STAT3 in adipose tissue biology and its effects on body weight and adiposity (35, 36), we examined the predicted inhibition of STAT3 in additional detail by interrogating the expression pattern of its target genes in MR_IWAT. Of the 92 gene targets of STAT3, 46 were predicted to be activated, 8 predicted to be inhibited, and the rest had no reliable information on activation status (based on published reports). As shown in the log ratio–mean average plot in Fig. 6B, 40 of the 46 STAT3-activated targets were down-regulated and 4 of the 8 STAT3-inhibited targets were up-regulated in MR_IWAT samples. Thus, the evidence is compelling that chronic MR leads to inhibition of STAT3 in IWAT. Although changes in the activation state of a TF do not necessitate a change in its own transcript levels, we did observe a modest and marginally significant down-regulation of STAT3 transcript in the MR_IWAT samples (log ratio −0.69, nominal P<0.03).
Figure 6.

Analysis of upstream regulators. A) Two-way hierarchical clustering of treatments and upstream regulators that are predicted to be activated or inhibited. Analysis was restricted to transcription factors that show significant evidence of activation or inhibition (z score ≥2.0 or ≤−2.0, respectively) based on the direction of differential expression of the genes regulated by them. Treatments are clustered in columns and individual regulators in rows. Regulators are colored according to whether they were inhibited (green), activated (red), or unchanged (black). B) Expression of STAT3 target genes in IWAT from MR animals. Average log gene expression is plotted on the x axis and log fold change (MR/control) is plotted on the y axis. Genes in red are predicted to be activated and those in blue to be inhibited by STAT3. Open circles represent genes for which reliable evidence for activation/inhibition is not available in the IPA knowledge base.
DISCUSSION
In this work, we have attempted to present an integrated view of the transcriptomic response in key metabolic tissues in rats chronically exposed to CR or MR over a period of 20 mo. The overall computational strategy employed in our study involved the interrogation of various gene annotation resources and analysis of the relationships among genes at gradually increasing levels of complexity. This approach consisted of first interrogating the transcriptome at the individual gene level to identify broad differences in treatment responses between the diets and different tissues. The second level of analysis extended these findings to the level of gene sets (KEGG pathways) and sought to identify condition-specific changes in pathway transcriptomes. At the next level, we interrogated the extent of correlation among the genes that constitute these pathways and generated tissue- and treatment-specific gene and pathway coexpression networks. The analysis was next extended beyond the coexpression networks to interrogate the wider interactome, involving functional interactions among genes (protein–protein interaction, reaction complex formation, enzyme-substrate relationships, etc.). Mapping of gene expression patterns to the interactome allowed us to identify functionally interacting network clusters that were highly enriched for differentially expressed genes and provided a way to interpret transcriptomic changes in a mechanistic as well as topological context. While these approaches interrogated the transcriptome at the global level, a parallel analysis was focused on further refining the observed anti-inflammatory transcriptome by identifying the inflammation subcategories affected by the treatments and predicting activation or inhibition of upstream transcription factors that could explain the observed transcriptomic changes.
Our study shows that under conditions of extended calorie or methionine restriction, tissues differ dramatically in the extent and nature of their transcriptomic response, with maximal response observed in IWAT and minimal response in skeletal muscle (with respect to the number of regulated genes). Also, MR was more potent than CR in effecting differential gene expression. Some responses were similar between treatments (e.g., up-regulation of unsaturated fatty acid biosynthesis by both CR and MR in IWAT) or tissues (e.g., down-regulation of immune-inflammatory signaling genes in MR_IWAT and MR_Liver). However, the two treatments also elicited transcriptionally unique responses in the same tissue (e.g., the differential down-regulation of cytoskeletal matrix organization and immune-inflammatory signaling genes in CR_IWAT and MR_IWAT, respectively, and the unique up-regulation of ribosomal protein encoding gene expression specifically in MR_Liver). Further investigations into candidate upstream regulators responsible for the observed reduction in proinflammatory gene signaling in MR_IWAT identified the STAT3 transcription factor as a strong candidate. STAT3 is generally considered as a proinflammatory transcription factor in multiple disorders, notably cancers and neurological diseases (37–39). Conversely, inhibition of STAT3 has also been associated with reduction of inflammation in a mouse model of obesity-associated arthritis (40), and STAT3 inhibition has been proposed as an attractive anti-inflammatory therapeutic target in obesity-related gastrointestinal malignancies (41). Furthermore, leptin-induced activation of STAT3 has been linked to increased MCP-1 expression in Sca-1+/CD45−/CD34 adipose stem cells treated with leptin (36). Thus, the observed reduction in expression of STAT3 target genes in MR_IWAT may point to one mechanism by which MR reduces inflammatory marker gene expression in IWAT. It is worth noting that dietary MR produces a disproportionate decrease in plasma leptin in adipose tissue, relative to the actual decrease in adiposity (7, 42). As leptin was reported to positively regulate MCP-1 mRNA in mouse adipose mesenchymal stem cells through a STAT3-dependent mechanism (36), it is possible that the MR-dependent decrease in leptin functioned in a paracrine manner to influence this pathway. However, it should be noted that regulation of STAT function in adipose tissue is complex and subject to many additional signaling inputs (43, 44). An additional possibility is that the observed down-regulation of inflammatory signaling gene expression was due to a reduced influx of immune cells (or a change in the composition of immune cells) into adipose tissue of animals on the MR diet. For example, the development of insulin resistance and glucose intolerance during diet-induced obesity is associated with increased proinflammatory T-cell accumulation within visceral adipose tissue (45). This is noteworthy because loss-of-function approaches implicate STAT3 in the process, and its absence results in a reversal of diet-induced insulin resistance and suppression of adipose tissue inflammation (45). Thus, although the computational tools described herein do not allow us to probe these possibilities in depth, they do provide a snapshot of the biology of the systems being affected by dietary MR across multiple tissues. The analyses also provide an organized conceptual framework for generating predictive hypotheses and suggesting experiments to test causal mechanisms. An obvious next step would be to test whether the expression of STAT3 in adipose tissue is essential to the anti-inflammation responses to dietary MR in this tissue. Although the present work involves a single time point, our previous work (13) supports the view that the anti-inflammatory effects of MR emerge primarily after chronic, long-term consumption of the diet. By integrating studies of the chronological development of molecular and physiological responses to dietary MR with hypotheses generated from the type of detailed transcriptional analysis described here, a systematic approach to test linkage between the events is possible and guides refinement of experimental approaches to test specific hypotheses in greater detail.
A transcriptional response specifically associated with CR in IWAT was the down-regulation of genes related to cytoskeletal and matrix organization. Specifically, processes such as regulation of actin cytoskeleton and focal adhesion were down-regulated in the CR, but not MR, samples. These changes are indicative of structural remodeling in the IWAT cytoskeleton and are similar to observations made in previous studies involving long-term CR in mice (17). Cytoskeletal remodeling of the adipocyte is normally coupled to differentiation (46–48) and reduction in cytoskeletal tension is deemed sufficient for the up-regulation of adipogenic genes such as peroxisome-proliferator activated receptor γ, lipoprotein lipase, and fatty acid binding protein 4 (49). Chronic reductions in caloric intake may signal a phenotype close to starvation in vivo, which would necessitate the activation of lipid storage in the adipocyte. We postulate that the observed reduction in cytoskeleton-related gene expression may be a transducer of the starvation signal and prepare the adipocyte for lipid accumulation. Consistent with this postulate, genes related to fatty acid biosynthesis were also up-regulated in the CR samples.
Another example of a specific transcriptomic response was the liver-specific induction of genes encoding ribosomal proteins in the MR, but not CR, rats. A similar transcriptomic induction of a smaller set of ribosomal protein encoding genes (L17, L35, S13) has previously been observed in response to amino acid starvation (50). However, it is also very well established that amino acid starvation typically leads to global suppression of protein synthesis through reduced expression of genes encoding translation initiation and elongation factors as well as ribosomal protein synthesis (51, 52). In this context, our observation of increased expression of genes related to ribosome and translation initiation (EIF4B, EIF3C) in methionine-restricted samples appears contradictory. However, earlier perfusion studies employing rat liver have shown that omission of methionine (and tryptophan) results in disaggregation of polysomes and a reduced ability to incorporate amino acids (53), which suggests that methionine is required to promote and maintain ribosome aggregation. Thus deficiencies in methionine may lead to inefficient translation due to lack of functional, fully aggregated ribosomes. In this scenario, the observed increase in translation initiation and ribosomal protein gene expression in MR rats may reflect a compensatory mechanism to counteract the inefficiency of the protein translation machinery.
Overall, our analysis paints a picture of a dynamic transcriptomic landscape primarily involving IWAT and liver. Due to limitations of space, we have not been able to describe all the affected biological functions that were responsive to CR and MR across tissues, but this initial analysis provides a valuable starting point for more in-depth examination of responses of interest. Given that both diets produce comparable increases in longevity, the current analysis provides the tissue-specific transcriptional footprints of each diet and a good starting point for identification of the transcriptional elements within those footprints that are linked to their common phenotypic outcomes. The tables and figures will provide a more comprehensive picture of the genomic effects observed in this study.
Acknowledgments
This work was supported in part by American Diabetes Association (ADA) grant 1–12-BS-58 (T.W.G.), U.S. National Institutes of Health (NIH) grant DK-096311 (T.W.G.), ADA grant 7–13-MI-05 (T.W.G.), NIH grant 1F32DK098918-01 (D.W.), and the Mouse Metabolic Phenotyping Center Consortium (NIH grant U24DK076169). This work also made use of the Genomics and the Cell Biology and Bioimaging core facilities at the Pennington Biomedical Research Center, supported by NIH grants P20-GM103528 (T.W.G.) and P30 DK072476.
The authors acknowledge the excellent technical assistance of Kelly Dille and Mollye Baker, and the clerical support of Cindi Tramonte.
Footnotes
- BAT
- brown adipose tissue
- BRB
- Biometric Research Branch
- CR
- calorie restriction
- FDR
- false discovery rate
- FIN
- functional interaction network
- GO
- Gene Ontology
- GSEA
- gene set enrichment analysis
- IPA
- Ingenuity Pathway Analysis
- IWAT
- inguinal white adipose tissue
- KEGG
- Kyoto Encyclopedia of Genes and Genomes
- MR
- methionine restriction
- ORA
- overrepresentation analysis
- TF
- transcription factor
REFERENCES
- 1. Deyl Z., Juricova M., Stuchlikova E. (1975) The effect of nutritional regimes upon collagen concentration and survival of rats. Adv. Exp. Med. Biol. 53, 359–369 [DOI] [PubMed] [Google Scholar]
- 2. McCay C. M., Crowell M. F., Maynard L. A. (1989) The effect of retarded growth upon the length of life span and upon the ultimate body size. 1935. Nutrition 5, 155–171 [PubMed] [Google Scholar]
- 3. Kemnitz J. W. (2011) Calorie restriction and aging in nonhuman primates. ILAR J. 52, 66–77 [DOI] [PMC free article] [PubMed] [Google Scholar]
- 4. Richie J. P., Jr., Leutzinger Y., Parthasarathy S., Malloy V., Orentreich N., Zimmerman J. A. (1994) Methionine restriction increases blood glutathione and longevity in F344 rats. FASEB J. 8, 1302–1307 [DOI] [PubMed] [Google Scholar]
- 5. Orentreich N., Matias J. R., DeFelice A., Zimmerman J. A. (1993) Low methionine ingestion by rats extends life span. J. Nutr. 123, 269–274 [DOI] [PubMed] [Google Scholar]
- 6. Barzilai N., Gabriely I. (2001) The role of fat depletion in the biological benefits of caloric restriction. J. Nutr. 131, 903S–906S [DOI] [PubMed] [Google Scholar]
- 7. Hasek B. E., Stewart L. K., Henagan T. M., Boudreau A., Lenard N. R., Black C., Shin J., Huypens P., Malloy V., Plaisance E. P., Krajcik R. A., Orentreich N., Gettys T. W. (2010) Dietary methionine restriction enhances metabolic flexibility and increases uncoupled respiration in both fed and fasted states. Am. J. Physiol. Regul. Integr. Comp. Physiol. 299, R728–R739 [DOI] [PMC free article] [PubMed] [Google Scholar]
- 8. Muzumdar R., Allison D. B., Huffman D. M., Ma X., Atzmon G., Einstein F. H., Fishman S., Poduval A. D., McVei T., Keith S. W., Barzilai N. (2008) Visceral adipose tissue modulates mammalian longevity. Aging Cell 7, 438–440 [DOI] [PMC free article] [PubMed] [Google Scholar]
- 9. Huffman D. M., Barzilai N. (2010) Contribution of adipose tissue to health span and longevity. Interdiscip. Top Gerontol. 37, 1–19 [DOI] [PubMed] [Google Scholar]
- 10. Huffman D. M., Barzilai N. (2009) Role of visceral adipose tissue in aging. Biochim. Biophys. Acta. 1790, 1117–1123 [DOI] [PMC free article] [PubMed] [Google Scholar]
- 11. Ye J., Keller J. N. (2010) Regulation of energy metabolism by inflammation: a feedback response in obesity and calorie restriction. Aging 2, 361–368 [DOI] [PMC free article] [PubMed] [Google Scholar]
- 12. Furukawa S., Fujita T., Shimabukuro M., Iwaki M., Yamada Y., Nakajima Y., Nakayama O., Makishima M., Matsuda M., Shimomura I. (2004) Increased oxidative stress in obesity and its impact on metabolic syndrome. J. Clin. Invest. 114, 1752–1761 [DOI] [PMC free article] [PubMed] [Google Scholar]
- 13. Wanders D., Ghosh S., Stone K., Van N.T., Gettys T. W. (2014) Transcriptional impact of dietary methionine restriction on systemic inflammation: Relevance to biomarkers of metabolic disease during aging. Biofactors 40, 13–26 [DOI] [PMC free article] [PubMed] [Google Scholar]
- 14. Hasek B. E., Boudreau A., Shin J., Feng D., Hulver M., Van N., Laque A., Stewart L. K., Stone K., Wanders D., Ghosh S., Pessin J. E., Gettys T. W. (2013) Remodeling the integration of lipid metabolism between liver and adipose tissue by dietary methionine restriction in rats. Diabetes 62, 3362–3372 [DOI] [PMC free article] [PubMed] [Google Scholar]
- 15. Weindruch R., Kayo T., Lee C. K., Prolla T. A. (2001) Microarray profiling of gene expression in aging and its alteration by caloric restriction in mice. J. Nutr. 131, 918S–923S [DOI] [PubMed] [Google Scholar]
- 16. Swindell W. R. (2009) Genes and gene expression modules associated with caloric restriction and aging in the laboratory mouse. BMC Genomics 10, 585. [DOI] [PMC free article] [PubMed] [Google Scholar]
- 17. Higami Y., Barger J. L., Page G. P., Allison D. B., Smith S. R., Prolla T. A., Weindruch R. (2006) Energy restriction lowers the expression of genes linked to inflammation, the cytoskeleton, the extracellular matrix, and angiogenesis in mouse adipose tissue. J. Nutr. 136, 343–352 [DOI] [PubMed] [Google Scholar]
- 18. Simon R., Lam A., Li M. C., Ngan M., Menenzes S., Zhao Y. (2007) Analysis of gene expression data using BRB-ArrayTools. Cancer Inform. 3, 11–17 [PMC free article] [PubMed] [Google Scholar]
- 19. Baldi P., Long A. D. (2001) A Bayesian framework for the analysis of microarray expression data: regularized t-test and statistical inferences of gene changes. Bioinformatics 17, 509–519 [DOI] [PubMed] [Google Scholar]
- 20. Subramanian A., Tamayo P., Mootha V. K., Mukherjee S., Ebert B. L., Gillette M. A., Paulovich A., Pomeroy S. L., Golub T. R., Lander E. S., Mesirov J. P. (2005) Gene set enrichment analysis: a knowledge-based approach for interpreting genome-wide expression profiles. Proc. Natl. Acad. Sci. U.S.A. 102, 15545–15550 [DOI] [PMC free article] [PubMed] [Google Scholar]
- 21. Ogata H., Goto S., Sato K., Fujibuchi W., Bono H., Kanehisa M. (1999) KEGG: Kyoto Encyclopedia of Genes and Genomes. Nucleic Acids Res. 27, 29–34 [DOI] [PMC free article] [PubMed] [Google Scholar]
- 22. Benjamini Y., Hochberg Y. (1995) Controlling the false discovery rate: a practical and powerful approach to multiple testing. J. R. Stat. Soc. 57, 289–300 [Google Scholar]
- 23. Prifti E., Zucker J. D., Clement K., Henegar C. (2010) Interactional and functional centrality in transcriptional co-expression networks. Bioinformatics 26, 3083–3089 [DOI] [PubMed] [Google Scholar]
- 24. Smoot M. E., Ono K., Ruscheinski J., Wang P. L., Ideker T. (2011) Cytoscape 2.8: new features for data integration and network visualization. Bioinformatics 27, 431–432 [DOI] [PMC free article] [PubMed] [Google Scholar]
- 25. Croft D., O'Kelly G., Wu G., Haw R., Gillespie M., Matthews L., Caudy M., Garapati P., Gopinath G., Jassal B., Jupe S., Kalatskaya I., Mahajan S., May B., Ndegwa N., Schmidt E., Shamovsky V., Yung C., Birney E., Hermjakob H., D'Eustachio P., Stein L. (2011) Reactome: a database of reactions, pathways and biological processes. Nucleic Acids Res. 39, D691–D697 [DOI] [PMC free article] [PubMed] [Google Scholar]
- 26. Omodei D., Fontana L. (2011) Calorie restriction and prevention of age-associated chronic disease. FEBS Lett. 585, 1537–1542 [DOI] [PMC free article] [PubMed] [Google Scholar]
- 27. Wu G., Feng X., Stein L. (2010) A human functional protein interaction network and its application to cancer data analysis. Genome Biol. 11, R53. [DOI] [PMC free article] [PubMed] [Google Scholar]
- 28. Newman M. E. (2006) Modularity and community structure in networks. Proc. Natl. Acad. Sci. U. S. A. 103, 8577–8582 [DOI] [PMC free article] [PubMed] [Google Scholar]
- 29. Henegar C., Tordjman J., Achard V., Lacasa D., Cremer I., Guerre-Millo M., Poitou C., Basdevant A., Stich V., Viguerie N., Langin D., Bedossa P., Zucker J. D., Clement K. (2008) Adipose tissue transcriptomic signature highlights the pathological relevance of extracellular matrix in human obesity. Genome Biol. 9, R14. [DOI] [PMC free article] [PubMed] [Google Scholar]
- 30. Ishii K., Washio T., Uechi T., Yoshihama M., Kenmochi N., Tomita M. (2006) Characteristics and clustering of human ribosomal protein genes. BMC Genomics 7, 37. [DOI] [PMC free article] [PubMed] [Google Scholar]
- 31. Mager W. H. (1988) Control of ribosomal protein gene expression. Biochim. Biophys. Acta 949, 1–15 [DOI] [PubMed] [Google Scholar]
- 32. Svensson P. A., Jernas M., Sjoholm K., Hoffmann J. M., Nilsson B. E., Hansson M., Carlsson L. M. (2011) Gene expression in human brown adipose tissue. Int. J. Mol. Med. 27, 227–232 [DOI] [PubMed] [Google Scholar]
- 33. Curtis J. M., Grimsrud P. A., Wright W. S., Xu X., Foncea R. E., Graham D. W., Brestoff J. R., Wiczer B. M., Ilkayeva O., Cianflone K., Muoio D. E., Arriaga E. A., Bernlohr D. A. (2010) Downregulation of adipose glutathione S-transferase A4 leads to increased protein carbonylation, oxidative stress, and mitochondrial dysfunction. Diabetes 59, 1132–1142 [DOI] [PMC free article] [PubMed] [Google Scholar]
- 34. Petrovic V., Buzadzic B., Korac A., Vasilijevic A., Jankovic A., Korac B. (2006) Free radical equilibrium in interscapular brown adipose tissue: relationship between metabolic profile and antioxidative defense. Comp. Biochem. Physiol. C Toxicol. Pharmacol. 142, 60–65 [DOI] [PubMed] [Google Scholar]
- 35. Cernkovich E. R., Deng J., Bond M. C., Combs T. P., Harp J. B. (2008) Adipose-specific disruption of signal transducer and activator of transcription 3 increases body weight and adiposity. Endocrinology 149, 1581–1590 [DOI] [PMC free article] [PubMed] [Google Scholar]
- 36. Zhou Z., Neupane M., Zhou H. R., Wu D., Chang C. C., Moustaid-Moussa N., Claycombe K. J. (2012) Leptin differentially regulate STAT3 activation in ob/ob mouse adipose mesenchymal stem cells. Nutr. Metab. (Lond.) 9, 109. [DOI] [PMC free article] [PubMed] [Google Scholar]
- 37. Aggarwal B. B., Kunnumakkara A. B., Harikumar K. B., Gupta S. R., Tharakan S. T., Koca C., Dey S., Sung B. (2009) Signal transducer and activator of transcription-3, inflammation, and cancer: how intimate is the relationship? Ann. N.Y. Acad. Sci. 1171, 59–76 [DOI] [PMC free article] [PubMed] [Google Scholar]
- 38. Przanowski P., Dabrowski M., Ellert-Miklaszewska A., Kloss M., Mieczkowski J., Kaza B., Ronowicz A., Hu F., Piotrowski A., Kettenmann H., Komorowski J., Kaminska B. (2013) The signal transducers Stat1 and Stat3 and their novel target Jmjd3 drive the expression of inflammatory genes in microglia. J. Mol. Med. (Berl.) 10.1007/s00109-013-1090-5 [DOI] [PMC free article] [PubMed] [Google Scholar]
- 39. Yu H., Pardoll D., Jove R. (2009) STATs in cancer inflammation and immunity: a leading role for STAT3. Nat. Rev. Cancer 9, 798–809 [DOI] [PMC free article] [PubMed] [Google Scholar]
- 40. Jhun J. Y., Moon S. J., Yoon B. Y., Byun J. K., Kim E. K., Yang E. J., Ju J. H., Hong Y. S., Min J. K., Park S. H., Kim H. Y., Cho M. L. (2013) Grape seed proanthocyanidin extract-mediated regulation of STAT3 proteins contributes to treg differentiation and attenuates inflammation in a murine model of obesity-associated arthritis. PLoS ONE 8, e78843. [DOI] [PMC free article] [PubMed] [Google Scholar]
- 41. O'Sullivan K. E., Reynolds J. V., O'Hanlon C., O'Sullivan J. N., Lysaght J. (2013) Could signal transducer and activator of transcription 3 be a therapeutic target in obesity-related gastrointestinal malignancy? [E-pub ahead of print] J. Gastrointest. Cancer PMID: 24163144 [DOI] [PubMed] [Google Scholar]
- 42. Malloy V. L., Krajcik R. A., Bailey S. J., Hristopoulos G., Plummer J. D., Orentreich N. (2006) Methionine restriction decreases visceral fat mass and preserves insulin action in aging male Fischer 344 rats independent of energy restriction. Aging Cell 5, 305–314 [DOI] [PubMed] [Google Scholar]
- 43. Stewart W. C., Morrison R. F., Young S. L., Stephens J. M. (1999) Regulation of signal transducers and activators of transcription (STATS) by effectors of adipogenesis: coordinate regulation of STATs 1, 5A, and 5B with peroxisome proliferator-activated receptor-γ and C/AAAT enhancer binding protein-α. Biochim. Biophys. Acta. 1452, 188–196 [DOI] [PubMed] [Google Scholar]
- 44. Richard A. J., Stephens J. M. (2014) The role of JAK-STAT signaling in adipose tissue function. Biochim. Biophys Acta. 1842, 431–439 [DOI] [PMC free article] [PubMed] [Google Scholar]
- 45. Priceman S. J., Kujawski M., Shen S., Cherryholmes G. A., Lee H., Zhang C., Kruper L., Mortimer J., Jove R., Riggs A. D., Yu H. (2013) Regulation of adipose tissue T cell subsets by Stat3 is crucial for diet-induced obesity and insulin resistance. Proc. Natl. Acad. Sci. U. S. A. 110, 13079–13084 [DOI] [PMC free article] [PubMed] [Google Scholar]
- 46. Kawaguchi N., Sundberg C., Kveiborg M., Moghadaszadeh B., Asmar M., Dietrich N., Thodeti C. K., Nielsen F. C., Moller P., Mercurio A. M., Albrechtsen R., Wewer U. M. (2003) ADAM12 induces actin cytoskeleton and extracellular matrix reorganization during early adipocyte differentiation by regulating beta1 integrin function. J. Cell Sci. 116, 3893–3904 [DOI] [PubMed] [Google Scholar]
- 47. Huang H. Y., Hu L. L., Song T. J., Li X., He Q., Sun X., Li Y. M., Lu H. J., Yang P. Y., Tang Q. Q. (2011) Involvement of cytoskeleton-associated proteins in the commitment of C3H10T1/2 pluripotent stem cells to adipocyte lineage induced by BMP2/4. Mol. Cell Proteomics 10, M110.002691. [DOI] [PMC free article] [PubMed] [Google Scholar]
- 48. Yang W., Thein S., Wang X., Bi X., Ericksen R. E., Xu F., Han W. (2014) BSCL2/seipin regulates adipogenesis through actin cytoskeleton remodelling. Hum. Mol. Genet. 23, 502–513 [DOI] [PubMed] [Google Scholar]
- 49. Schiller Z. A., Schiele N. R., Sims J. K., Lee K., Kuo C. K. (2013) Adipogenesis of adipose-derived stem cells may be regulated via the cytoskeleton at physiological oxygen levels in vitro. Stem Cell Res. Ther. 4, 79. [DOI] [PMC free article] [PubMed] [Google Scholar]
- 50. Hitomi Y., Ito A., Naito Y., Yoshida A. (1993) Liver-specific induction of ribosomal protein gene expression by amino acid starvation in rats. Biosci. Biotechnol. Biochem. 57, 1216–1217 [DOI] [PubMed] [Google Scholar]
- 51. Gaccioli F., Huang C. C., Wang C., Bevilacqua E., Franchi-Gazzola R., Gazzola G. C., Bussolati O., Snider M. D., Hatzoglou M. (2006) Amino acid starvation induces the SNAT2 neutral amino acid transporter by a mechanism that involves eukaryotic initiation factor 2alpha phosphorylation and cap-independent translation. J. Biol. Chem. 281, 17929–17940 [DOI] [PubMed] [Google Scholar]
- 52. Kimball S. R. (2002) Regulation of global and specific mRNA translation by amino acids. J. Nutr. 132, 883–886 [DOI] [PubMed] [Google Scholar]
- 53. McGown E., Richardson A. G., Henderson L. M., Swan P. B. (1973) Effect of amino acids on ribosome aggregation and protein synthesis in perfused rat liver. J. Nutr. 103, 109–116 [DOI] [PubMed] [Google Scholar]