

Abstract
Accumulation of the homocysteine (Hcy) precursor S-adenosylhomocysteine (AdoHcy) may cause cellular hypomethylation in the setting of hyperhomocysteinemia because of cystathionine β-synthase (CBS) deficiency, an inborn error of metabolism. To test this hypothesis, DNA and protein arginine methylation status were assessed in liver, brain, heart, and kidney obtained from a previously described mouse model of CBS deficiency. Metabolite levels in tissues and serum were determined by high-performance liquid chromatography or liquid chromatography-electrospray ionization-tandem mass spectrometry. Global DNA and protein arginine methylation status were evaluated as the contents of 5-methyldeoxycytidine in DNA and of methylarginines in proteins, respectively. In addition, histone arginine methylation was assessed by Western blotting. CBS-deficient mice exhibited increased (>6-fold) Hcy and AdoHcy levels in all tissues examined compared with control levels. In addition, global DNA methylation status was not affected, but global protein arginine methylation status was decreased (10–35%) in liver and brain. Moreover, asymmetric dimethylation of arginine 3 on histone H4 (H4R3me2a) content was markedly decreased in liver, and no differences were observed for the other histone arginine methylation marks examined. Our results show that CBS-deficient mice present severe accumulation of tissue Hcy and AdoHcy, protein arginine hypomethylation in liver and brain, and decreased H4R3me2a content in liver. Therefore, protein arginine hypomethylation arises as a potential player in the pathophysiology of CBS deficiency.—Esse, R., Imbard, A., Florindo, C., Gupta, S., Quinlivan, E. P., Davids, M., Teerlink, T., Tavares de Almeida, I., Kruger, W. D., Blom, H. J., Castro, R. Protein arginine hypomethylation in a mouse model of cystathionine β-synthase deficiency.
Keywords: homocystinuria, S-adenosylhomocysteine, H4R3me2a, methylarginines
In mammals, many crucial cell functions rely on methyl transfer reactions. The deposition of methyl groups on substrates such as DNA and proteins is catalyzed by methyltransferases that use S-adenosylmethionine (AdoMet) as the methyl group donor (1). On transfer of the methyl group, AdoMet is converted to S-adenosylhomocysteine (AdoHcy), a potent competitive inhibitor of most methyltransferases. Thus, cellular methylation processes may be regulated by the levels of AdoMet and AdoHcy, and the AdoMet/AdoHcy ratio is often used as an index of cellular methylation capacity (2). On formation, AdoHcy may be hydrolyzed to adenosine and homocysteine (Hcy). Notably, this reaction is reversible, and AdoHcy synthesis is thermodynamically favored over its hydrolysis, but in general the reaction proceeds in the hydrolytic direction because of efficient removal of the products Hcy and adenosine (3). However, if the latter is compromised, AdoHcy may accumulate and induce global cellular hypomethylation via inhibition of methyl transfer reactions (4).
Cystathionine β-synthase (CBS) catalyzes the condensation of Hcy with serine to form cystathionine, a precursor of cysteine. CBS deficiency (MIM 236200) is the most common inborn error of methionine metabolism and is biochemically characterized by marked elevation of plasma total homocysteine (tHcy), or severe hyperhomocysteinemia (HHcy), together with hypermethioninemia and hypocysteinemia (5). The loss of CBS activity leads to a clinical phenotype that includes premature atherosclerosis and thromboembolism, skeletal abnormalities, various neuropsychiatric manifestations, and dislocated lenses by mechanisms that are still poorly understood (6). Accumulation of AdoHcy (5), resulting in a cellular hypomethylating environment, may be involved in the pathophysiology of CBS deficiency (7, 8).
Methylation of DNA, a process catalyzed by AdoMet-dependent DNA methyltransferases (DNMTs), is an epigenetic mechanism that controls gene expression and is vital to cell homeostasis. Consistent with this important role, a growing number of human diseases have been found to be associated with aberrant DNA methylation (9). There are many lines of evidence suggesting that Hcy levels modulate global DNA methylation (10). For example, global hypomethylation of DNA has been observed in atherosclerotic lesions of mice and humans with HHcy (11, 12). In healthy humans, increased levels of plasma Hcy were associated with increased AdoHcy concentrations and DNA hypomethylation in lymphocytes (13, 14). In addition, mice deficient in methylenetetrahydrofolate reductase, an enzyme required for efficient Hcy metabolism, display global DNA hypomethylation in brain and ovaries (15). Nevertheless, the involvement of altered DNA methylation status in CBS deficiency is controversial. For instance, it has been reported that mice heterozygous for CBS deficiency have elevated concentrations of plasma tHcy and hepatic AdoHcy, along with DNA hypomethylation in testis and liver (7, 8), but hypomethylation was not observed in genomic DNA isolated from the blood of patients with CBS deficiency (16).
Unlike DNA methylation, protein methylation status in the context of elevated Hcy and AdoHcy has been poorly studied. Protein methylation is a common post-translational modification that mostly occurs on arginine (17) and lysine (18) residues. Arginine and lysine methylation is catalyzed by AdoMet-dependent protein arginine methyltransferases (PRMTs; ref. 17) and protein lysine methyltransferases (PKMTs; ref. 18), respectively. These enzymes are inhibited by AdoHcy. However, the fact that euchromatic histone lysine methyltransferase 1, one of the most important PKMTs in mammals, has a Michaelis-Menten inhibition constant for AdoHcy (∼5.9 μM) that is higher than that displayed by PRMT1 (∼2.3 μM), the predominant PRMT, suggests that lysine methylation is less prone to inhibition by AdoHcy than arginine methylation (19). Furthermore, PRMTs have broader substrate specificity (20) and are involved in more cellular processes than PKMTs, including RNA processing, transcription control, protein localization, signal transduction, and DNA repair (17). Therefore, arginine methylation may constitute a better target for exploratory studies on the hypomethylation hypothesis than lysine methylation. PRMTs are classified into type I or II enzymes, both catalyzing the formation of NG-monomethylarginine (MMA). The latter may then be converted to asymmetric NG,NG-dimethylarginine (ADMA) by type I PRMTs, whereas type II PRMTs convert MMA to symmetric NG,N′G-dimethylarginine (SDMA). Protein arginine methylation status in biological samples may be evaluated by measuring the amounts of methylarginines (MMA, ADMA, and SDMA) released on protein acid hydrolysis. Using this methodological approach, we previously showed that, in cultured human vascular endothelial cells, AdoHcy accumulation elicits protein arginine hypomethylation to a greater extent than DNA hypomethylation (21) and that, in rats with diet-induced HHcy, protein arginine methylation status is decreased in liver and heart (22). These observations led us to speculate that protein arginine methylation status is decreased in CBS deficiency, a genetic condition in which the levels of circulating tHcy are severely elevated.
In the present study, we used a previously described mouse model of CBS deficiency in which transgenic expression of the I278T mutant human CBS protein rescues the neonatal lethality of Cbs−/−. Transgenic (Tg)-I278T Cbs−/− mice present severe HHcy and characteristics such as osteoporosis and fat loss that resemble to some extent the human CBS deficiency phenotype (23, 24). Here, we have determined whether DNA methylation, global protein arginine methylation, and histone arginine methylation are altered in this animal model of CBS deficiency.
MATERIALS AND METHODS
Mouse model and tissue homogenate preparation
In this study, we used a previously described mouse model of CBS deficiency (24). In brief, Tg C57BL6 strain mice, in which the gene construct harbors the human CBS with the missense mutation 833T>C, were generated. Expression of CBS is under the control of the metallothionein promoter and is stimulated by adding zinc to the drinking water, yielding the mutant I278T human CBS. These animals, termed Tg-I278T Cbs+/+, were then mated to Cbs+/− heterozygotes to obtain Tg-I278T Cbs+/− offspring. Tg-I278T Cbs+/− mice were then given water containing 25 mM zinc sulfate to induce transgene expression and backcrossed a second time to Cbs+/− animals to generate Tg-I278T Cbs−/− mice. The production of the mutant human isoform rescues the neonatal lethality phenotype of Cbs−/−. After weaning, zinc water was replaced by plain water. The animals were fed standard rodent chow (Teklad 2018SX; Harlan Teklad, Madison, WI, USA) ad libitum and euthanized at 50 to 330 d after birth. The brain, liver, heart, and kidney were then extracted and stored at −80°C until further analysis. These studies were approved by the Fox Chase Cancer Center Institutional Animal Care and Use Committee (No. 99-26). A total of 11 Tg-I278T Cbs+/+, 9 Tg-I278T Cbs+/−, and 11 Tg-I278T Cbs−/− mice were used in this study.
Tissue homogenate was prepared on ice in 0.1 N HCl (10 ml/g wet weight of tissue) with an OMNI-2000 homogenizer (Omni 2000; Omni International, Waterbury, CT, USA). Immediately after homogenization, a part of the homogenate was processed for AdoMet and AdoHcy determination as described below. The remainder was aliquoted and stored at −80°C until use.
Tissue and serum tHcy
tHcy refers to the sum total of all forms of Hcy, namely the protein-bound, reduced, and oxidized forms. The procedure for determination of tHcy in serum and tissue homogenates was based on a method described previously (25). In brief, 5 μl of internal standard (20 μM cysteamine) and 5 μl of a 10% (v/v) solution of tri-n-butylphosphine in dimethylformamide were added to 50 μl of sample or standard, and the mixture was incubated at 4°C for 30 min to accomplish reduction of thiol bonds. Subsequently, 25 μl of 20% (w/v) trichloroacetic acid (containing 4 mM EDTA) was added. After centrifugation at 12,000 g and 4°C for 10 min, 50 μl of the clear supernatant was added to a mixture of 10 μl of 1.55 M sodium hydroxide, 50 μl of 0.2 M borate buffer (pH 9.5) containing 8 mM EDTA, and 100 μl of 7-fluorobenzofurazan-4-sulfonic acid solution (1 mg/ml dissolved in borate buffer). The mixture was incubated for 1 h at 60°C, and a 30-μl aliquot was subsequently used for high-performance liquid chromatography (HPLC) analysis. Chromatographic separation of the fluorescent derivatives was performed on a 3-μm Supelco Supercosil LC-18-DB column (100×4.6 mm; Merck, Darmstadt, Germany) protected with a 5-μm Supelco Supelcosil LC-18-DB guard column (20×4.6 mm).
Tissue free methionine
Free methionine in the tissues was determined by HPLC with fluorimetric detection, as described previously (26). In brief, 50 μl of the tissue homogenate (prediluted 4-fold in water) was added to a tube containing 8 mg of sulfosalicylic acid, and the mixture was vortexed thoroughly. After centrifugation at 3500 g and 4°C for 15 min, 5 μl of the supernatant was transferred to a reaction vial containing 70 μl of water, 5 μl of internal standard solution (300 μM), and 90 μl of a derivatization reagent with ortho-phthaldialdehyde (1.77 mM) and 3-mercaptopropionic acid (2.72 mM; pH 10.0). After an incubation step of 3 min, an aliquot (10 μl) of the reaction mixture was injected. Chromatographic separation of the fluorescent derivatives was performed on a 3.5-μm XTerra RP18 column (100×3.9 mm; Waters, Milford, MA, USA) protected with a matching guard column (20×3.9 mm; Waters).
Tissue AdoMet and AdoHcy
For quantification of AdoMet and AdoHcy in the tissue homogenates, each sample was centrifuged at 12,000 g and 4°C for 5 min to remove debris, and the supernatant was promptly diluted 10-fold in 0.1 N HCl on ice to a final volume of 250 μl, followed by deproteinization with 156 μl of 10% (v/v) perchloric acid. After centrifugation for 10 min at 2000 g and 4°C, the supernatant was subjected to a weak anion-exchange solid-phase extraction procedure using an Oasis HLB 3 cc (30 mg) extraction column (Waters) and analyzed by stable-isotope dilution liquid chromatography-tandem mass spectrometry (LC-MS/MS), as described in detail previously (27).
DNA methylation status in tissues
The percentage of 5-methyldeoxycytidine present in genomic DNA was determined by stable-isotope dilution LC-MS/MS, as described previously (28).
Tissue and serum free methylarginines
For quantification of free methylarginines in serum and tissue homogenates, each sample was centrifuged at 12,000 g and 4°C for 5 min to remove debris. The levels of free methylarginines were determined by stable-isotope dilution LC-MS/MS, as described in detail previously (29).
Protein arginine methylation status in tissues
Protein arginine methylation status was evaluated as the ratio of each methylarginine to total arginine (tArg) content in proteins. After centrifugation of the homogenate for 5 min at 12,000 g and 4°C to remove debris, a 50-μl aliquot of the supernatant was mixed with an equal volume of 40% (w/v) trichloroacetic acid. After centrifugation at 4°C and 16,000 g, for 10 min, the supernatant was removed, and the pellet was washed twice with 1 ml of ice-cold acetone and allowed to dry at room temperature. Protein hydrolysis was carried out at 110°C with 6 N HCl for ∼20 h in capped glass vials. The hydrolysates were dried under a gentle stream of nitrogen gas and stored at −20°C until further analysis.
The levels of Arg, MMA, ADMA, and SDMA in the hydrolysates were determined by HPLC with fluorescence detection, as described previously (30, 31). In brief, after sample cleanup by cationic solid-phase extraction (Oasis MCX 1-cc cartridges; Waters), the analytes were derivatized with a reagent containing ortho-phthaldialdehyde (19 mM) and 3-mercaptopropionic acid (29 mM). Chromatographic separation of the fluorescent derivatives was performed on a Chromolith Performance RP-18e column (100×4.6 mm; Merck) protected by a matching guard cartridge (10×4.6 mm; Merck). Homoarginine was used as an internal standard. The levels of MMA, ADMA, and SDMA in tissue protein hydrolysates are expressed as fractions of tArg content.
Histone arginine methylation
Western blotting was performed for the analysis of histone arginine methylation. Histones were extracted from tissues using the EpiSeeker Histone Extraction Kit (Abcam, Cambridge, UK), following the manufacturer's protocol, separated on 15% SDS-polyacrylamide gels, and transferred onto Hybond-P poly(vinylidene difluoride) membranes (GE Healthcare, Chalfont St. Giles, UK). After blocking with Tris-buffered saline (pH 7.4) and 0.1% Tween-20 containing 5% low-fat milk (blocking buffer) for 120 min, the membranes were probed overnight, at 4°C, with the following primary antibodies diluted in blocking buffer: rabbit polyclonal anti-asymmetric dimethylation of arginine 8 on histone H3 (H3R8me2a; 1:1500; Active Motif, Rixensart, Belgium); rabbit polyclonal anti-symmetric dimethylation of arginine 8 on histone H3 (H3R8me2s; 1:1500; Abcam); rabbit polyclonal anti-asymmetric dimethylation of arginine 17 on histone H3 (H3R17me2a; 1:1000; Active Motif, Rixensart, Belgium); rabbit polyclonal anti-asymmetric dimethylation of arginine 3 on histone H4 (H4R3me2a; (1:2000; Active Motif); rabbit polyclonal anti-symmetric dimethylation of arginine 3 on histone H4 (H4R3me2s; 1:1500; Active Motif); mouse monoclonal anti-H4 (1:1000; Abcam); and mouse monoclonal anti-H3 (1:2000; Active Motif). Secondary antibody incubation was performed for 2 h at room temperature with horseradish peroxidase-conjugated anti-rabbit IgG (1:2000; Cell Signaling, Danvers, MA, USA) or anti-mouse IgG (1:4000; Jackson ImmunoResearch, Newmarket, UK). Chemiluminescence was produced by incubating membranes with a developer solution (ECL Plus Western blotting detection system; GE Healthcare), and the signal was detected using either a ChemiDoc System (Bio-Rad Laboratories, Hercules, CA, USA) or X-ray film (Amersham Hyperfilm ECL; GE Healthcare). The signal corresponding to each methylation mark (H3R8me2a, H3R8me2s, H3R17me2a, H4R3me2a, or H4R3me2s) was normalized with that of the corresponding total histone (H4 or H3).
Statistical analysis
Values in text are means ± sd. Differences between 2 groups were analyzed by the Mann-Whitney U test. Statistical significance was accepted at a value of P < 0.05.
RESULTS
Severe accumulation of tissue Hcy and AdoHcy in CBS-deficient mice
Consistent with previous studies (23, 24), the serum levels of tHcy in Tg-I278T Cbs−/− mice (241.0±48.5 μM) were markedly higher (P<0.001) than those in Tg-I278T Cbs+/− (8.1±2.1 μM) and Tg-I278T Cbs+/+ (4.6±0.7 μM) mice. In the present study, the levels of tHcy in several tissues of Tg-I278T Cbs+/+, Tg-I278T Cbs+/−, and Tg-I278T Cbs−/− mice are also reported, along with those of methionine, AdoMet, and AdoHcy (Table 1). The tissue levels of tHcy and AdoHcy in Tg-I278T Cbs−/− mice were ≥15- and 7-fold higher, respectively, than those in Tg-I278T Cbs+/+ mice. AdoMet levels were also raised, except in heart, although more modestly (∼4-fold in liver and 1.6-fold in both brain and kidney). Accordingly, the AdoMet/AdoHcy ratios in all tissues of Tg-I278T Cbs−/− mice were lower than those in Tg-I278T Cbs+/+ animals. Methionine levels were increased in liver and kidney by ∼1.5-fold, but not in brain and heart. Comparison of the tissue levels of these metabolites (Met, tHcy, AdoMet, and AdoHcy) in Tg-I278T Cbs+/− and Tg-I278T Cbs+/+ mice revealed no statistically significant differences between the 2 groups. For this reason, the parameters obtained for Tg-I278T Cbs+/− and Tg-I278T Cbs+/+ mice (controls) were combined for statistical comparison with Tg-I278T Cbs−/− mice (CBS-deficient).
Table 1.
Concentrations of tHcy, methionine, AdoMet, and AdoHcy, and AdoMet/AdoHcy ratios, in liver, brain, heart, and kidney of Tg-I278T Cbs+/+, Tg-I278T Cbs+/−, and Tg-I278T Cbs−/− mice
| Parameter | Tg-I278T Cbs+/+ | Tg-I278T Cbs+/− | Tg-I278T Cbs−/− |
|---|---|---|---|
| n | 9 | 9 | 8 |
| Liver | |||
| tHcy | 1.1 ± 0.9 | 1.0 ± 0.7 | 33.1 ± 11.2*** |
| Methionine | 100.1 ± 31.8 | 100.7 ± 14.2 | 160.3 ± 48.0** |
| AdoMet | 40.1 ± 15.8 | 40.1 ± 20.5 | 176.7 ± 117.2*** |
| AdoHcy | 52.9 ± 19.3 | 67.7 ± 21.0 | 486.2 ± 248.5*** |
| AdoMet/AdoHcy | 0.93 ± 0.61 | 0.76 ± 0.72 | 0.39 ± 0.21* |
| Brain | |||
| tHcy | 0.4 ± 0.2 | 0.4 ± 0.4 | 8.4 ± 2.7*** |
| Methionine | 55.5 ± 35.3 | 60.3 ± 37.1 | 112.2 ± 83.8 |
| AdoMet | 16.8 ± 1.2 | 17.5 ± 2.7 | 25.1 ± 3.7*** |
| AdoHcy | 6.0 ± 1.5 | 6.0 ± 1.4 | 107.9 ± 24.2*** |
| AdoMet/AdoHcy | 3.00 ± 0.97 | 3.08 ± 1.05 | 0.24 ± 0.07*** |
| Heart | |||
| tHcy | 0.4 ± 0.2 | 0.3 ± 0.1 | 6.4 ± 2.1*** |
| Methionine | 63.7 ± 9.3 | 66.7 ± 11.1 | 76.4 ± 29.9 |
| AdoMet | 30.2 ± 4.6 | 31.6 ± 4.3 | 30.8 ± 3.6 |
| AdoHcy | 3.9 ± 0.9 | 4.1 ± 1.0 | 105.4 ± 34.3*** |
| AdoMet/AdoHcy | 8.36 ± 2.78 | 8.19 ± 2.50 | 0.33 ± 0.14*** |
| Kidney | |||
| tHcy | 0.6 ± 0.4 | 0.6 ± 0.4 | 10.3 ± 1.6*** |
| Methionine | 114.8 ± 29.9 | 129.9 ± 43.3 | 171.3 ± 54.9* |
| AdoMet | 28.2 ± 6.8 | 31.7 ± 6.0 | 47.2 ± 14.0** |
| AdoHcy | 19.9 ± 3.6 | 21.0 ± 3.5 | 142.8 ± 39.7*** |
| AdoMet/AdoHcy | 1.47 ± 0.43 | 1.53 ± 0.29 | 0.33 ± 0.05*** |
Values are means ± sd (pmol/mg wet weight of tHcy, methionine, AdoMet, and AdoHcy, and the AdoMet/AdoHcy ratio).
P < 0.05,
P < 0.01,
P < 0.001 vs. Tg-I278T Cbs+/+.
DNA methylation status is not affected in tissues of CBS-deficient mice
The content of 5-methyldeoxycytidine in DNA hydrolysates of CBS-deficient mice did not differ from that in control mice in any of the tissues analyzed (Fig. 1). Therefore, tissue global DNA methylation status is not affected in CBS-deficient mice compared with that in controls.
Figure 1.
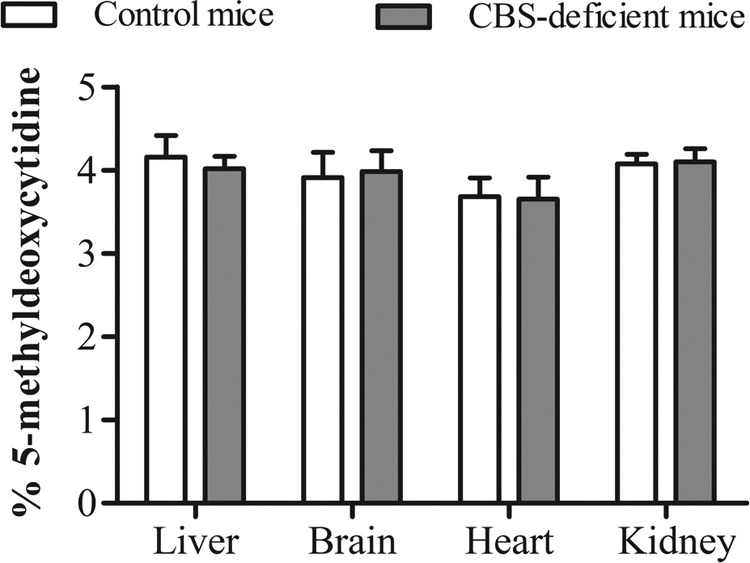
Global DNA methylation status, evaluated as 5-methyldeoxycytidine content in DNA hydrolysates, in liver, brain, heart, and kidney of control (Tg-I278T Cbs+/−) and CBS-deficient (Tg-I278T Cbs−/−) mice. Values are means ± sd of 6 control mice and 6 CBS-deficient mice. No statistically significant differences were observed.
Increased levels of free ADMA and MMA in serum of CBS-deficient mice
We also measured the levels of free methylarginines (MMA, ADMA, and SDMA) in tissues and serum of CBS-deficient and control mice (Table 2). Neither free ADMA nor free SDMA concentrations in tissues differed between the 2 groups. However, free MMA levels in heart of CBS-deficient mice were on average 33% higher than those in controls. Free ADMA and MMA concentrations in serum of CBS-deficient mice were on average 21 and 58% and higher than those in controls, respectively, whereas those of free SDMA did not differ.
Table 2.
Levels of free ADMA, SDMA, and MMA in liver, brain, heart, kidney, and serum of control (Tg-I278T Cbs+/+ and Tg-I278T Cbs+/−) and CBS-deficient (Tg-I278T Cbs−/−) mice
| Parameter | Control | CBS-deficient |
|---|---|---|
| n | 18 | 8 |
| Liver (pmol/mg wet weight) | ||
| ADMA | 2.21 ± 1.05 | 2.01 ± 0.44 |
| SDMA | 0.43 ± 0.08 | 0.37 ± 0.07 |
| MMA | 0.65 ± 0.22 | 0.80 ± 0.11 |
| Brain (pmol/mg wet weight) | ||
| ADMA | 0.34 ± 0.09 | 0.40 ± 0.13 |
| SDMA | 0.37 ± 0.05 | 0.36 ± 0.07 |
| MMA | 0.28 ± 0.10 | 0.30 ± 0.12 |
| Heart (pmol/mg wet weight) | ||
| ADMA | 1.61 ± 0.23 | 1.79 ± 0.50 |
| SDMA | 0.23 ± 0.05 | 0.24 ± 0.10 |
| MMA | 0.52 ± 0.05 | 0.69 ± 0.10*** |
| Kidney (pmol/mg wet weight) | ||
| ADMA | 3.07 ± 1.27 | 3.03 ± 1.24 |
| SDMA | 0.67 ± 0.20 | 0.53 ± 0.18 |
| MMA | 0.61 ± 0.22 | 0.62 ± 0.21 |
| Serum (μM) | ||
| ADMA | 1.09 ± 0.18 | 1.32 ± 0.19** |
| SDMA | 0.28 ± 0.04 | 0.30 ± 0.05 |
| MMA | 0.35 ± 0.05 | 0.54 ± 0.09*** |
Data are means ± sd.
P < 0.01,
P < 0.001 vs. control mice.
Protein arginine methylation status is decreased in liver and brain of CBS-deficient mice
Protein arginine methylation status was assessed by determining the levels of protein-incorporated ADMA, SDMA, and MMA in tissues of CBS-deficient and control mice (Table 3). CBS-deficient mice had on average 9 and 7% lower levels of protein-incorporated ADMA and SDMA in liver than controls. The mean levels of protein-incorporated MMA, ADMA, and SDMA in brain of CBS-deficient mice were, respectively 17, 7, and 35% lower than those in control mice. The levels of protein-incorporated methylarginines in heart and kidney were similar between CBS-deficient and control mice. These results indicate a reduction in the extent of protein arginine methylation in liver and brain of CBS-deficient mice compared with that in controls, but not in heart and kidney.
Table 3.
Levels of protein-incorporated ADMA, SDMA, and MMA in liver, brain, heart, and kidney of control (Tg-I278T Cbs+/+ and Tg-I278T Cbs+/−) and CBS-deficient (Tg-I278T Cbs−/−) mice
| Parameter | Control | CBS-deficient |
|---|---|---|
| n | 18 | 8 |
| Liver (×103) | ||
| ADMA/tArg | 4.43 ± 0.30 | 4.04 ± 0.23** |
| SDMA/tArg | 0.61 ± 0.04 | 0.57 ± 0.03* |
| MMA/tArg | 0.50 ± 0.05 | 0.52 ± 0.06 |
| Brain (×103) | ||
| ADMA/tArg | 7.06 ± 0.36 | 6.56 ± 0.44** |
| SDMA/tArg | 1.90 ± 0.29 | 1.24 ± 0.19*** |
| MMA/tArg | 3.88 ± 0.56 | 3.24 ± 0.53* |
| Heart (×103) | ||
| ADMA/tArg | 1.64 ± 0.26 | 1.60 ± 0.07 |
| SDMA/tArg | 0.31 ± 0.06 | 0.30 ± 0.02 |
| MMA/tArg | 0.29 ± 0.03 | 0.30 ± 0.02 |
| Kidney (×103) | ||
| ADMA/tArg | 4.65 ± 0,20 | 4.59 ± 0.30 |
| SDMA/tArg | 0.73 ± 0.10 | 0.72 ± 0.04 |
| MMA/tArg | 0.54 ± 0.11 | 0.53 ± 0.07 |
Data are means ± sd.
P < 0.05,
P < 0.01,
P < 0.001 vs. control mice.
Decreased asymmetric dimethylation of arginine 3 on histone H4 in liver of CBS-deficient mice
We hypothesized that in our model of CBS deficiency histone arginine methylation is impaired because of AdoHcy-mediated inhibition of histone arginine methyltransferase activity. Based on the commercial availability of the antibodies, we selected 5 histone arginine methylation marks, namely: H3R8me2a and H3R8me2s; H3R17me2a; and H4R3me2a and H4R3me2s. The degree of each of these marks was assessed in liver and brain samples by Western blotting (Fig. 2). The rationale for selecting only brain and liver for this study was based on our observation that protein arginine methylation status in CBS-deficient mice is decreased in these tissues, but not in heart and kidney (Table 3). H3R17me2a content in brain was not measurable. In CBS-deficient mice, the content of the H4R3me2a mark in liver was ∼10% of that in controls, and similar levels were observed in brain. No further differences between CBS-deficient and control mice were found for the other histone arginine methylation marks analyzed.
Figure 2.

Histone arginine methylation status in CBS-deficient mice (Tg-I278T Cbs−/−) compared with that in control mice (Tg-I278T Cbs+/+). Top panel: degrees of methylation of several arginine residues on histones H3 and H4 in liver and brain of CBS-deficient and control mice were determined by Western blotting using specific antibodies (anti-H3R8me2a, anti-H3R8me2s, anti-H3R17me2a, anti-H4R3me2a, anti-H4R3me2s, anti-H3, and anti-H4). Signal corresponding to each histone arginine methylation mark was normalized with that of the total histone (H3 or H4). Densitometry was performed on bands corresponding to 3−11 samples. Average methylation degree for each residue in control mice was considered to be 1. Degree of the H3R17me2a mark in brain was not measurable. Data for CBS-deficient mice are means ± sd. ***P < 0.001 vs. control mice. Bottom panel: Representative blot of H4R3me2a and of total H4 in liver of control and CBS-deficient mice.
DISCUSSION
Enzymatic methylation of biological substrates such as DNA and proteins is a crucial event that is involved in the regulation of gene expression, protein function, signal transduction pathways, and other important processes in mammals. AdoHcy, which is severely elevated in CBS deficiency (5, 7, 8), inhibits the activity of AdoMet-dependent methyltransferases. These include DNMTs and PRMTs, which transfer methyl groups from AdoMet to DNA and arginine residues in proteins, respectively (32). Therefore, we hypothesized that, in CBS deficiency, accumulation of AdoHcy causes DNA and protein arginine hypomethylation. In this study, we aimed to ascertain whether the methylation status of DNA and of arginine residues in proteins obtained from brain, liver, heart, and kidney of a previously described mouse model of CBS deficiency (24) is decreased. Notably, in contrast with previous mice studies (7, 8) but in line with the human study conducted by Heil et al. (16), we observed no changes in global DNA methylation in any of the tissues analyzed. Thus, our data argue against the presence of global DNA hypomethylation in CBS deficiency. Liver and brain obtained from CBS-deficient animals exhibited protein arginine hypomethylation compared with controls. We also assessed several histone arginine methylation marks and found that H4R3me2a content in liver of CBS-deficient mice is lower than that in control mice. Taken together, our results suggest that hypomethylation of arginine residues in proteins, including histones, may contribute to the pathophysiology of CBS deficiency.
In this study, we used a previously described transgenic mouse model of CBS deficiency in which zinc-inducible expression of the I278T mutant human CBS during weaning rescues the neonatal lethality of the Cbs−/− genotype (24). In other attempts to model CBS deficiency, Cbs−/− mice died soon after birth, and researchers used Cbs+/− mice to model CBS deficiency (33). In our hands and in line with previous reports (23, 24), the levels of tHcy in serum of Tg-I278T Cbs−/− mice were ∼50-fold higher than in Tg-I278T Cbs+/+ mice. The levels of tHcy in several tissues (liver, brain, heart, and kidney) of Tg-I278T Cbs−/− mice were ≥15-fold greater than those in Tg-I278T Cbs+/+ mice (Table 1). Intriguingly, CBS is thought not to be expressed in heart (3), suggesting that Hcy taken up from blood contributes to the high amount of tHcy measured in heart of Tg-I278T Cbs−/− mice.
The higher methionine and AdoMet concentrations found in tissues of Tg-I278T Cbs−/− mice, compared with those of Tg-I278T Cbs+/+ mice (Table 1), indicate that part of the Hcy that accumulates due to blockage of the transsulfuration pathway is taken up by the Hcy remethylation pathways. In addition, Tg-I278T Cbs−/− mice had severe elevation of AdoHcy in all tissues examined, and AdoMet/AdoHcy ratios in these animals were decreased in all tissues compared with those of Tg-I278T Cbs+/+ mice. The concentrations of tissue tHcy, methionine, AdoMet, and AdoHcy were similar between Tg-I278T Cbs+/− and Tg-I278T Cbs+/+ mice. For this reason, all these mice were considered as controls in the subsequent statistical comparisons with I278T Cbs−/− (CBS-deficient) mice.
Based on the significant accumulation of AdoHcy observed in liver, brain, heart, and kidney of CBS-deficient mice, we hypothesized that DNA is globally hypomethylated in these tissues. However, DNA methylation status was similar in CBS-deficient and control mice in all tissues analyzed (Fig. 1). This observation contradicts previous reports on the presence of DNA hypomethylation in liver of heterozygous CBS-deficient mice (7, 8). However, our results are supported by the observation by Heil et al. (16) that DNA methylation status is not decreased in CBS-deficient patients, suggesting that global DNA hypomethylation is not involved in the pathophysiology of CBS deficiency. Notably, however, the absence of global DNA hypomethylation does not exclude the possibility of aberrant DNA methylation in specific loci (34), which could contribute to the pathophysiology of CBS deficiency. Therefore, genome-wide DNA methylation should be profiled in models of CBS deficiency in future studies.
We have previously reported that AdoHcy accumulation in human vascular endothelial cells elicits protein arginine hypomethylation to a higher extent than DNA hypomethylation (21) and that protein arginine methylation status is decreased in liver and heart in a rat model of diet-induced HHcy (22). Therefore, we have speculated that protein arginine hypomethylation due to AdoHcy buildup is present in our model of CBS deficiency. First, as an indirect measure of protein arginine methylation status, the levels of free methylarginines in tissues and serum of CBS-deficient and control mice were determined. The levels of free ADMA and SDMA in tissues of CBS-deficient mice did not differ from those of controls, suggesting that accumulation of AdoHcy resulting from deficiency of CBS did not result in decreased protein arginine dimethylation in tissues. However, free MMA levels in heart and serum of CBS-deficient mice were elevated compared with those of controls, as well as free ADMA levels in serum (Table 2). We have no straightforward explanation for these observations, which seem to contradict our hypothesis that CBS-deficient mice present protein arginine hypomethylation. However, it should be noted that factors other than the extent of protein arginine methylation may influence the levels of free methylarginines. These include protein turnover, cellular and interorgan transport, intracellular metabolism of MMA and ADMA by dimethylarginine dimethylaminohydrolase (DDAH), and renal excretion (35). For example, elevation of circulating free methylarginines in obese men and of free ADMA in elderly men was related to increased protein turnover and to lesser insulin sensitivity of protein metabolism (36). In addition, elevation of ADMA in a rat model of type 2 diabetes mellitus was attributed to glucose-induced impairment of DDAH activity (37). Furthermore, plasma concentrations of both ADMA and SDMA are elevated in patients with chronic renal failure (38).
To unequivocally assess protein arginine methylation status, we then implemented an approach in which proteins from tissue homogenates were subjected to acid hydrolysis and the released methylarginines were quantified. Notably, the levels of protein-incorporated MMA, ADMA, and SDMA in brain, in control mice, were considerably higher than those in the other tissues analyzed, whereas the lowest levels where found in heart (Table 3). These differences are in agreement with our previous study in which protein arginine methylation status in another murine model was analyzed (22) and may be attributed to tissue specificity in the expression levels of PRMTs (39) or differential expression of proteins targeted by PRMTs. Notably, the levels of protein-incorporated MMA, ADMA, and SDMA in brain and of ADMA and SDMA in liver were significantly decreased in CBS-deficient mice compared with those in controls, indicating a decrease in global protein arginine methylation status in these 2 tissues. The greater reduction in the AdoMet/AdoHcy ratio observed in brain compared with that in liver may explain the greater reduction of total protein-incorporated methylarginines observed in brain. However, protein arginine methylation status was not affected in heart and kidney, which displayed greater reductions in the AdoMet/AdoHcy ratio than liver. Therefore, it is possible that factors other than the AdoMet/AdoHcy ratio contribute in a major way to the regulation of protein arginine methylation and may offset the decrease in global protein arginine methylation that would be predicted by a decrease in the AdoMet/AdoHcy ratio. Nevertheless, our results clearly show that, in this model of CBS deficiency, protein arginine methylation status is moderately decreased in liver and more markedly decreased in brain, but not influenced in heart and kidney. Therefore, protein arginine hypomethylation, due to inhibition of PRMTs by AdoHcy, may be involved in the pathophysiology of CBS deficiency.
Histone post-translational modifications such as lysine and arginine methylation, acetylation, ubiquitination, citrullination, and phosphorylation are critical for the control of gene expression. These modifications act cooperatively to alter the chromatin structure, which may either be transcriptionally permissive or repressive, and the complex interplay between distinct post-translational modifications constitutes a “histone code” that greatly amplifies the information of the genetic code (40). Histone arginine methylation is an important contributor to the histone code and therefore is involved in the regulation of chromatin structure and gene expression (17). In this study, we assessed the abundance of several major histone arginine methylation marks in liver and brain of CBS-deficient mice relative to those in control mice. Notably, the H4R3me2a mark was markedly reduced in liver (Fig. 2). This epigenetic mark is generated by PRMT1 activity and has been associated with active transcription in mammals (41, 42). In a recent study by Schiza et al. (43), lack of N-terminal acetylation of histone H4 in yeast resulted in increased deposition of H4R3me2a, ribosomal DNA silencing, and hindered cell growth, demonstrating the functional crosstalk between the 2 post-translational modifications. Establishment of H4R3me2a was shown to induce neural stem cell differentiation (44) and erythroid differentiation by activating the transcription of β-globin genes (45). As stated above, the hepatic levels of AdoHcy in CBS-deficient mice were severely elevated (9-fold on average) compared with those of controls, suggesting that inhibition of PRMT1 by AdoHcy is responsible for the decreased H4R3me2a content observed in liver of these mice. The fact that adenosine dialdehyde, which promotes buildup of AdoHcy by inhibiting its hydrolysis, prevents methylation of H4R3 by PRMT1 and leads to attenuated myeloid differentiation, demonstrates that establishment of H4R3me2a is compromised by AdoHcy elevation (46). Abrogation of the H4R3me2a mark in liver of CBS-deficient mice may be at the root of the unique liver gene expression profile previously observed in these mice (47).
Notably, in the present study, none of the other histone arginine methylation marks analyzed was affected by the Tg-I278T Cbs−/− genotype (Fig. 2). Recently, we documented a reduction of the H3R8me2a mark in brain in a rat model of diet-induced HHcy (22). However, in the CBS deficiency model used in this study, the H3R8me2a mark in brain was not affected. Nevertheless, in our former study, the level of AdoHcy in brain was not increased, suggesting that a mechanism other than direct inhibition of histone methyltransferase activity by AdoHcy was responsible for the reduction of the H3R8me2a mark. In addition, no decrease in the hepatic content of H4R3me2a was observed in the diet-induced HHcy model (22). We reason that this discrepancy is reconciled by the different extent of hepatic AdoHcy accumulation observed in the 2 models: in the diet-induced HHcy model, AdoHcy levels were only ∼1.4-fold elevated compared with controls, whereas in the current CBS deficiency model the levels of AdoHcy were ∼9-fold higher than in control mice.
The observations disclosed in this study open new prospects. In a study by Vaes et al. (48), inhibition of cellular methylation reactions hampered osteoblast differentiation without affecting DNA methylation. Thus, the authors suggested that non-DNA methylation events are involved in osteoblast differentiation and therefore in bone formation. Osteoporosis was reported previously in Tg-I278T Cbs−/− mice (47). In view of the decrease in protein arginine methylation status observed in these mice compared with that in controls, we speculate that protein arginine methylation disturbance contributes to the abnormal bone metabolism observed in these animals, warranting further investigation. In addition, because CBS-deficient mice displayed protein arginine hypomethylation in liver and brain, hepatic and cerebral proteins that are hypomethylated in these animals should be identified (e.g., by using pan-ADMA- and SDMA-specific antibodies; ref. 49). In consideration of the marked reduction (35%) in SDMA content in cerebral proteins of CBS-deficient mice compared with that in controls, the degree of methylation of the SDMA-containing myelin basic protein should be studied in this model of CBS deficiency, because this protein is abundant in the central nervous system and its methylation, which is inhibited in vitro by AdoHcy (50), is essential for the integrity and maintenance of myelin (51). Notably, abnormal myelination patterns were found in patients with inborn errors of methionine metabolism (52, 53). In light of the decrease in H4R3me2a in liver of CBS-deficient mice, an analysis of the transcriptome regulated by this epigenetic mark in CBS-deficient and control mice should also be performed. Finally, because our study indicates that protein arginine hypomethylation as a possible new player in the pathophysiology of CBS deficiency, this potential involvement should be addressed in human studies.
In summary, we have shown that CBS-deficient mice exhibit widespread and massive accumulation of Hcy and AdoHcy in tissues, decreased protein arginine methylation status in liver and brain, and a reduction in the H4R3me2a epigenetic mark in liver. Taken together, our results show that protein arginine hypomethylation may be involved in the pathophysiology of CBS deficiency.
Acknowledgments
The authors acknowledge Sigrid de Jong and Rob Barto for their excellent technical assistance.
This work was financially supported by the Fundação para a Ciência e a Tecnologia, Portugal (grants PTDC/SAU-ORG/112683/2009, SFRH/BD/48585/2008, and SFRH/BD/41970/2007), the Hempling Foundation for Homocystinuria Research, the U.S. National Institutes of Health (grants CA06927 and R01GM098772), and an appropriation from the Commonwealth of Pennsylvania.
Footnotes
- ADMA
- asymmetric NG,NG-dimethylarginine
- AdoHcy
- S-adenosylhomocysteine
- AdoMet
- S-adenosylmethionine
- CBS
- cystathionine β-synthase
- DDAH
- dimethylarginine dimethylaminohydrolase
- DNMT
- DNA methyltransferase
- H3R8me2a
- asymmetric dimethylation of arginine 8 on histone H3
- H3R8me2s
- symmetric dimethylation of arginine 8 on histone H3
- H3R17me2a
- asymmetric dimethylation of arginine 17 on histone H3
- H4R3me2a
- asymmetric dimethylation of arginine 3 on histone H4
- H4R3me2s
- symmetric dimethylation of arginine 3 on histone H4
- Hcy
- homocysteine
- HHcy
- hyperhomocysteinemia
- HPLC
- high-performance liquid chromatography
- LC-MS/MS
- liquid chromatography-electrospray ionization-tandem mass spectrometry
- MMA
- NG-monomethylarginine
- PKMT
- protein lysine methyltransferase
- PRMT
- protein arginine methyltransferase
- SDMA
- symmetric NG,N′G-dimethylarginine
- tArg
- total arginine
- Tg
- transgenic
- tHcy
- total homocysteine
REFERENCES
- 1. Grillo M. A., Colombatto S. (2008) S-Adenosylmethionine and its products. Amino Acids 34, 187–193 [DOI] [PubMed] [Google Scholar]
- 2. Hoffman D. R., Cornatzer W. E., Duerre J. A. (1979) Relationship between tissue levels of S-adenosylmethionine, S-adenylhomocysteine, and transmethylation reactions. Can. J. Biochem. 57, 56–65 [DOI] [PubMed] [Google Scholar]
- 3. Finkelstein J. D. (1990) Methionine metabolism in mammals. J. Nutr. Biochem. 1, 228–237 [DOI] [PubMed] [Google Scholar]
- 4. James S. J., Melnyk S., Pogribna M., Pogribny I. P., Caudill M. A. (2002) Elevation in S-adenosylhomocysteine and DNA hypomethylation: potential epigenetic mechanism for homocysteine-related pathology. J. Nutr. 132, 2361S–2366S [DOI] [PubMed] [Google Scholar]
- 5. Orendac M., Zeman J., Stabler S. P., Allen R. H., Kraus J. P., Bodamer O., Stockler-Ipsiroglu S., Kvasnicka J., Kozich V. (2003) Homocystinuria due to cystathionine β-synthase deficiency: novel biochemical findings and treatment efficacy. J. Inherit. Metab. Dis. 26, 761–773 [DOI] [PubMed] [Google Scholar]
- 6. Mudd S. H., Levy H. L., Skovby F. (1995) Disorders of transsulfuration. In The Metabolic and Molecular Basis of Inherited Disease (Scriver C. R., Beaudet A. L., Sly W. S., Valle D., eds) pp. 1279–1327, McGraw-Hill, New York [Google Scholar]
- 7. Choumenkovitch S. F., Selhub J., Bagley P. J., Maeda N., Nadeau M. R., Smith D. E., Choi S. W. (2002) In the cystathionine β-synthase knockout mouse, elevations in total plasma homocysteine increase tissue S-adenosylhomocysteine, but responses of S-adenosylmethionine and DNA methylation are tissue specific. J. Nutr. 132, 2157–2160 [DOI] [PubMed] [Google Scholar]
- 8. Caudill M. A., Wang J. C., Melnyk S., Pogribny I. P., Jernigan S., Collins M. D., Santos-Guzman J., Swendseid M. E., Cogger E. A., James S. J. (2001) Intracellular S-adenosylhomocysteine concentrations predict global DNA hypomethylation in tissues of methyl-deficient cystathionine β-synthase heterozygous mice. J. Nutr. 131, 2811–2818 [DOI] [PubMed] [Google Scholar]
- 9. Robertson K. D. (2005) DNA methylation and human disease. Nat. Rev. Genet. 6, 597–610 [DOI] [PubMed] [Google Scholar]
- 10. Handy D. E., Castro R., Loscalzo J. (2011) Epigenetic modifications: basic mechanisms and role in cardiovascular disease. Circulation 123, 2145–2156 [DOI] [PMC free article] [PubMed] [Google Scholar]
- 11. Lund G., Andersson L., Lauria M., Lindholm M., Fraga M. F., Villar-Garea A., Ballestar E., Esteller M., Zaina S. (2004) DNA methylation polymorphisms precede any histological sign of atherosclerosis in mice lacking apolipoprotein E. J. Biol. Chem. 279, 29147–29154 [DOI] [PubMed] [Google Scholar]
- 12. Zaina S., Lindholm M. W., Lund G. (2005) Nutrition and aberrant DNA methylation patterns in atherosclerosis: more than just hyperhomocysteinemia? J. Nutr. 135, 5–8 [DOI] [PubMed] [Google Scholar]
- 13. Castro R., Rivera I., Struys E. A., Jansen E. E., Ravasco P., Camilo M. E., Blom H. J., Jakobs C., Tavares de Almeida I. (2003) Increased homocysteine and S-adenosylhomocysteine concentrations and DNA hypomethylation in vascular disease. Clin. Chem. 49, 1292–1296 [DOI] [PubMed] [Google Scholar]
- 14. Yi P., Melnyk S., Pogribna M., Pogribny I. P., Hine R. J., James S. J. (2000) Increase in plasma homocysteine associated with parallel increases in plasma S-adenosylhomocysteine and lymphocyte DNA hypomethylation. J. Biol. Chem. 275, 29318–29323 [DOI] [PubMed] [Google Scholar]
- 15. Chen Z., Karaplis A. C., Ackerman S. L., Pogribny I. P., Melnyk S., Lussier-Cacan S., Chen M. F., Pai A., John S. W., Smith R. S., Bottiglieri T., Bagley P., Selhub J., Rudnicki M. A., James S. J., Rozen R. (2001) Mice deficient in methylenetetrahydrofolate reductase exhibit hyperhomocysteinemia and decreased methylation capacity, with neuropathology and aortic lipid deposition. Hum. Mol. Genet. 10, 433–443 [DOI] [PubMed] [Google Scholar]
- 16. Heil S. G., Riksen N. P., Boers G. H., Smulders Y., Blom H. J. (2007) DNA methylation status is not impaired in treated cystathionine β-synthase (CBS) deficient patients. Mol. Genet. Metab. 91, 55–60 [DOI] [PubMed] [Google Scholar]
- 17. Esse R., Leandro P., Rivera I., Tavares de Almeida I., Blom H. J., Castro R. (2012) Deciphering protein arginine methylation in mammals. In Methylation—From DNA, RNA and Histones to Diseases and Treatment (Dricu A., ed) pp. 91–116, InTech, Rijeka, Croatia [Google Scholar]
- 18. Cheng X., Zhang X. (2007) Structural dynamics of protein lysine methylation and demethylation. Mutat. Res. 618, 102–115 [DOI] [PMC free article] [PubMed] [Google Scholar]
- 19. Clarke S., Banfield K. (2011) S-Adenosylmethionine-dependent methyltransferases. In Homocysteine in Health and Disease (Carmel R., Jacobsen D. W., eds) pp. 63–78, Cambridge University Press, Cambridge, UK [Google Scholar]
- 20. Guo A., Gu H., Zhou J., Mulhern D., Wang Y., Lee K. A., Yang V., Aguiar M., Kornhauser J., Jia X., Ren J., Beausoleil S. A., Silva J. C., Vemulapalli V., Bedford M. T., Comb M. J. (2014) Immunoaffinity enrichment and mass spectrometry analysis of protein methylation. Mol. Cell. Proteomics 13, 372–387 [DOI] [PMC free article] [PubMed] [Google Scholar]
- 21. Esse R., Rocha M. S., Barroso M., Florindo C., Teerlink T., Kok R. M., Smulders Y. M., Rivera I., Leandro P., Koolwijk P., Castro R., Blom H. J., de Almeida I. T. (2013) Protein arginine methylation is more prone to inhibition by S-adenosylhomocysteine than DNA methylation in vascular endothelial cells. PLoS One 8, e55483. [DOI] [PMC free article] [PubMed] [Google Scholar]
- 22. Esse R., Florindo C., Imbard A., Rocha M. S., de Vriese A. S., Smulders Y. M., Teerlink T., Tavares d. A. I, Castro R., Blom H. J. (2013) Global protein and histone arginine methylation are affected in a tissue-specific manner in a rat model of diet-induced hyperhomocysteinemia. Biochim. Biophys. Acta 1832, 1708–1714 [DOI] [PubMed] [Google Scholar]
- 23. Gupta S., Kruger W. D. (2011) Cystathionine β-synthase deficiency causes fat loss in mice. PLoS One 6, e27598. [DOI] [PMC free article] [PubMed] [Google Scholar]
- 24. Wang L., Chen X., Tang B., Hua X., Klein-Szanto A., Kruger W. D. (2005) Expression of mutant human cystathionine β-synthase rescues neonatal lethality but not homocystinuria in a mouse model. Hum. Mol. Genet. 14, 2201–2208 [DOI] [PMC free article] [PubMed] [Google Scholar]
- 25. Ubbink J. B., Hayward Vermaak W. J., Bissbort S. (1991) Rapid high-performance liquid chromatographic assay for total homocysteine levels in human serum. J. Chromatogr. 565, 441–446 [DOI] [PubMed] [Google Scholar]
- 26. Teerlink T., van Leeuwen P. A., Houdijk A. (1994) Plasma amino acids determined by liquid chromatography within 17 minutes. Clin. Chem. 40, 245–249 [PubMed] [Google Scholar]
- 27. Struys E. A., Jansen E. E., de Meer K., Jakobs C. (2000) Determination of S-adenosylmethionine and S-adenosylhomocysteine in plasma and cerebrospinal fluid by stable-isotope dilution tandem mass spectrometry. Clin. Chem. 46, 1650–1656 [PubMed] [Google Scholar]
- 28. Quinlivan E. P., Gregory J. F., III (2008) DNA methylation determination by liquid chromatography-tandem mass spectrometry using novel biosynthetic [U-15N]deoxycytidine and [U-15N]methyldeoxycytidine internal standards. Nucleic Acids Res. 36, e119. [DOI] [PMC free article] [PubMed] [Google Scholar]
- 29. Davids M., Swieringa E., Palm F., Smith D. E., Smulders Y. M., Scheffer P. G., Blom H. J., Teerlink T. (2012) Simultaneous determination of asymmetric and symmetric dimethylarginine, l-monomethylarginine, l-arginine, and l-homoarginine in biological samples using stable isotope dilution liquid chromatography tandem mass spectrometry. J. Chromatogr. B Analyt. Technol. Biomed. Life Sci. 900, 38–47 [DOI] [PubMed] [Google Scholar]
- 30. Teerlink T. (2007) HPLC analysis of ADMA and other methylated L-arginine analogs in biological fluids. J. Chromatogr. B Analyt. Technol. Biomed. Life Sci. 851, 21–29 [DOI] [PubMed] [Google Scholar]
- 31. de Jong S., Teerlink T. (2006) Analysis of asymmetric dimethylarginine in plasma by HPLC using a monolithic column. Anal. Biochem. 353, 287–289 [DOI] [PubMed] [Google Scholar]
- 32. Ueland P. M. (1982) Pharmacological and biochemical aspects of S-adenosylhomocysteine and S-adenosylhomocysteine hydrolase. Pharmacol. Rev. 34, 223–253 [PubMed] [Google Scholar]
- 33. Watanabe M., Osada J., Aratani Y., Kluckman K., Reddick R., Malinow M. R., Maeda N. (1995) Mice deficient in cystathionine β-synthase: animal models for mild and severe homocystinemia. Proc. Natl. Acad. Sci. U. S. A. 92, 1585–1589 [DOI] [PMC free article] [PubMed] [Google Scholar]
- 34. Lister R., Pelizzola M., Dowen R. H., Hawkins R. D., Hon G., Tonti-Filippini J., Nery J. R., Lee L., Ye Z., Ngo Q. M., Edsall L., Antosiewicz-Bourget J., Stewart R., Ruotti V., Millar A. H., Thomson J. A., Ren B., Ecker J. R. (2009) Human DNA methylomes at base resolution show widespread epigenomic differences. Nature 462, 315–322 [DOI] [PMC free article] [PubMed] [Google Scholar]
- 35. Teerlink T., Luo Z., Palm F., Wilcox C. S. (2009) Cellular ADMA: regulation and action. Pharmacol. Res. 60, 448–460 [DOI] [PMC free article] [PubMed] [Google Scholar]
- 36. Marliss E. B., Chevalier S., Gougeon R., Morais J. A., Lamarche M., Adegoke O. A., Wu G. (2006) Elevations of plasma methylarginines in obesity and ageing are related to insulin sensitivity and rates of protein turnover. Diabetologia 49, 351–359 [DOI] [PubMed] [Google Scholar]
- 37. Lin K. Y., Ito A., Asagami T., Tsao P. S., Adimoolam S., Kimoto M., Tsuji H., Reaven G. M., Cooke J. P. (2002) Impaired nitric oxide synthase pathway in diabetes mellitus: role of asymmetric dimethylarginine and dimethylarginine dimethylaminohydrolase. Circulation 106, 987–992 [DOI] [PubMed] [Google Scholar]
- 38. Fleck C., Janz A., Schweitzer F., Karge E., Schwertfeger M., Stein G. (2001) Serum concentrations of asymmetric (ADMA) and symmetric (SDMA) dimethylarginine in renal failure patients. Kidney. Int. Suppl. 78, S14–S18 [DOI] [PubMed] [Google Scholar]
- 39. Hong E., Lim Y., Lee E., Oh M., Kwon D. (2012) Tissue-specific and age-dependent expression of protein arginine methyltransferases (PRMTs) in male rat tissues. Biogerontology 13, 329–336 [DOI] [PubMed] [Google Scholar]
- 40. Cosgrove M. S., Wolberger C. (2005) How does the histone code work? Biochem. Cell Biol. 83, 468–476 [DOI] [PubMed] [Google Scholar]
- 41. Strahl B. D., Briggs S. D., Brame C. J., Caldwell J. A., Koh S. S., Ma H., Cook R. G., Shabanowitz J., Hunt D. F., Stallcup M. R., Allis C. D. (2001) Methylation of histone H4 at arginine 3 occurs in vivo and is mediated by the nuclear receptor coactivator PRMT1. Curr. Biol. 11, 996–1000 [DOI] [PubMed] [Google Scholar]
- 42. Wang H., Huang Z. Q., Xia L., Feng Q., Erdjument-Bromage H., Strahl B. D., Briggs S. D., Allis C. D., Wong J., Tempst P., Zhang Y. (2001) Methylation of histone H4 at arginine 3 facilitating transcriptional activation by nuclear hormone receptor. Science 293, 853–857 [DOI] [PubMed] [Google Scholar]
- 43. Schiza V., Molina-Serrano D., Kyriakou D., Hadjiantoniou A., Kirmizis A. (2013) N-α-terminal acetylation of histone H4 regulates arginine methylation and ribosomal DNA silencing. PLoS Genet. 9, e1003805. [DOI] [PMC free article] [PubMed] [Google Scholar]
- 44. Chittka A. (2010) Dynamic distribution of histone H4 arginine 3 methylation marks in the developing murine cortex. PLoS One 5, e13807. [DOI] [PMC free article] [PubMed] [Google Scholar]
- 45. Li X., Hu X., Patel B., Zhou Z., Liang S., Ybarra R., Qiu Y., Felsenfeld G., Bungert J., Huang S. (2010) H4R3 methylation facilitates β-globin transcription by regulating histone acetyltransferase binding and H3 acetylation. Blood 115, 2028–2037 [DOI] [PMC free article] [PubMed] [Google Scholar]
- 46. Balint B. L., Szanto A., Madi A., Bauer U. M., Gabor P., Benko S., Puskas L. G., Davies P. J., Nagy L. (2005) Arginine methylation provides epigenetic transcription memory for retinoid-induced differentiation in myeloid cells. Mol. Cell. Biol. 25, 5648–5663 [DOI] [PMC free article] [PubMed] [Google Scholar]
- 47. Gupta S., Kuhnisch J., Mustafa A., Lhotak S., Schlachterman A., Slifker M. J., Klein-Szanto A., High K. A., Austin R. C., Kruger W. D. (2009) Mouse models of cystathionine β-synthase deficiency reveal significant threshold effects of hyperhomocysteinemia. FASEB J. 23, 883–893 [DOI] [PMC free article] [PubMed] [Google Scholar]
- 48. Vaes B. L., Lute C., van der Woning S. P., Piek E., Vermeer J., Blom H. J., Mathers J. C., Muller M., de Groot L. C., Steegenga W. T. (2010) Inhibition of methylation decreases osteoblast differentiation via a non-DNA-dependent methylation mechanism. Bone 46, 514–523 [DOI] [PubMed] [Google Scholar]
- 49. Pahlich S., Zakaryan R. P., Gehring H. (2006) Protein arginine methylation: cellular functions and methods of analysis. Biochim. Biophys. Acta 1764, 1890–1903 [DOI] [PubMed] [Google Scholar]
- 50. Ghosh S. K., Paik W. K., Kim S. (1988) Purification and molecular identification of two protein methylases I from calf brain. Myelin basic protein- and histone-specific enzyme. J. Biol. Chem. 263, 19024–19033 [PubMed] [Google Scholar]
- 51. Kim S., Lim I. K., Park G. H., Paik W. K. (1997) Biological methylation of myelin basic protein: enzymology and biological significance. Int. J. Biochem. Cell Biol. 29, 743–751 [DOI] [PubMed] [Google Scholar]
- 52. Baric I., Fumic K., Glenn B., Cuk M., Schulze A., Finkelstein J. D., James S. J., Mejaski-Bosnjak V., Pazanin L., Pogribny I. P., Rados M., Sarnavka V., Scukanec-Spoljar M., Allen R. H., Stabler S., Uzelac L., Vugrek O., Wagner C., Zeisel S., Mudd S. H. (2004) S-Adenosylhomocysteine hydrolase deficiency in a human: a genetic disorder of methionine metabolism. Proc. Natl. Acad. Sci. U. S. A. 101, 4234–4239 [DOI] [PMC free article] [PubMed] [Google Scholar]
- 53. Surtees R. (1998) Demyelination and inborn errors of the single carbon transfer pathway. Eur. J. Pediatr. 157(Suppl. 2), S118–S121 [DOI] [PubMed] [Google Scholar]