

Abstract
We determined the effects of mutating the long-range tertiary contacts of the Tetrahymena group I ribozyme on the dynamics of its substrate helix (referred to as P1) and on catalytic activity. Dynamics were assayed by fluorescence anisotropy of the fluorescent base analogue, 6-methyl isoxanthopterin, incorporated into the P1 helix, and fluorescence anisotropy and catalytic activity were measured for wild type and mutant ribozymes over a range of conditions. Remarkably, catalytic activity correlated with P1 anisotropy over 5 orders of magnitude of activity, with a correlation coefficient of 0.94. The functional and dynamic effects from simultaneous mutation of the two long-range contacts that weaken P1 docking are cumulative and, based on this RNA’s topology, suggest distinct underlying origins for the mutant effects. Tests of mechanistic predictions via single molecule FRET measurements of rate constants for P1 docking and undocking suggest that ablation of the P14 tertiary interaction frees P2 and thereby enhances the conformational space explored by the undocked attached P1 helix. In contrast, mutation of the metal core tertiary interaction disrupts the conserved core into which the P1 helix docks. Thus, despite following a single correlation, the two long-range tertiary contacts facilitate P1 helix docking by distinct mechanisms. These results also demonstrate that a fluorescence anisotropy probe incorporated into a specific helix within a larger RNA can report on changes in local helical motions as well as differences in more global dynamics. This ability will help uncover the physical properties and behaviors that underlie the function of RNAs and RNA/protein complexes.
Introduction
Complex RNAs fold into three-dimensional structures that carry out biological functions similar to those of proteins.1 The function of both protein and RNA enzymes requires selective stabilization of active structures over vast numbers of alternative structures, but little is known about RNA dynamics (i.e., RNA’s structural motions) and their connection to function.2
To explore the relationship between RNA dynamics and function, we turned to the Tetrahymena group I ribozyme. Much has been learned from intensive and multidisciplinary studies of the Tetrahymena ribozyme,3 which catalyzes the cleavage of an oligonucleotide substrate by an exogenous guanosine cofactor.4 The Tetrahymena ribozyme contains a conserved catalytic core, which forms an active site groove between two helical regions P5–P4–P6 and P3–P7 (Figure 1A).5 The core structure is ringed by peripheral helices, which are connected by long-range tertiary contacts (Figure 1A, colored arrows). These long-range tertiary contacts were recently shown to play distinct roles in maintaining full catalytic activity, with different tertiary contacts impacting different steps of the reaction cycle (Table S1).6 Two long-range tertiary contacts (P14 and MC/MCR, Figure 1A) promote docking of the oligonucleotide substrate containing duplex (P1) into the catalytic core, where it forms tertiary interactions (Figure 1B, red cylinder). We explored the origin of these effects, and we present evidence for two distinct mechanisms by which these long-range interactions promote P1 docking.
Figure 1.

(A) Secondary structure and long-range tertiary contacts of the Tetrahymena group I ribozyme. P and L stand for base-paired and looped regions, respectively.15 The five long-range contacts are indicated by colored arrows and labeled with their names and with the fold decrease (colored numbers in parentheses) in the P1 docking equilibrium constant for the mutant compared to the wild type (WT) ribozyme (data from ref (6)). MC/MCR stands for metal core/metal core receptor.16 TL/TLR stands for tetraloop/tetraloop receptor.17 Regions that were mutated to remove the long-range contacts are colored; the name of the mutated sites and the substituted residues are depicted beside each mutation site. ARB stands for A-rich bulge.18 The site of cleavage is indicted by a black arrow. (B) The P1 docking process. P1 (red) is the duplex formed between the oligomer substrate (in lower case in part A) and the 5′-internal guide sequence (IGS in part A) of the ribozyme. P1 docks into the ribozyme’s conserved core where it forms tertiary interactions. (C) The chemical structure of 6-methyl isoxanthopterin (6-MI) used in the FPA measurements. See the Experimental section for the 6-MI-containing P1 sequence.
We recently developed a dynamics method that measures the fluorescence polarization anisotropy (FPA) of a fluorescent base analogue, 6-methyl isoxanthopterin (6-MI),7 rigidly positioned in a duplex through base pairing. 6-MI, unlike most base analogues, maintains its fluorescence when base paired so that the dynamics of individual helices within complex RNAs can be probed on the nanosecond time scale by FPA8 (see also ref (9)). To investigate the relationship between dynamics and function, we used FPA to directly measure the effects of mutating long-range tertiary contacts on P1 dynamics, we compared the effects on dynamics with effects on activity, and we used smFRET to determine the effects of these mutations on the kinetics of P1 docking into the catalytic core (Figure 1B).
Experimental Section
Ribozyme Preparation
The L-16 and L-21 ScaI ribozyme were prepared by in vitro transcription as previously reported.10 Mutations were introduced at the DNA level by PCR and verified by sequencing. The mutant and wild type ribozymes were then transcribed from DNA templates, followed by PAGE purification. The L-16 ScaI ribozyme for fluorescence polarization anisotropy (FPA) measurements has a 5′-internal guide sequence (IGS) of 5′-G17GACAG22GAGGG-3′. The 5′-ACA sequence is designed to minimize sequence-dependent quenching of 6-MI on the complementary substrate strand.7,8 The L-16 ScaI ribozyme for single molecule FRET has a 5′-IGS sequence of 5′-G17GUUUG22GAGGG-3′ and a 3′-extension for surface immobilization (see below).8a,10a,11 The L-21 ScaI ribozyme is used for activity measurement.
Fluorescence Polarization Anisotropy (FPA)
All FPA measurements used an open complex fluorescence substrate -3m,-1dC,rSF, 5′-r(CCCmUC)dCr(UFUCC)-3′, where m is 2′-methoxy substitution and F is 6-methyl isoxanthopterin (6-MI). Both the methoxy and dC substitution strongly favor the undocked state.12 -3m,-1dC,rSF was obtained from Fidelity Systems (Gaithersburg, MD) and purified by HPLC. To prepare the FPA ribozyme–substrate complex, the ribozyme was first refolded at 50 °C for 30 min with 10 mM MgCl2 and then annealed with -3m,-1dC,rSF for 20 min at room temperature. The sample was then buffer-exchanged three times using centrifugal filtration (50 kDa, Millipore) into the experimental buffer of 50 mM Na-MOPS, pH 7.0, and 10 to 100 mM MgCl2. This process also removes unbound fluorescent substrate. All FPA measurements were carried out at 30 °C following a previously reported procedure8 using a Fluorolog-3 spectrometer (Horiba). For each data point, 3–4 measurements were made on two different days with independently prepared samples. The reported errors are the standard deviations of these 3–4 repeated measurements.
Ribozyme Activity
Ribozyme activity was measured with 10 μM UCG, using a 5′-32P radiolabeled open complex substrate, -1r,dSA5, 5′-d(CCCUC)rUd(AAAAA)-3′, under single turnover conditions with the L-21 ScaI ribozyme saturating with respect to the oligonculeotide substrate (0.2–0.5 μM ribozyme and ∼0.5 nM oligonucleotide substrate; see below). The reaction conditions were 50 mM Na-MOPS, pH 6.9, and 10, 30, or 100 mM MgCl2 at 30 °C. The ribozymes were prefolded at 50 °C and 10 mM MgCl2 for 30 min and equilibrated at 30 °C with UCG and additional MgCl2 for 5–10 min before addition of the 5′-32P radiolabeled substrate to initiate the reaction. At least six time points were taken by transferring 2–4 μL aliquots of the reaction mixture into 2–4 volumes of stop/gel loading solution including 50–100 mM Na-EDTA (pH 8) and 80–90% formamide, as described previously.6 Radiolabeled oligonucleotide substrates and products were separated by 20% polyacrylamide–7 M urea denaturing gel electrophoresis, and their ratios at each time point were quantified using a PhosphorImager with ImageQuant (GE Healthcare).
Single Molecule FRET (smFRET)
Docking rate and equilibrium constants (kdock, kundock, and Kdock) were measured using single molecule FRET of individual Tetrahymena ribozyme molecules. These molecules were modified (L-16 ScaI version) containing a 3′ extension for annealing with a 3′ Cy5-labeled and 5′ biotin-labeled oligonucleotide with the sequence used previously (5′-biotin- ACCAAAAUCAACCUAAAACUUACACA-Cy5-3′).11 Molecules were prepared by first folding the ribozyme at 50 °C for 30 min in 50 mM Na-MOPS, pH 7.0, and 10 mM MgCl2 and then annealing the ribozyme with the 5′ biotin-3′Cy5 DNA oligonucleotide and the substrate 5′-r(CCCUC)dUr(AAACC)-Cy3 for 10 min at room temperature. The sample was then diluted to a concentration of ∼75 pM and attached to the surface of quartz slides for imaging in a total internal reflection microscope, as described in ref (11). Data were taken in 50 mM Na-MOPS, pH 7.0, with 10 mM MgCl2, unless noted otherwise, and with an oxygen scavenging system of 44 mM glucose, ∼1 mM Trolox, and small amounts of glucose oxidase and catalase. Image data were taken over a range of frame rates (5–20 ms) at a signal-to-noise ratio of 2–3, and the average dye lifetime was 30–40 s. The FRET traces of individual molecules displayed transitions between two FRET states: a high FRET state of ∼0.95, corresponding to the docked states, and a low FRET state of ∼0.4 corresponding to the undocked state.3b,11 Traces were accepted if there was single-step photobleaching, as expected for a single fluorophore, with a corresponding increase in donor fluorescence or decrease in acceptor fluorescence, and if there was a sufficiently high signal-to-noise ratio (SNR), as determined visually.
Rate and equilibrium constants for docking were determined by analyzing FRET traces with the SMART13 analysis package using a hidden Markov Modeling (HMM) based algorithm and fitting to a two-state model with a single undocked (low FRET) and single docked (high FRET) state. The data were also fit to a three-state model and found to fit better to the two-state model than to a three-state model according to the Bayesian information criterion (BIC)13 for the WT ribozyme and each of the single mutants (data analysis not shown).
Heterogeneity of docking behavior was previously observed for the Tetrahymena group I ribozyme and was described in terms of a “heterogeneity parameter” H, the standard deviation (s.d.) of the ΔGdock distribution.3b,14 The dispersion in docking behavior (Figures S2–S7), quantified by the apparent heterogeneity H, has contributions from both inherent heterogeneity and measurement fitting uncertainty.11,14 The heterogeneity value for the wild type ribozyme is similar to the previous reported value,3b and the single mutants have similar H values to that of the WT ribozyme (Table S2).
The smFRET data are best described with a two-state model (see above), except for the double mutant at 10 mM Mg2+, for which a large fraction of traces (78%) remained low in FRET (i.e., undocked) for the entire time prior to photobleaching. These traces cannot be fully explained with a two-state model (Supporting Information (SI) text and Figure S11), but can be quantitatively accounted for by an additional long-lived undocked state (SI text, Figure S11). These undocking traces are accounted for in calculating the docking rate for the double mutant, as described in the SI Appendix.
Results and Discussion
With 6-MI incorporated into the Tetrahymena ribozyme’s P1 helix (Figure 1A, C), we found that ablation of some of the long-range tertiary contacts led to a decrease in P1 anisotropy, compared to the WT ribozyme, whereas others did not (Table 1). The decrease in P1 anisotropy, which reflects increased P1 motion, correlates with a decrease in ribozyme activity with a correlation coefficient of 0.84 (Figure 2A, solid line).
Table 1. Effects of Peripheral Tertiary Contact Mutations on P1 Dynamics and Ribozyme Catalysisa.
| ribozymeb | anisotropy | Δ anisotropy ( × 1000)c | rate effectd |
|---|---|---|---|
| WT | 0.304 ± 0.002 | (0) | (1) |
| P14 (L5C) | 0.294 ± 0.002 | 10 ± 3 | 13 |
| P14 (L2) | 0.296 ± 0.002 | 8 ± 2 | 16 |
| MC/MCR (ARB) | 0.294 ± 0.002 | 10 ± 2 | 58 |
| L9/P5 (L9) | 0.300 ± 0.002 | 4 ± 3 | 32 |
| P13 (L2.1) | 0.303 ± 0.001 | 1 ± 2 | 3 |
| P13 (L9.1) | 0.304 ± 0.001 | 0 ± 2 | 2 |
| TL/TLR (L5B) | 0.304 ± 0.001 | 0 ± 2 | 1 |
| P14 (L5C) and MC/MCR (ARB) | 0.284 ± 0.002 | 20 ± 3 | 815 |
The error of the anisotropy is the standard deviations from 3–4 measurements (also see Experimental Section and Figure S10).
Ribozymes are named by the long-range contact (Figure 1A) that is disrupted and the specific mutation site (in parentheses; Figure 1A). For simplicity, mutants are referred to in the text by just the tertiary contact affected; the residue numbers for each of the mutation sites are as follows: L5C, 167–173; L2, 38–49; ARB, 183–188; L9, 322–327; L2.1, 70–80; L9.1, 346–353; L5B, 148–155.
ΔAnisotropy = AnisotropyWT – AnisotropyMutant.
Fold decrease relative to WT in the rate of the reaction: (E·S)open + UCG → P (see Experimental Section for detail; see also Table S5). Values are from ref (6) except for the P14&MC/MCR double mutant, which was measured herein.
Figure 2.
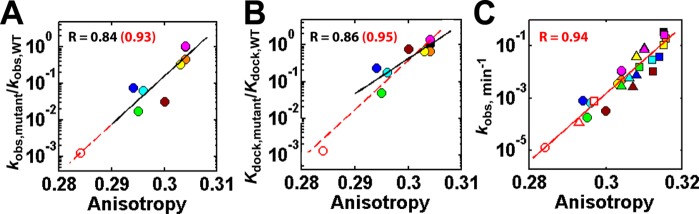
Correlation of ribozyme activity (A, C) and P1 docking (B) with P1 anisotropy. The ratio of the reaction rate (A) or the P1 docking equilibrium constant (B) for each mutant relative to wild type (WT) ribozyme and the reaction rate (C) with additional Mg2+ concentrations included in (C) relative to (A) are plotted against the anisotropy of the P1 duplex in the open complex of the wild type (black) and mutant (MC/MCR, green; P14 (L2), cyan; P14 (L5C), blue; P13 (L2.1), yellow; P13 (L9.1), orange; TL/TLR, magenta; L9/P5, brown; MC/MCR and P14 (L5C) double mutant, red unfilled) ribozymes. The substrate for anisotropy measurement, 5′-r(CCCmUCdCUFUCC)-3′, contains −3m (m; −OCH3) and −1dC (d; −H) modifications to favor the open complex and slow the chemical conversion, respectively;12,19F = 6-MI. The rate constant kobs is the apparent reaction constant for the (E·S)open + UCG → P reaction at 10 μM UCG (subsaturating) using the oligonucleotide substrate, 5′-d(CCCUC)rUd(AAAAA)-3′, which binds primarily in the open complex.19 Reaction conditions: 50 mM NaMOPS, pH 6.9, 30 °C, and varying concentrations of MgCl2 (10 mM, circles; 30 mM, triangles; 100 mM, squares). The same solution conditions were used in FPA measurements. In panel B, the relative P1 docking constant was either from ref (6) (filled) or from smFRET (unfilled; see also Figure 5).
To further probe the observed correlation between RNA dynamics and function, we tested an additional ribozyme variant, a double mutant combining two mutations that gave functional effects (Table 1, P14&MC/MCR; Figure 2A, open red circle). The double mutant exhibits greater dynamics and lower activity than the single mutants and falls on the same correlation line (Figure 2A, dashed line; correlation coefficient = 0.93). We varied the Mg2+ concentration between 10 and 100 mM to further extend the range of functional effects. Remarkably, the strong correlation between ribozyme activity and P1 anisotropy holds over a range of activity of nearly 5 orders of magnitude (Figure 2C, correlation coefficient = 0.94; see also Figure S1B.). These strong correlations introduce the possibility that long-range tertiary contacts and Mg2+ could contribute to Tetrahymena ribozyme function by limiting dynamics. Nonetheless, the result is a correlation and does not reveal underlying mechanisms. The mutants maintain the same correlation between dynamics and function over different Mg2+ concentrations (Figure 2C, solid line). This observation is consistent with the Mg2+ promoting function by limiting ribozyme core dynamics in a manner not specific to or requiring the individual tertiary interactions. This model is further supported by our observation that increasing the Mg2+ concentration from 10 to 100 mM predominantly increases the docking rate for two mutant ribozymes (Table S3).
One mutation, L9/P5, is consistently below the correlation line (Figure 2A and 2C, brown). The L9/P5 tertiary interaction (Figure 1A) uniquely impacts guanosine binding without influencing P1 docking,6 implying an absence of communication between the L9/P5 contact and the P1 duplex. The L9/P5 mutation only slightly decreases the P1 anisotropy (Table 1), supporting this absence of communication. There is a slightly stronger correlation of the effect of the mutants on docking versus anisotropy compared to the correlation with overall functional effects (Figure 2B vs 2A; note the change in position of the brown point for the L9/P5 mutant).
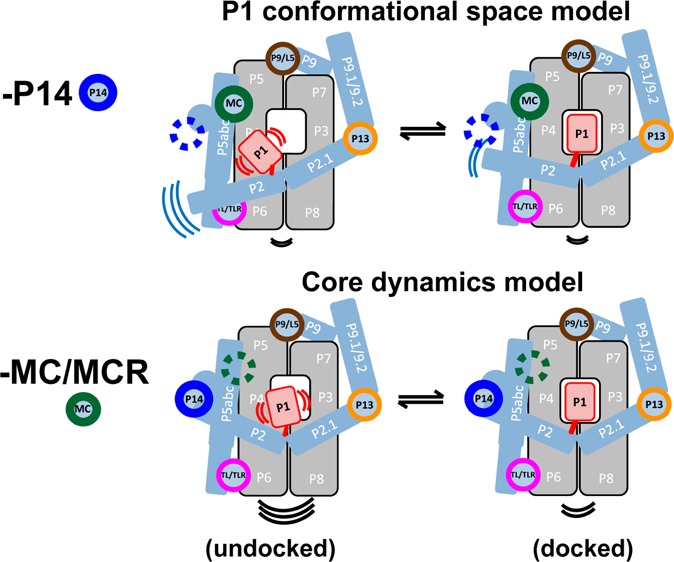
There are two mechanisms that could account for the ability of the P14 and MC/MCR long-range tertiary interactions to promote P1 helix docking into the ribozyme core (Figure 3). The most direct model linking dynamics to docking posits that reducing the conformational space of undocked P1 will increase its docking probability (i.e., the docking equilibrium constant) (Figure 3B vs 3A). The other model invokes an indirect link between P1 dynamics and docking. In this model disruption of the core weakens P1 docking because the groups into which P1 docks are less aligned or less frequently aligned to make their tertiary interactions with P1; the decrease in anisotropy of 6-MI-labeled P1 in the undocked complex would arise according to this model from increased global motion in the core with the effect propagated to the P1 helix and not from increased local P1 motion (Figure 3C vs 3A).
Figure 3.

Two mechanisms for how long-range tertiary interactions promote P1 docking in the Tetrahymena ribozyme by limiting dynamics. (A) The Tetrahymena ribozyme consists of two core sets of coaxially stacked helices (gray), several peripheral helices (blue) connected through five long-range tertiary interactions (colored circles), and the P1 duplex (red) containing the oligomer substrate. The motion lines in each panel represent the relative flexibility of different ribozyme regions in the models presented. Experimental results support the following mechanisms: (B) Ablation of the P14 interaction frees the P2 helix, leading to enhanced motion of the directly connected P1 helix, and thus a larger accessible P1 conformational space (relative to an unaffected core) and slower P1 docking into the core. P1 has the same motion relative to P2 as in (A), but now moves more along with the relatively flexible P2. (C) Ablation of the MC/MCR interaction disrupts the core, leading to enhanced core motion (black motion line) and weakened P1 docking. The groups into which P1 docks are less aligned or less frequently aligned to make their tertiary interactions with P1, leading to the observed decrease in the P1 docking rate. Removal of the MC/MCR interaction also increases dynamics or disrupts alignment in the docked state (compare the black motion lines under the core in the right columns of A–C), leading to the faster observed undocking of P1. The increased P1 motion in this model arises indirectly from an increase in overall internal motions of the ribozyme and not from increased local motion of P1 relative to the core.
We first considered whether the two tertiary interactions operate via the same mechanism. Specifically, the P14 interaction could act through the MC/MCR interaction. The P14 interaction connects to the ribozyme core (the P4–P5–P6 stack) through the P5abc element, and the P5abc element connects to the ribozyme core via the MC/MCR and TL/TLR tertiary contacts (Figures 1A and 3). As the ablation of the TL/TLR contact has no effect on docking,6 communication of structural information from P14 to the core would be expected to require an intact MC/MCR interaction. This model is consistent with the larger docking effect from ablation of the MC/MCR interaction than from ablation of P14 (Figure 1A).6 However, this model also predicts that ablation of the MC/MCR interaction would abolish any additional effect from subsequent removal of the P14 interaction, as P14 would no longer be in physical communication with the core with the MC/MCR interaction removed. However, ablating P14 with the MC/MCR interaction missing gives an additional functional effect (Figure 4, blue bars), indicating that these tertiary interactions act via distinct mechanisms and that P14’s effect is unlikely to be conveyed through the conserved core.20
Figure 4.
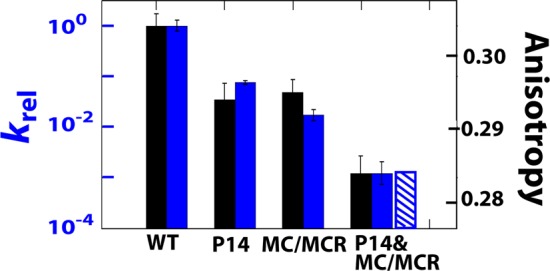
Reaction rate relative to the WT for the single and double mutants (filled blue bars) and the predicted (hatched blue bar) value for the P14&MC/MCR double mutant for a model in which the two mutations give energetically additive effects. The reaction being followed is (E·S)open + UCG → product (see SI for detailed description). The P1 anisotropy (right axis) is plotted in the black bars. The P14 and P14&MC/MCR constructs are mutated in L5C (Figure 1A).
We next considered distinct mechanisms that the two tertiary contacts might act through. P14 connects the P2 peripheral helix to the ribozyme structure (Figure 3). Disruption of the P14 interaction could free P2 to explore a larger range of motion (Figure 3B, left). This larger range of motion in P2 would in turn be expected to expand the conformational space of P1, as P1 is directly connected to P2 (Figures 1A and 3). Thus, the simplest expectation is that P14 would limit docking by increasing the P1 conformational space in the undocked state (Figure 3B). Other scenarios are possible—for example, the P14 mutation could increase core motion through disrupting a potential but unidentified direct interaction between P2 and the core. However, the absence of significant changes in chemical protection of the part of the core (the P4–P5–P6 stack) that could be in direct contact with P2 upon P14 ablation6 provides no support for this class of models. In contrast, for the MC/MCR interaction, changes in core protections beyond the site of the MC/MCR tertiary contact6 are observed, consistent with the core dynamics model (Figure 3C) and the above conclusion that P14 and MC/MCR ablations act via different mechanisms, despite both affecting P1 dynamics and following the same correlation (Figure 2).
To more directly test predictions from the mechanisms of Figure 3B and 3C, we determined the effects of ablating P14 and the MC/MCR interaction on the rates of P1 docking and undocking. In the P1 conformational space model (Figure 3B), P1 explores additional unproductive conformations in the undocked open complex (Figure 1B) due to the additional motions of the P2 helix connected to P1 (Figure 3B, left). Consequently, docking is less probable and the docking rate, kdock, is predicted to be smaller. An additional strong expectation of this mechanism is that the undocking rate, kundock, would be unaffected, as the core and docking interactions themselves are unchanged. In the case of the core dynamics model, the predictions are not as clear-cut. The more disorganized core with increased core motion (Figure 3C) could affect either or both docking and undocking rates. In this case, the core would be disorganized and spend less time in an active conformation, thus leading to a decreased docking rate, and the core might still be more dynamic or misformed in the docked state, leading to faster undocking.
We carried out smFRET experiments to directly measure the rate constants for docking and undocking of P1.11 The P14 mutation exclusively affected the docking rate (Figure 5, left), as predicted for an increased conformational exploration in the undocked state (Figure 3B). In contrast, the MC/MCR mutation affected both the docking and undocking rates (Figure 5, middle). The effect on kundock suggests that the effect from ablation of the MC/MCR interaction is transmitted to the ribozyme’s core, rendering it easier to break one or more of the interactions that stabilize the docked state (Figure 3C). Further, the observation noted above that mutations of both MC/MCR and P14 give effects on anisotropy and function greater than either mutation alone (Figure 4) suggests that enhanced local P1 mobility is not the mode of action of the MC/MCR tertiary contact leading to the docking rate effect. Rather, the results together suggest that the mutation causes the core to be more flexible, as reported by the FPA probe in P1, and thus less frequently in a state to which P1 can dock productively. These conclusions are further bolstered by the double mutant (P14&MC/MCR) having additional effects over single mutants on the docking and undocking rate constants (Figure 5, Figure S8, and Table S2).
Figure 5.
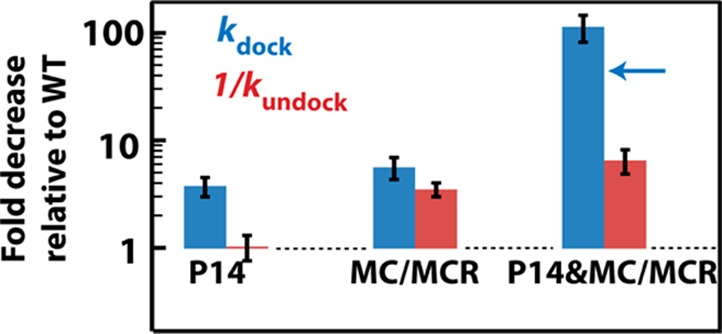
Docking rate (blue) and the reciprocal of undocking rate (red) for the single and double mutants relative to the WT, obtained by smFRET. The reciprocal of the undocking rate is used so that larger numbers are consistently associated with the decrease in docking affinity. The P14 and P14&MC/MCR constructs have the L5C mutation (Figure 1A). smFRET was carried out under the solution conditions: 50 mM NaMOPS, pH 7.0, and 10 mM MgCl2 at 23 °C. The P14&MC/MCR double mutant has a significant fraction of traces (78%) that remain undocked before photobleaching, and consideration of all of the data leads to a three-state model for the double mutant: U1 ⇌ U2 ⇌ D (see SI text and Figure S11). Exclusion of these undocked traces, using only traces with transitions, reduces kdock by about 3-fold (blue arrow; see Table S2 and SI appendix). In either case, the double mutant has a significant additional effect over single mutants on the docking rate. At higher MgCl2 concentration (100 mM), docking of the P14&MC/MCR double mutant is stabilized and is well described by a two-state model. The P14&MC/MCR double mutant under these conditions also has an additional effect over the MC/MCR single mutant on the docking rate constants (Table S3), supporting the conclusions in the text.
Conclusions and Implications
Dynamics in RNA are often hypothesized to be closely related to function.2b,21 Taking advantage of a recently developed FPA-based dynamics method, we coupled FPA with enzyme kinetic measurements and demonstrated a strong correlation between increased P1 dynamics in the Tetrahymena group I ribozyme and decreased ribozyme activity and P1 docking. Beyond this correlation, we explored the underlying origin of the correlation and identified two distinct mechanisms.
Our results suggest that local nanosecond motions of the P1 helix can be influenced by both local and global motions and these motions can have functional consequences. In one mechanism, the P14 long-range tertiary interaction acts to limit local motion of the P1 helix and thereby increases the probability of docking. In another mechanism, the MC/MCR long-range tertiary interaction alters P1 motion through global, indirect effects and promotes P1 docking by limiting conformations of the catalytic core into which the P1 helix docks.
Whereas limiting unproductive dynamics is critical for RNA function, maintaining a certain level of residual helical dynamics is needed to facilitate selective productive motions and functional conformational changes in processes such as RNA splicing, protein synthesis, and telomerase and signal recognition particle function.
FPA using 6-MI, similar fluorescent base analogues,8a,9a,9c and related methods using site-specific EPR reporters9b allow incisive interrogation of local dynamics within large RNAs and RNA/protein complexes. It will be of interest to explore how the dynamics of multiple positions within a large structure can be differentially connected to the functional conformational changes in large RNAs and, more broadly, how RNA dynamics have been limited and tuned to allow varied functional roles in biology.
Acknowledgments
We thank the members of the Herschlag lab for comments on the manuscript and Hideo Mabuchi for helping to facilitate these studies. This work was supported by NIH Grant GM49243.
Supporting Information Available
Methods, Text, Appendix, Tables S1 to S6, Figures S1 to S11. This material is available free of charge via the Internet at http://pubs.acs.org.
The authors declare no competing financial interest.
Funding Statement
National Institutes of Health, United States
Supplementary Material
References
- a Doherty E. A.; Doudna J. A. Annu. Rev. Biophys. Biomol. Struct. 2001, 30, 457. [DOI] [PubMed] [Google Scholar]; b Lilley D. M. J.; Eckstein F. In Ribozymes and RNA Catalysis; RSC Publishing: Cambridge, 2008; p 1. [Google Scholar]
- a Bothe J. R.; Nikolova E. N.; Eichhorn C. D.; Chugh J.; Hansen A. L.; Al-Hashimi H. M. Nat. Methods 2011, 8, 919. [DOI] [PMC free article] [PubMed] [Google Scholar]; b Hall K. B. Curr. Opin. Chem. Biol. 2008, 12, 612. [DOI] [PMC free article] [PubMed] [Google Scholar]; c Hoogstraten C. G.; Wank J. R.; Pardi A. Biochemistry 2000, 39, 9951. [DOI] [PubMed] [Google Scholar]; d Olsen G. L.; Echodu D. C.; Shajani Z.; Bardaro M. F. Jr.; Varani G.; Drobny G. P. J. Am. Chem. Soc. 2008, 130, 2896. [DOI] [PMC free article] [PubMed] [Google Scholar]; e Zhang Q.; Stelzer A. C.; Fisher C. K.; Al-Hashimi H. M. Nature 2007, 450, 1263. [DOI] [PubMed] [Google Scholar]; f Nguyen P.; Qin P. Z. WIREs: RNA 2012, 3, 62. [DOI] [PMC free article] [PubMed] [Google Scholar]; g Hohng S.; Wilson T. J.; Tan E.; Clegg R. M.; Lilley D. M. J.; Ha T. J. J. Mol. Biol. 2004, 336, 69. [DOI] [PubMed] [Google Scholar]; h Li H. T.; Ren X. J.; Ying L. M.; Balasubramanian S.; Klenerman D. Proc. Natl. Acad. Sci. U.S.A. 2004, 101, 14425. [DOI] [PMC free article] [PubMed] [Google Scholar]
- a Hougland J. L.; Piccirilli J. A.; Forconi M.; Lee J.; Herschlag D. In RNA World, 3rd ed.; Cold Spring Harbor Laboratory Press: Cold Spring Harbor, 2006; Vol. 43, p 133. [Google Scholar]; b Shi X.; Solomatin S. V.; Herschlag D. J. Am. Chem. Soc. 2012, 134, 1910. [DOI] [PMC free article] [PubMed] [Google Scholar]; c Che A. J.; Knight T. F. Jr. Nucleic Acids Res. 2010, 38, 2748. [DOI] [PMC free article] [PubMed] [Google Scholar]
- Herschlag D.; Cech T. R. Biochemistry 1990, 29, 10159. [DOI] [PubMed] [Google Scholar]
- a Lehnert V.; Jaeger L.; Michel F.; Westhof E. Chem. Biol. 1996, 3, 993. [DOI] [PubMed] [Google Scholar]; b Golden B. L.; Gooding A. R.; Podell E. R.; Cech T. R. Science 1998, 282, 259. [DOI] [PubMed] [Google Scholar]; c Guo F.; Gooding A. R.; Cech T. R. Mol. Cell 2004, 16, 351. [DOI] [PubMed] [Google Scholar]
- Benz-Moy T. L.; Herschlag D. Biochemistry 2011, 50, 8733. [DOI] [PMC free article] [PubMed] [Google Scholar]
- Hawkins M. E.; Pfleiderer W.; Balis F. M.; Porter D.; Knutson J. R. Anal. Biochem. 1997, 244, 86. [DOI] [PubMed] [Google Scholar]
- a Shi X.; Mollova E. T.; Pljevaljcic G.; Millar D. P.; Herschlag D. J. Am. Chem. Soc. 2009, 131, 9571. [DOI] [PMC free article] [PubMed] [Google Scholar]; b Shi X. S.; Herschlag D. Methods Enzymol. 2009, 469, 287. [DOI] [PubMed] [Google Scholar]
- a Wilhelmsson L. M.; Holmén A.; Lincoln P.; Nielsen P. E.; Nordén B. J. Am. Chem. Soc. 2001, 123, 2434. [DOI] [PubMed] [Google Scholar]; b Grant G. P.; Boyd N.; Herschlag D.; Qin P. Z. J. Am. Chem. Soc. 2009, 131, 3136. [DOI] [PMC free article] [PubMed] [Google Scholar]; c Sandin P.; Borjesson K.; Li H.; Martensson J.; Brown T.; Wilhelmsson L. M.; Albinsson B. Nucleic Acids Res. 2008, 36, 157. [DOI] [PMC free article] [PubMed] [Google Scholar]
- a Karbstein K.; Lee J.; Herschlag D. Biochemistry 2007, 46, 4861. [DOI] [PMC free article] [PubMed] [Google Scholar]; b Zaug A. J.; Grosshans C. A.; Cech T. R. Biochemistry 1988, 27, 8924. [DOI] [PubMed] [Google Scholar]
- Solomatin S. V.; Greenfeld M.; Chu S.; Herschlag D. Nature 2010, 463, 681. [DOI] [PMC free article] [PubMed] [Google Scholar]
- Bartley L. E.; Zhuang X.; Das R.; Chu S.; Herschlag D. J. Mol. Biol. 2003, 328, 1011. [DOI] [PubMed] [Google Scholar]
- Greenfeld M.; Pavlichin D. S.; Mabuchi H.; Herschlag D. PLoS One 2012, 7, e30024. [DOI] [PMC free article] [PubMed] [Google Scholar]
- Solomatin S. V.; Greenfeld M.; Herschlag D. Nat. Struct. Mol. Biol. 2011, 18, 732. [DOI] [PMC free article] [PubMed] [Google Scholar]
- Burke J. M.; Belfort M.; Cech T. R.; Davies R. W.; Schweyen R. J.; Shub D. A.; Szostak J. W.; Tabak H. F. Nucleic Acids Res. 1987, 15, 7217. [DOI] [PMC free article] [PubMed] [Google Scholar]
- Cate J. H.; Hanna R. L.; Doudna J. A. Nat. Struct. Biol. 1997, 4, 553. [DOI] [PubMed] [Google Scholar]
- Gate J. H.; Gooding A. R.; Podell E.; Zhou K. H.; Golden B. L.; Szewczak A. A.; Kundrot C. E.; Cech T. R.; Doudna J. A. Science 1996, 273, 1696. [DOI] [PubMed] [Google Scholar]
- Michel F.; Westhof E. J. Mol. Biol. 1990, 216, 585. [DOI] [PubMed] [Google Scholar]
- Herschlag D.; Eckstein F.; Cech T. R. Biochemistry 1993, 32, 8299. [DOI] [PubMed] [Google Scholar]
- The converse argument can also be made. If the MC/MCR interaction acted to limit P1 dynamics and thereby increase the docking probability, the mechanism supported for P14 (vide infra), then ablation of MC/MCR in the absence of an intact P14 interaction would also not be expected to affect P1 docking.
- Dethoff E. A.; Chugh J.; Mustoe A. M.; Al-Hashimi H. M. Nature 2012, 482, 322. [DOI] [PMC free article] [PubMed] [Google Scholar]
Associated Data
This section collects any data citations, data availability statements, or supplementary materials included in this article.