Abstract
As a partially invasive and clinically obtained neural signal, the electrocorticogram (ECoG) provides a unique opportunity to study cortical processing in humans in vivo. Functional connectivity mapping based on the ECoG signal can provide insight into epileptogenic zones and putative cortical circuits. We describe the first application of time-varying dynamic Bayesian networks (TVDBN) to the ECoG signal for the identification and study of cortical circuits. Connectivity between motor areas as well as between sensory and motor areas preceding and during movement is described. We further apply the connectivity results of the TVDBN to a movement decoder, which achieves a correlation between actual and predicted hand movements of 0.68. This paper presents evidence that the connectivity information discovered with TVDBN is applicable to the design of an ECoG-based brainmachine interface.
I. Introduction
Directional neural connectivity mapping with the electrocorticogram (ECoG) is a field of intense interest in functional brain mapping [1], [2] and the characterization of seizure dynamics [3]. Furthermore, ECoG-based brain computer interfaces have proven in recent years to benefit from ECoG's high bandwidth and high signal to noise ratio in comparison to EEG [4]–[6]. Measures of brain connectivity may provide information about the ECoG signal that can improve both the reliability of an ECoG-based brain machine interface (BMI) and the ability to achieve multiple degrees of freedom of control.
Connectivity mapping has traditionally employed the cross-correlation function or Fourier coherence, methods that are ideal when the signal to noise ratio is high [7], [8]. However, in the presence of noise and nonlinearity, as in the ECoG signal, these methods are less robust [9]. Furthermore, they may be used to identify coupling but contain little information about directionality.
Granger causality-based methods, including the directed transfer function (DTF) [1] and partial directed coherence [10]–[11], have become popular in directional connectivity. DTF has a number of variants. The direct DTF (dDTF) and the conditional Granger causality test distinguish between direct and cascade flows, and the short-time DTF (SDTF) is applicable to short time windows and rapidly changing signals [2], [12], [13], [14]. The dDTF and SDTF have been used in conjunction as the SdDTF [15].
Time-varying dynamic Bayesian networks (TVDBN) have recently been proposed as a novel way to model connectivity in non-stationary time series [16]. This approach is particularly applicable to the ECoG signal due to its ability to compensate for non-stationary data. It is also computationally efficient, making it an attractive solution for an ECoG-based BMI.
II. Methods
A. Data collection
A single epilepsy patient undergoing subdural ECoG monitoring in preparation for brain resection surgery gave informed consent to participate in a motor task. Experiments were performed under a protocol approved by the Institutional Review Board at Johns Hopkins University. During trials that lasted between approximately 1 and 5 minutes, the subject performed repeated palmar grasps, opening and closing all fingers on the hand contralateral to the implanted ECoG grid.
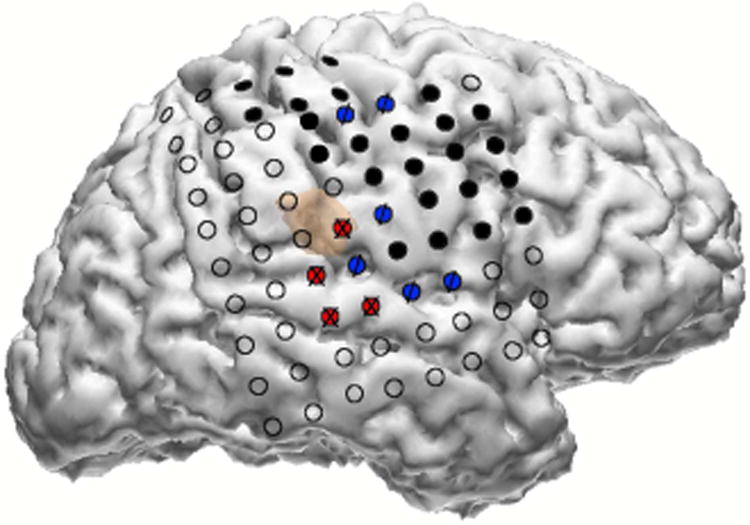
The ECoG signal was recorded with the clinical system sampled at 1000Hz from 74 subdural electrodes on the right hemisphere, shown in Fig.1. The electrodes covered sensorimotor areas as identified by an expert neurologist and electrical stimulation mapping (ESM).
Fig. 1.

Reconstruction of ECoG grid electrode locations. Black filled circles are electrodes for which electrical stimulation mapping (ESM) elicited a motor response. Blue “/” electrodes are those for which ESM elicited both motor and sensory responses, and red “X” electrodes are those for which ESM elicited a sensory response.
Joint angle data were simultaneously recorded at 25Hz from a data glove (CyberGlove Systems) worn on the left hand. The data glove reported angles of metacarpal phalangeal, interphalangeal, and distal phalangeal joints of all five fingers, as well as finger abduction and adduction.
The ECoG data was filtered by a second-order Butterworth filter with a passband of 0.15-300 Hz, with a notch filter at multiples of 60 Hz. It was then re-referenced using a common average reference (CAR) filter [17]:
| (1) |
where X(t) is the time-domain ECoG signal of the nth channel of a total of N channels.
B. ECoG Electrode Activation Index
To find the electrodes detecting signals most related to hand movement, we computed the activation index (AI). The AI is based on the local motor potential (LMP), the smoothed amplitude of the ECoG, which is known to be correlated in some motor areas with the time course of arm and finger movements [18]. To compute the LMP we used a moving average window with a length of two seconds, T:
| (2) |
Hand-related activation was computed from the LMP:
| (3) |
where m denotes the LMP during hand movement state, r denotes the LMP during hand rest state, denotes the variance across all hand states, and N denotes the total number of each type of movement state.
The AI was computed across all hand movements for each electrode, and the five electrodes with the largest absolute AI values were considered movement-related for the purpose of subsequent analyses.
C. Time- Varying Dynamic Bayesian Network
Connectivity between ECoG electrodes was modeled using a TVDBN. In this model, N channels recording the ECoG signal at time t are represented as a vector,
| (4) |
where t=1,…,T defines steps in an ECoG time series with length T. The conditional probability of observing a given value at time t given a value at previous time t−1 is P(Xt | Xt−1), a first order Markov model in which the state of X at time t depends only on its previous state.
The distribution of temporal ECoG transitions can be described as a linear model:
| (5) |
The term At ∈ RN×N is a connectivity coefficient matrix, in which Atij is the connectivity weight from the ith to the jth channel from time t − 1 to time t.
The At term can be estimated at time t with:
| (6) |
where the weight of an observation at time t* is given by wt(t*). The parameter λ defines a regularization term that shrinks the sparseness of the connection matrix A. We set this parameter to 100 [16]. We define the weighting term:
| (7) |
Where Kh (·) = e(−t2/h) is a Gaussian RBF kernel. The parameter h gives the kernel bandwidth that controls the scattering of the kernel. We used a value of 5 for h [16].
The estimation of connectivity coefficient matrix A is decomposed into two orthogonal axes. First, the estimation of the network is separated for each time point by the weight term, which weights the signal heavily near time t. Second, the estimation is separated for each channel, as in (6). By this decomposition, the solution to the network is simplified and can be solved as a weighted regression problem by least squares.
D. General Regression Neural Network
The time-varying connectivity coefficients in matrix A found with TVDBN were employed as temporal features in a general regression neural network (GRNN).We used the results of our connectivity estimation to create a decoder for hand movement trajectory.
The states of hand movement were defined as yt(t − 1, …, T), in T time steps. The connectivity coefficient matrix A at time t was reshaped as a vector: C(At1,1, …, At1,N, …, AtN,1, … AtN,N). Then y is a function of C and y, and can be estimated by its expected value:
| (8) |
The probability distribution function f(C, y) is estimated from a set of sample observations by:
| (9) |
where n is the number of sample observations, p is the dimension of the connectivity coefficient matrix A, σ is a smoothing parameter, and Di2 is the distance between C and the ith observation Ci. Substituting (9) into (8), we estimate the hand movement state with:
| (10) |
The GRNN used was a four-layer network. The input layer received an input vector, C, and transmitted it to the pattern layer. Each unit of the pattern layer output the distance Di2 to the summation layer, which performed the numerator and denominator operations in (10). The output layer computed the ratio between the numerator and denominator. The model was trained on 30% of the data and tested on 70%.
III. Results
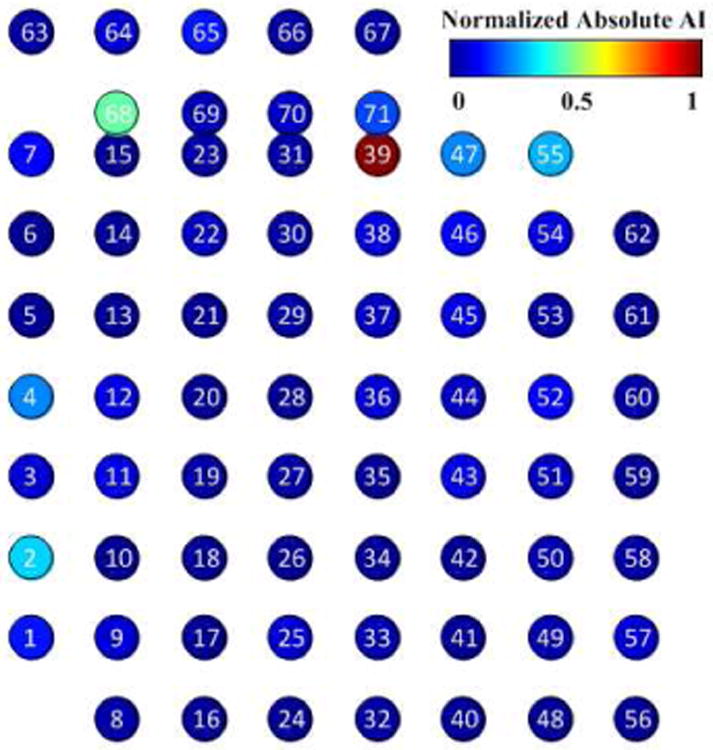
Eighteen trials of hand opening and closing movements were measured with the data glove. The simultaneously recorded ECoG signals were pre-processed, and LMP and AI of each channel were calculated. Using the AI, five ECoG channels were identified as displaying movement-related changes in LMP activity. The distribution of the AI measure is shown below in Fig.2.
Fig. 2.

Absolute AI on all ECoG electrodes. Channels 39, 68, 2, 55, and 4 had higher AI than other channels, indicating that the LMP recorded on these electrodes was more highly correlated with hand movement. These channels were considered movement-related and selected for subsequent analysis.
Channels 39, 68, 2, 55, and 4 were considered movement-related for the purpose of subsequent analyses. Channels 39 and 55 had positive AI values, which indicates that the evolution of the LMP in these channels was positively correlated with the hand movement. Channels 68, 2, and 4 had negative values, indicating negative correlations with hand movement.
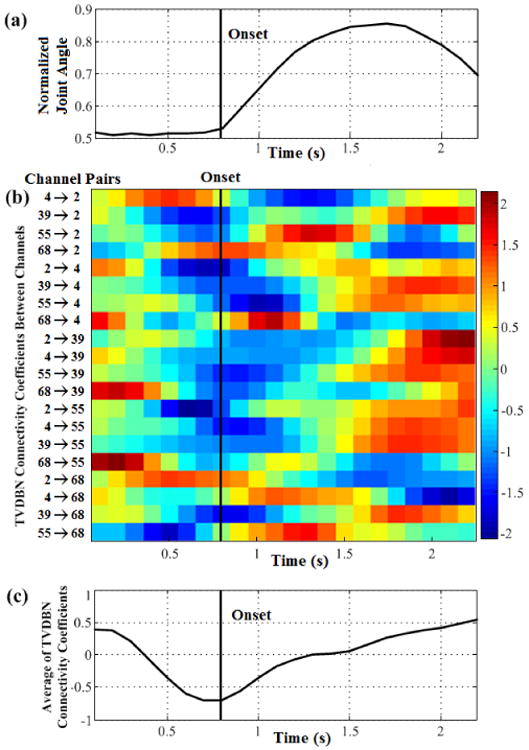
TVDBN connectivity coefficients for the five movement-related ECoG channels are shown in Fig.3. Fig.3a shows the averaged hand movements across trials. The onset of hand movement occurred at 0.8 s. In Fig.3b the connectivity coefficients between channels 39, 68, 2, 55, and 4 are averaged across all 18 hand open/close trials. Most connectivity coefficients decrease before and during hand movement onset; the exceptions are connections 4→2, 68→2, 68→4, 2→68, and 4→68. From the average of all connections, there is a reversal in average connectivity coefficient values preceding movement onset. Over the course of the movement duration, the average of the connectivity coefficients returns to baseline.
Fig. 3.

TVDBN connectivity coefficients between electrodes during hand movement, (a) Average movement waveform of the metacarpal-phalangeal joint angle plotted in time. Movement onsets occur at about 0.8 s. (b) TVDBN connectivity coefficients changing in time between five movement-related electrodes during hand movement. Each row represents one connection. (c) Evolution of the averaged connectivity coefficient values across all connections during hand movement. On average, the connectivity coefficients decrease preceding movement, and recover gradually during the full time course of the movement.
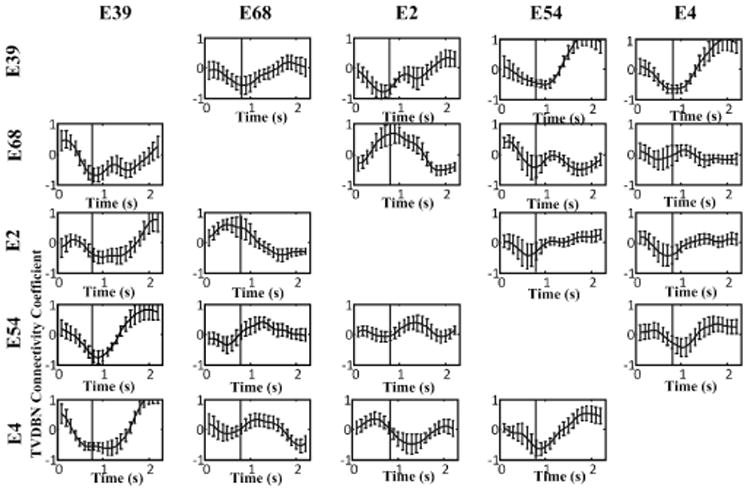
The mean and standard error of movement-related ECoG channels' TVDBN connectivity coefficients during movement trials are shown in Fig.4. In many cases there is a measurable and statistically significant change in the strength of connectivity before and during hand movement.
Fig. 4.

TVDBN connectivity coefficients between movement-related electrodes changing in time, averaged across 18 hand movements. Error bars are standard error. A total of 80% vary by at least one unit of standard error over the time course of the hand movement.
To further validate the TVDBN's tracking of movement-related cortical network changes and test the feasibility of using TVDBN connectivity coefficients to inform a motor BMI, we built a GRNN decoder. The results of this decoding algorithm using TVDBN connectivity coefficients as input are shown in Fig.5.
Fig. 5.

An example of hand trajectory (joint angle vs. time; red) during a single trial with palmar grasping movement. The blue trace shows the predicted trajectory using TVDBN connectivity coefficients as the input to a GRNN model. The predicted joint angle followed the actual joint angle with high accuracy.
The correlation between actual and predicted hand movement in the testing data was 0.68, which is comparable to reported spike-based movement decoding [19]. The TVDBN results can therefore be used as a valid input and informational tool for an ECoG-based BMI.
IV. Discussion and Conclusions
We have demonstrated the TVDBN's ability to represent changes in connectivity measured in the ECoG signal during hand movement.
The electrodes selected for this analysis are located, based on ESM results, in cortical areas that are primary motor, premotor and/or supplementary motor, and sensory. We have therefore described cortical circuits active preceding and during movement that process motor and sensory information. As expected, the largest changes in TVDBN connectivity coefficients occurred in connections between electrode 39, which was near hand primary motor area, and other movement-related electrodes. However, a large, early onset connectivity shift was also observed in, e.g., electrodes 2 and 68. ESM predicts that electrode 2 is in a sensory area, and electrode 68 is adjacent to electrodes that elicited a primary motor ESM response. TVDBN reveals a potential premovement sensory-to-motor circuit. TVDBN as applied to ECoG during a motor task elucidates the mechanisms of cortical processing during movement.
Acknowledgments
The authors thank Matthew Fifer for his contributions to the project, including support of the data analysis.
This work was supported in part by a grants from the National Science Foundation, ECCS-0835554, and from the National Institutes of Health, 1R01EB010100-01.
Contributor Information
Huaijian Zhang, Email: alexwillzhj@hotmail.com, the Qiushi Academcy for Advanced Studies, Zhejiang University, Hangzhou, China.
Heather L. Benz, Email: benz@jhu.edu, the Department of Biomedical Engineering, Johns Hopkins University, Baltimore, MD 21205 USA; phone: 443-424-2369.
Anastasios Bezerianos, Email: bezer@upatras.gr, the Department of Medical Physics, University of Patras, Patras, Greece.
Soumyadipta Acharya, Email: acharya@jhu.edu, the Department of Biomedical Engineering, Johns Hopkins University, Baltimore, MD 21205 USA.
Nathan E. Crone, Email: ncrone@jhmi.edu, the Department of Neurology, Johns Hopkins University, Baltimore, MD 21205 USA.
Anil Maybhate, Email: anil@jhmi.edu, the Department of Biomedical Engineering, Johns Hopkins University, Baltimore, MD 21205 USA.
Xiaoxiang Zheng, Email: zxx@mail.bme.zju.edu.cn, the Qiushi Academcy for Advanced Studies, Zhejiang University, Hangzhou, China.
Nitish V. Thakor, Email: nthakor@jhu.edu, the Department of Biomedical Engineering, Johns Hopkins University, Baltimore, MD 21205 USA.
References
- 1.Kaminski M, Ding M, Truccolo WA, Bressler SL. Evaluating causal relations in neural systems: Granger causality, directed transfer function and statistical assessment of significance. Biological Cybernetics. 2001;85:145–157. doi: 10.1007/s004220000235. [DOI] [PubMed] [Google Scholar]
- 2.Korzeniewska A, Manczak M, Kaminski M, Blinowska KJ, Kasicki S. Determination of information flow direction among brain structures by a modified directed transfer function (dDTF) method. Journal of Neuroscience Methods. 2003;125:195–207. doi: 10.1016/s0165-0270(03)00052-9. [DOI] [PubMed] [Google Scholar]
- 3.Kuruvilla A, Flink R. Intraoperative electrocorticography in epilepsy surgery: useful or not? Seizure-European Journal of Epilepsy. 2003;12:577–584. doi: 10.1016/s1059-1311(03)00095-5. [DOI] [PubMed] [Google Scholar]
- 4.Lebedev MA, Nicolelis L. Brain-machine interfaces: past, present and future. Trends in Neurosciences. 2006;29:536–546. doi: 10.1016/j.tins.2006.07.004. [DOI] [PubMed] [Google Scholar]
- 5.Kubanek J, Miller KJ, Ojemann JG, Wolpaw JR, Schalk G. Decoding flexion of individual fingers using electrocorticographic signals in humans. Journal of Neural Engineering. 2009;6 doi: 10.1088/1741-2560/6/6/066001. [DOI] [PMC free article] [PubMed] [Google Scholar]
- 6.Scherer R, Zanos SP, Miller KJ, Rao RPN, Ojemann JG. Classification of contralateral and ipsilateral finger movements for electrocorticographic brain-computer interfaces. Neurosurgical Focus. 2009;27 doi: 10.3171/2009.4.FOCUS0981. [DOI] [PubMed] [Google Scholar]
- 7.Andrew C, Pfurtscheller G. Event-related coherence as a tool for studying dynamic interaction of brain regions. Electroencephalogr Clin Neurophysiol. 1996;98:144–148. doi: 10.1016/0013-4694(95)00228-6. [DOI] [PubMed] [Google Scholar]
- 8.Florian G, Andrew C, Pfurtscheller G. Do changes in coherence always reflect changes in functional coupling? Electroencephalogr Clin Neurophysiol. 1998;106:87–91. doi: 10.1016/s0013-4694(97)00105-3. [DOI] [PubMed] [Google Scholar]
- 9.Smirnov DA, Bodrov MB, Perez Velazquez JL, Wennberg RA, Bezruchko BP. Estimation of coupling between oscillators from short time series via phase dynamics modeling: Limitations and application to EEG data. Chaos. 2005;15 doi: 10.1063/1.1938487. [DOI] [PubMed] [Google Scholar]
- 10.Baccala LA, Sameshima K. Partial directed coherence: a new concept in neural structure determination. Biol Cybern. 2001;84:463–74. doi: 10.1007/PL00007990. [DOI] [PubMed] [Google Scholar]
- 11.Sato JR, Takahashi DY, Arcuri SM, Sameshima K, Morettin PA, Baccala LA. Frequency domain connectivity identification: an application of partial directed coherence in fMRI. Hum Brain Mapp. 2009;30:452–61. doi: 10.1002/hbm.20513. [DOI] [PMC free article] [PubMed] [Google Scholar]
- 12.Ginter J, Blinowska KJ, Kaminski M, Durka PJ. Phase and amplitude analysis in time-frequency space - application to voluntary finger movement. Journal of Neuroscience Methods. 2001;110:113–124. doi: 10.1016/s0165-0270(01)00424-1. [DOI] [PubMed] [Google Scholar]
- 13.Ginter J, Blinowska KJ, Kaminski M, Kus R. Propagation of brain electrical activity during real and imagined motor task by directed transfer function; 2005 2nd Internatinoal Ieee/Embs Conference on Neural Engineering; 2005; pp. 105–108. [Google Scholar]
- 14.Chen Y, Bressler SL, Ding M. Frequency decomposition of conditional Granger causality and application to multivariate neural field potential data. Journal of Neuroscience Methods. 2006;150:228–237. doi: 10.1016/j.jneumeth.2005.06.011. [DOI] [PubMed] [Google Scholar]
- 15.Korzeniewska A, Crainiceanu CM, Kus R, Franaszczuk PJ, Crone NE. Dynamics of Event-Related Causality in brain electrical activity. Human Brain Mapping. 2008;29:1170–1192. doi: 10.1002/hbm.20458. [DOI] [PMC free article] [PubMed] [Google Scholar]
- 16.Song L, Kolar M, Xing EP. KELLER: estimating time-varying interactions between genes. Bioinformatics. 2009;25:1128–1136. doi: 10.1093/bioinformatics/btp192. [DOI] [PMC free article] [PubMed] [Google Scholar]
- 17.McFarland DJ, McCane LM, David SV, Wolpaw JR. Spatial filter selection for EEG-based communication. Electroencephalogr Clin Neurophysiol. 1997;103:386–94. doi: 10.1016/s0013-4694(97)00022-2. [DOI] [PubMed] [Google Scholar]
- 18.Miller KJ, Schalk G, Fetz EE, den Nijs M, Ojemann JG, Rao RPN. Cortical activity during motor execution, motor imagery, and imagery-based online feedback. PNAS. 2009;107:4430–4435. doi: 10.1073/pnas.0913697107. [DOI] [PMC free article] [PubMed] [Google Scholar]
- 19.Aggarwal V, Acharya S, Tenore F, Etienne-Cummings R, Schieber MH, Thakor NV. Asynchronous decoding of dexterous finger movements using M1 neurons. IEEE Trans Neural Syst Rehabil Eng. 2009;16:3–14. doi: 10.1109/TNSRE.2007.916289. [DOI] [PMC free article] [PubMed] [Google Scholar]


