

Abstract
The heritable component to attempted and completed suicide is partly related to psychiatric disorders and also partly independent of them. While attempted suicide linkage regions have been identified on 2p11–12 and 6q25–26, there are likely many more such loci, the discovery of which will require a much higher resolution approach, such as the genome-wide association study (GWAS). With this in mind, we conducted an attempted suicide GWAS that compared the single nucleotide polymorphism (SNP) genotypes of 1,201 bipolar (BP) subjects with a history of suicide attempts to the genotypes of 1,497 BP subjects without a history of suicide attempts. 2,507 SNPs with evidence for association at p<0.001 were identified. These associated SNPs were subsequently tested for association in a large and independent BP sample set. None of these SNPs were significantly associated in the replication sample after correcting for multiple testing, but the combined analysis of the two sample sets produced an association signal on 2p25 (rs300774) at the threshold of genome-wide significance (p= 5.07 × 10⁻⁸). The associated SNPs on 2p25 fall in a large linkage disequilibrium block containing the ACP1 gene, a gene whose expression is significantly elevated in BP subjects who have completed suicide. Furthermore, the ACP1 protein is a tyrosine phosphatase that influences Wnt signaling, a pathway regulated by lithium, making ACP1 a functional candidate for involvement in the phenotype. Larger GWAS sample sets will be required to confirm the signal on 2p25 and to identify additional genetic risk factors increasing susceptibility for attempted suicide.
Introduction
Suicidal behavior is a complex phenotype that includes both attempted and completed suicide. Genetic epidemiologic studies provide strong evidence for a heritable component to suicidal behavior 1, and the heritability for serious suicide attempts is estimated at 55% 2. The heritability for suicidal behavior appears to be partly dependent on the presence of psychiatric disorders such as bipolar disorder (BP), depression, and alcoholism. Importantly, the heritability also appears to be partly independent of them. This phenomenon is well-illustrated by the study of Brent et al 3, where the authors assessed suicidal behavior in the offspring of subjects with mood disorders and a history of suicidal behavior and of subjects with mood disorders but no such history 3. The high risk offspring had greatly elevated rates of attempted suicide (12% versus 2%, OR=6.2) despite having similar rates of psychiatric and personality disorders. The twin studies of Statham et al and Glowinski et al also reported similar results, with elevated rates of suicidal behavior in MZ:DZ twins after controlling for psychiatric disorders, suggesting that independent genetic factors may be important 2, 4.
Several studies of suicidal behavior provide evidence supporting the hypothesis that this independent factor may influence the tendency towards impulsive aggression 5–7, with individuals having both a psychiatric disorder and a tendency towards impulsive aggression having the greatest risk for suicidal behavior 1. In addition, environmental risk factors, such as parental abuse and early parental loss, may interact with genetic risk factors and thereby increase the risk for suicidal behavior.
Neurobiologic studies of suicidal behavior have focused mostly on the serotonergic system, due to several lines of evidence implicating this neurotransmitter pathway, including the finding of decreased serotonin metabolite 5-hydroxyindolacetic acid (5-HIAA) levels in the cerebrospinal fluid from patients who attempted suicide 8. Genetic association studies of suicidal behavior have also focused on the serotonergic system, with the tryptophan hydroxylase genes (TPH1 and TPH2) and the serotonin transporter gene receiving considerable attention. However, association studies with these genes and the attempted and completed suicide phenotypes have been mixed 9.
Four attempted suicide genome-wide linkage studies have been completed using pedigrees with alcoholism, BP, and major depression. Three of these studies provided compelling evidence implicating a genetic risk factor for suicidal behavior in the 2p11–12 candidate region while two of them showed additional, more modest, evidence for a locus on 6q25–2610–13.
Microarray expression studies have also identified candidate genes for suicidal behavior 14–18 with results implicating genes such as SSAT, which encodes the rate-limiting enzyme in polyamine catabolism 14.
While the four attempted suicide linkage studies support the presence of at least two suicidal behavior loci, there are likely many more such loci, the discovery of which will require a much higher resolution approach, such as the genome-wide association study (GWAS). Recent GWAS analyses in schizophrenia 19 and bipolar disorder 20 have identified a number of association signals meeting genome-wide significance, providing potentially groundbreaking advances in these fields.
We are interested in identifying genetic risk factors for suicidal behavior in bipolar disorder, where approximately 36.3% of subjects with bipolar I disorder attempt suicide 21. Towards that end, we have completed an attempted suicide GWAS using 1,201 BP subjects with a history of suicide attempts and 1,497 BP subjects with no history of suicide attempts. Here, we present the results of this attempted suicide GWAS and our efforts to replicate the most promising findings.
Materials and Methods
Subjects
NIMH-BP Samples
The details of the ascertainment and assessment methods for the NIMH-BP samples can be found in the original study reports 22, 23. Briefly, the NIMH-BP subjects were collected in five waves. Families were recruited in the first four waves of the study if the proband met criteria for bipolar I disorder and had at least one additional first-degree relative with bipolar I or schizoaffective disorder, bipolar type. In the fifth wave of the study, only unrelated bipolar I subjects were recruited, and no family history of BP was required. Subjects were assessed using the Diagnostic Interview for Genetic Studies (DIGS), and diagnoses were made using DSM-III-R and DSM-IV 24. Unrelated subjects with self-reported European-American ancestry and a diagnosis of bipolar I disorder or schizoaffective disorder-bipolar type from all five waves were selected for genotyping. All subjects signed written informed consent forms prior to enrolling into the NIMH-BP study.
German Sample
The details of the ascertainment and assessment methods for the German sample have been described elsewhere 25. Briefly, bipolar I disorder probands were recruited via consecutive hospital admissions, assessed by a structured interview, and diagnosed according to DSM-IV criteria. Written informed consent was obtained from all study participants, and unrelated subjects with a diagnosis of bipolar I disorder were selected for genotyping.
Genotyping
Genotyping of the NIMH-BP samples was conducted in two separate efforts, referred to as the Genetic Association Information Network Bipolar Sample (GAIN-BP) 23 and the Translational Genomics Research Institute (TGEN) sample 23. Genotyping in both efforts was performed using the Affymetrix 6.0 array, and standardized quality control measures were applied to both BP datasets and matched normal controls as described in the study’s primary manuscript 23. Briefly, subjects with missing data rates ≥ 5% were dropped from the analysis, and SNPs were dropped from the analysis if they had minor allele frequencies < 1%, missing data rates ≥ 5% or Hardy-Weinberg equilibrium (HWE) p-values < 10−6. The final cleaned GAIN-BP sample consists of 1,001 BP subjects (42.7% suicide attempters) and 724,067 SNPs, and the final cleaned TGEN dataset includes 1,190 BP subjects (46.7% suicide attempters) and 728,187 SNPs. We included all subjects from both of these canonical datasets in our association study.
Genotyping of the German sample was completed using the Illumina HumanHap550 array. Subjects with missing data rates > 5% were dropped from the analysis, and SNPs were dropped if they had missing data rates > 2%, minor allele frequencies < 2% or HWE p-values < 0.0001. We included the final cleaned dataset, including 645 cases (33.8% suicide attempters) and 516,024 SNPs, in our association study.
Phenotype Definition
Our goal was to conduct an analysis of this genotype data using attempted suicide as the phenotype. Our analytic strategy involved comparing the genotypes of BP subjects with a self-reported history of attempted suicide (attempters) to the genotypes of BP subjects without a self-reported history of attempted suicide (non-attempters), thereby eliminating loci that are associated with BP in general. The attempted suicide GWAS analysis included 1,201 attempters, 1,497 non-attempters, and 138 subjects with an unknown attempted suicide status.
Population Stratification
We used the principal components method as implemented by EIGENSTRAT in the program EIGENSOFT 3.026 to correct for population stratification in our GWAS. We conducted the analysis using the 137,892 genotyped SNPs that were in common to all three datasets (GAIN-BP, TGEN, and German). We selected the top five principal components based on an examination of the scree plot of eigenvalues to include as covariates in our association analysis (Supplementary Figure 1).
Imputation
Our three datasets (GAIN-BP, TGEN, and German) were genotyped on two different platforms, requiring us to impute them prior to conducting a mega-analysis. We imputed each dataset separately using the phased haplotype data from HapMap phase I & II release 24 (http://hapmap.ncbi.nlm.nih.gov/) as the reference panel. The program BEAGLE was used to orient all SNPs of our three datasets to the positive strand consistent with the reference panel data and to generate imputed allelic dosages for autosomal SNPs 27. Following this procedure, we removed all low confidence imputed SNPs (MAF < 0.01, r2 ≤ 0.3, HWE p-value < 1×10⁻⁶).
Statistical Analysis
The three imputed datasets were then combined into one consisting of a total of 2,408,051 SNPs for a mega-analysis. We ran our association analyses using the program mach2dat 28, which incorporates estimated allelic dosages into a logistic regression model for tests of association between genotype and phenotype. We included terms in our logistic regression model adjusting for the top five principal components and also included a dummy-coded variable that indexed the three datasets to control for any possible confounding due to heterogeneity across samples. Supplementary Figure 2 shows the resulting Q-Q plot. The λ was estimated as 1.01. We reported the likelihood ratio p-values and used the conventional p<5×10⁻⁸ 29, 30 as the threshold for declaring a finding genome-wide significant.
In addition to the primary analysis outlined above, we also performed two exploratory analyses. We stratified the samples according to sex or to the presence of substance abuse/dependence and repeated the attempted suicide association analysis within each stratum. This analysis was performed using mach2dat with logistic regression and the imputed allelic dosages as described above. The female sample had 779 attempters and 779 non-attempters while the male sample had 422 attempters and 718 non-attempters. Substance abuse/dependence information was not available for the German sample, so this secondary analysis was conducted using only the GAIN-BP and TGEN samples. Thus, the substance free sample had 388 attempters and 610 non-attempters. The substance abuse/dependence sample had 595 attempters (190 with only alcohol abuse/dependence, 54 with only substance abuse/dependence, and 351 with both alcohol and substance abuse/dependence) and 532 non-attempters (226 with only alcohol abuse/dependence, 55 with only substance abuse/dependence, and 251 with both alcohol and substance abuse/dependence).
Replication Study Details
We attempted to replicate our top GWAS findings from the primary attempted suicide analysis in an independent BP sample consisting of 3,117 BP subjects with information about attempted suicide (1,295 attempters and 1,822 non-attempters) taken from a combined and imputed sample from the Wellcome Trust Case Control Consortium, STEP-BD and University College London (WTCCC/STEP-BD/UCL) 20. SNPs with p-values <0.001 in our primary analysis were tested for evidence of association in the replication sample, which was conducted using allelic dosages in PLINK 31. We used the program METAL to conduct a fixed-effects meta-analysis of the results from our sample and the replication sample to determine the combined evidence of association.
Gene Expression in Postmortem Brain
We reanalyzed Stanley Medical Research Institute (SMRI) gene expression microarray data from studies of postmortem brains derived from subjects with BP. There were 34 BP subjects (14 with suicide and 20 without suicide) on whom data was available to assess expression of ACP1 among those who died by suicide compared to those who died by other means. Reanalysis was performed because the meta-analytic results for this comparison on the SMRI website (www.stanleygenomics.org) mix data from different brain regions and different platforms. We reanalyzed the three datasets that focus on Brodmann area 46 and use the Affymetrix hgu133a platform.
Normalization was performed using MAS 5.0. Expression values were scaled so that the median expression value for each study was equal to 100 on the linear scale. Quality control was carried out using Hierarchical Clustering and Principal Component Analysis, and genome-wide outliers for each microarray study were detected and removed (Study1: A-19, A-28, A-29, A-31, A-41, A-50, A-59, A-87; Study3: none; Study7: IDs: A-50, A-59). Intensity values from the three ACP1 probes present in the hgu133a platform (201629_s_at, 201630_s_at, and 215227_x_at) were extracted. Data from the three studies were averaged to yield one expression value per probe. We used linear regression to determine whether the BP subjects who died by suicide showed higher intensity levels at these probes than did BP subjects who died by other means, after controlling for these covariates: age, sex, brain pH, PMI.
Results
Attempted Suicide GWAS
The Manhattan plot illustrating the results for the primary attempted suicide association analysis is shown in Figure 1, with 2,507 SNPs (0.1%) showing evidence for association at p<0.001 (Supplementary Table 1). Table 1 highlights the top associated regions from this analysis. The strongest signal was at rs300774 (p=1.09 × 10⁻⁶; OR 1.42) in an intergenic region on 2p25 (Figure 2; Supplementary Table 2). There was a significant difference in the distribution of males and females among the attempters and non-attempters (p-value=2.68 × 10⁻¹¹), but there was no significant difference for age at interview (p=0.99). Thus, we repeated the association analysis controlling for sex. The top association signals remained essentially the same after controlling for this variable (e.g. rs300774 unadjusted p=1.09 × 10⁻⁶, adjusted p= 1.24 × 10⁻⁶), indicating that the evidence for association was not due to the sex distribution differences in the attempters and non-attempters.
Figure 1.
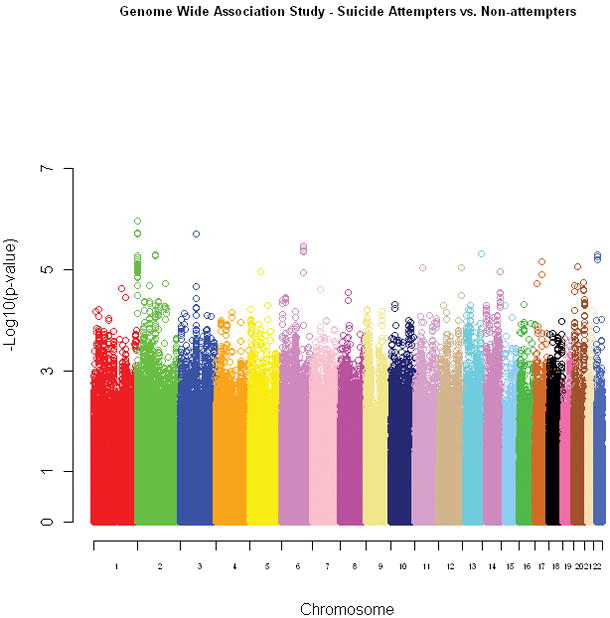
The Manhattan plot for the primary attempted suicide analysis. The chromosomes are presented in order (pter to qter) and color-coded for ease of identification. The individual SNPs are represented by open circles and their corresponding p-values are graphed according to the −log10(p-value).
Table 1.
Top associated regions (p < 1 × 10⁻⁵) from the primary attempted suicide GWAS
| Chromosome Region | Best SNP in Region | Chromosome Location (bp) | Minor/Major Allele1 | Minor Allele Frequency2 | RefSeq Gene3 | Odds Ratio4 | P-value |
|---|---|---|---|---|---|---|---|
| 2p25 | rs300774 | 102496 | A/C | 0.18 | Intergenic | 1.42 | 1.09 × 10⁻⁶ |
| 2q12 | rs10189155 | 104102684 | G/C | 0.04 | Intergenic | 2.01 | 5.03 × 10⁻⁶ |
| 3p12 | rs2175671 | 86346973 | T/C | 0.27 | Intergenic | 1.38 | 1.94 × 10⁻⁶ |
| 6q22 | rs9320964 | 124237506 | T/A | 0.34 | NKAIN2 | 0.76 | 3.35 × 10⁻⁶ |
| 11p11 | rs12801214 | 44449493 | T/C | 0.13 | Intergenic | 0.68 | 9.02 × 10⁻⁶ |
| 12q24 | rs7296262 | 127661025 | T/C | 0.51 | TMEM132C | 1.43 | 9.08 × 10⁻⁶ |
| 13q33 | rs1543002 | 107301357 | C/T | 0.32 | FAM155A | 0.76 | 4.80 × 10⁻⁶ |
| 17q21 | rs11650719 | 39007411 | A/G | 0.15 | Intergenic | 1.42 | 7.10 × 10⁻⁶ |
| 20p11 | rs6076080 | 23439778 | T/C | 0.12 | Intergenic | 1.46 | 8.81 × 10⁻⁶ |
| 22q12 | rs5752388 | 25439475 | C/T | 0.23 | Intergenic | 1.35 | 5.12 × 10⁻⁶ |
The minor allele as based on the HapMap phase I & II release 24 (http://hapmap.ncbi.nlm.nih.gov/) data is listed first.
The frequency of the listed minor allele is calculated based on our combined three datasets; as a result, the MAF may be greater than 0.50.
Indicates whether the SNP localizes to a known RefSeq gene or to an intergenic region (UCSC Genome Browser, March 2006).
The odds ratio is provided for the listed minor allele from a logistic regression analysis under an additive model.
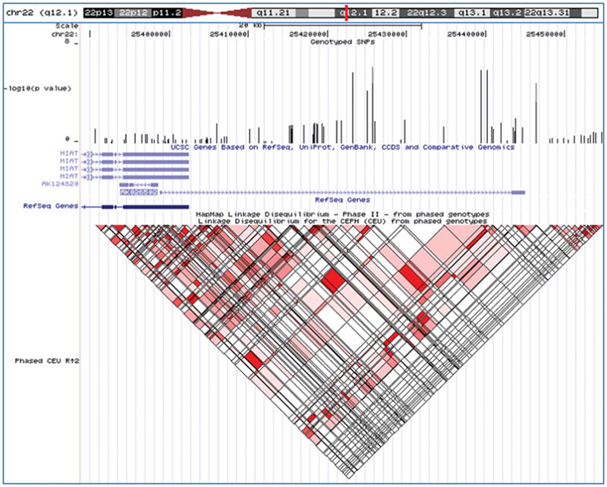
Figure 2.

The 2p25 candidate region - shown are the chromosomal location, genotyped SNPs from the primary analysis, gene structure for each of the candidate genes in the region, and linkage disequilibrium structure for the region based on the HapMap CEU population (UCSC Genome Browser, March 2006).
We also performed two hypothesis-generating secondary analyses on the GWAS dataset. First, we stratified the sample set according to sex, with the goal of increasing homogeneity and identifying sex-specific risk loci, and then repeated the attempted suicide association analysis. There was no overlap between the top male and female SNP lists (p < 0.001) (Supplementary Tables 3 and 4). The most significant association signal in males was at rs5752388 on chromosome 22q12 in the AK026502 gene that generates a non-coding RNA (p=1.07 × 10⁻⁶; OR 1.67; Figure 3A), and the most significant association signal in females was at rs10170138 on chromosome 2p12 in the LRRTM4 gene (p=9.27 × 10⁻⁷; OR 0.60; Figure 3B), which codes for a nervous system transmembrane protein 32. The stratification analysis also indicated that the evidence for association with rs300774 was stronger in males (p=4.55 × 10⁻⁶; OR 1.69) than in females (p=0.01077; OR 1.27).
Figure 3.
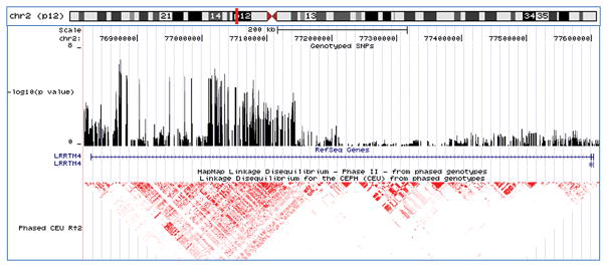

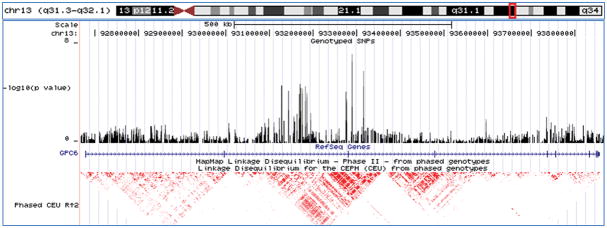
Top association signals for the secondary analyses - shown are the chromosomal locations, genotyped SNPs, gene structures, and linkage disequilibrium structures for each of the top association signals (UCSC Genome Browser, March 2006). A-male-specific results; B-female-specific results; C-substance abuse/dependence-specific results; and D-substance free results.
Second, we stratified the sample set according to the presence or absence of substance abuse/dependence, with the goal of identifying loci with evidence for an interaction with this important clinical co-morbidity. Only two SNPs (rs2900032 and rs2175671) appeared on both top SNP lists with a p < 0.001 (Supplemental Tables 5 and 6). The most significant association signal with substance abuse/dependence was at rs4072169 in an intergenic region on 4q32 (p= 1.61 × 10⁻⁶; OR 1.69; Figure 3C) while the most significant association signal in the substance free sample was at rs2150127 on 13q31 in the GPC6 gene (p= 6.37 × 10⁻⁸; OR 0.12; Figure 3D), which codes for a heparan sulfate proteoglycan belonging to a family of proteins that play a role in signal transduction including the stimulation of Wnt signaling 33.
Attempted Suicide Replication
We were also interested in determining whether the associated SNPs from the primary analyses would replicate in an independent sample set. We tested the 2,507 observed and imputed SNPs that met a threshold of p < 0.001 in the primary attempted suicide analysis for evidence of association in the combined WTCCC/STEP-BD/UCL sample 20, which was also imputed to HapMap I & II, allowing us to test directly for evidence of replication. None of the 2,507 SNPs were significant in the replication sample alone after Bonferroni correction for multiple comparisons (p= 0.05 ÷ 2,507 SNPs = 2 × 10⁻⁵; Supplementary Table 1). However, we did identify a number of SNPs with evidence for association in both sample sets. Thus, we conducted a meta-analysis using the attempted suicide results from both the primary and replication samples and identified one marker on 2p25, rs300774, with a p-value of 5.07 × 10⁻⁸, which was on the threshold of genome-wide significance (p<5×10⁻⁸) (Table 2). Two additional chromosomal regions (12q24 and 11p13) had p-values < 1 × 10⁻⁵ in the combined sample set.
Table 2.
Attempted suicide replication and meta-analysis results
| Chromosome Region | Best SNP in Region | RefSeq1 Gene | RefSeq Genes in LD | Initial Odds Ratio2 | Initial P-value | Replication Odds Ratio2 | Replication P-value | Combined P-value |
|---|---|---|---|---|---|---|---|---|
| 2p25 | rs300774 | Intergenic | SH3YL1, ACP1, FAM150B | 1.42 | 1.09 × 10⁻⁶ | 1.22 | 0.0036 | 5.07 × 10⁻⁸ |
| 11p13 | rs10437629 | C11orf41 | None | 1.62 | 8.56 × 10⁻⁵ | 1.34 | 0.0078 | 3.77 × 10⁻⁶ |
| 12q24 | rs7296262 | TMEM132C | None | 1.43 | 9.08 × 10⁻⁶ | 1.22 | 0.011 | 1.09 × 10⁻⁶ |
Indicates whether the SNP localizes to a known RefSeq gene or to an intergenic region (UCSC Genome Browser, March 2006).
The odds ratio is provided for the minor allele from a logistic regression analysis under an additive model.
Gene Expression in Postmortem Brain
Our results on 2p25 led us to examine microarray data from the SMRI website, which includes an assessment of expression levels of SH3YL1 and ACP1 in brains of BP subjects who died by suicide compared to those of BP subjects who died by other means. The SH3YL1 transcript is not reported as significantly altered in those who committed suicide. ACP1 expression, however, is reported as significantly elevated in brains of those who committed suicide. Because of the potential for heterogeneity and confounding in these results, we downloaded and reanalyzed the ACP1 data, focusing on three of the 20 SMRI studies that used the same platform, and looked at the same brain region, Brodmann area 46 in the prefrontal cortex. We found that there were significant effects on ACP1 expression for sex and for brain pH, but even after controlling for them, we continued to see significantly increased expression in those who died by suicide, for one of the three probes (201629_s_at) (p<0.043), though the effects were slightly more modest for the other two (p < 0.10) (Supplementary Figure 3).
Discussion
In this report, we describe the results of a GWAS of attempted suicide. Our primary analysis, using 1,201 attempters and 1,497 non-attempters, identified 2,507 SNPs with nominal evidence for association (p <0.001), including ten candidate regions with evidence for association at p < 1 × 10⁻⁵. Follow-up in a sample that combined our original one plus an independent replication dataset identified one candidate region on 2p25 with p=5.07 × 10⁻⁸, a finding which is on the threshold of genome-wide significance (p < 5 × 10⁻⁸). In addition, secondary analyses aimed at identifying sex-specific loci and loci associated with substance abuse/dependence identified distinct lists of SNPs with more modest evidence for association.
The 2p25 association signal lies in the intergenic region between the SH3YL1 and FAM110C genes. While both of these genes are expressed in the brain, little is known about their potential functional contribution in the brain. Work to date indicates that SH3YL1 may play a role in hair follicle development 34 and that FAM110C may play a role in cell spreading and migration 35. Our top association signals on 2p25 lie in a large linkage disequilibrium block that includes SH3YL1 and two other genes, ACP1 and FAM150B. ACP1 codes for a protein tyrosine phosphatase that is expressed in the brain 36 while FAM150B is an uncharacterized protein-coding transcript.
Lithium’s ability to reduce the risk of suicidal behavior is well-established, and it is hypothesized to exert its therapeutic effect by inhibiting glycogen synthase kinase-3 (GSK-3) and activating the Wnt signaling pathway37. Activated GSK-3 phosphorylates the beta-catenin protein, resulting in its degradation and in reduced Wnt signaling, an event that is thought to be inhibited by lithium. Long-term lithium treatment results in increased cytoplasmic protein levels of beta-catenin in the rat brain 38. In addition, elevation of beta-catenin positively regulates neurogenesis just as lithium does 39. Interestingly, the ACP1 gene product also regulates beta-catenin. Overexpression of ACP1, as seen in the SMRI BP suicide completers, results in decreased cytoplasmic beta-catenin 40, which is the opposite effect of lithium administration, thus making ACP1 a functional candidate for involvement in suicidal behavior.
Our sex-specific secondary analyses identified primarily female-specific loci (90 female SNPs versus 16 male SNPs with p-values < 1 × 10⁻⁵), which is an intriguing finding given that women attempt suicide at a rate 2–3 times higher than men 41, 42. The most significant female-specific signal was seen with marker rs10170138, located in intron 3 of the LRRTM4 gene on 2p12. Interestingly, the LRRTM4 gene sits under the 2p11–12 attempted suicide linkage peak, which was initially identified using mood disorder pedigree sets that were predominantly female 11, 12. The LRRTM4 gene encodes a transmembrane protein hypothesized to play a role in nervous system maintenance and development 32.
We identified these two association signals on 2p25 and 2p12 by comparing the genotypes of BP subjects who have attempted suicide to those of BP subjects without attempts. This “case-only” approach was designed to identify genetic variants conferring risk to attempted suicide specifically and not to BP in general, and the current association findings with the attempted suicide phenotype provide support for the existence of gene(s) influencing risk for suicidal behavior on the short arm of chromosome 2, an observation that is consistent with the linkage findings using pedigrees with BP, major depression, and alcoholism.
Neurobiological and genetic studies of suicidality have implicated genes from both the serotonergic system and the hypothalamic-pituitary-adrenal (HPA) axis in the development of suicidal behavior 43. However, our attempted suicide GWAS analysis failed to identify significant associations with genes in either pathway or with other important suicidal behavior candidate genes, such as BDNF, NTRK2, and SSAT (Supplementary Table 1). One possible explanation for our inability to detect association in these genes is that our “case-only” approach may have missed loci that influence suicidal ideation since both our attempters and non-attempters have a high rate of this phenotype. A second possible explanation for this lack of association is that our study focused on association with SNPs while many of these prior studies identified association with insertion-deletion polymorphisms and VNTRs, which may not be tagged efficiently by our SNP genotyping panel. A third possible explanation is that one or more of these loci influences suicidal behavior in a phenotypic subset of these samples (such as subjects with highly lethal attempts), and this heterogeneity has reduced our ability to detect evidence for association at these loci.
Our findings should be interpreted in light of several limitations. First, our study was limited by the loss of power inherent in the analysis of subphenotypes. We estimated that our combined sample had 80% power to detect a locus of genome-wide significance with an odds ratio of 1.5. Second, our study was designed to identify common variants conferring risk for the attempted suicide phenotype, so we did not assess the impact of rare variants or copy number variants. Third, we did not include environmental risk factors, such as parental abuse and early parental loss, which may interact with genetic factors and increase the risk for suicidal behavior. Fourth, it is possible that some subjects -who were classified as non-attempters at the time of ascertainment - went on to attempt suicide 44. However, this would mean that our attempter sample will have been biased towards those with early-onset suicide attempts, which may have increased sample homogeneity. Finally, the ACP1 gene expression study was limited by the fact that the BP subjects were heterogeneous with respect to their medication use. Additional studies using larger sample sets and more detailed medication histories will be required to determine the impact (if any) of each medication and medication combination on ACP1 gene expression.
Our primary and replication analyses from this GWAS of attempted suicide identified an association signal on 2p25 at the threshold of genome-wide significance, providing support for the presence of common genetic variation influencing the risk for suicidal behavior. Analysis of the attempted suicide phenotype in additional GWAS samples, such as the ones being assembled by the Psychiatric GWAS Consortium (PGC), will be required to confirm the signal on 2p25 and will allow for the identification of additional loci influencing suicidal behavior in BP and related psychiatric phenotypes.
Supplementary Material
Supplementary Figure 1: Scatterplot matrix of each of the top 5 principal components versus the others shown for the suicide attempters versus non-attempters. The top 5 principal components were calculated by Eigenstrat using data from 137,892 SNPs that were genotyped in common across the three combined datasets. The suicide attempters and non-attempters cluster well together yielding little evidence of stratification that might confound the association results.
Supplementary Figure 2: Q-Q plot of results from the genome-wide study of suicide attempters versus non-attempters. Results are from an analysis with mach2dat testing associations with each of the 2,408,051 observed and imputed SNPs under the additive model using logistic regression and controlling for the top 5 principal components and a dummy-coded variable indexing the three combined datasets. There is no excessive deviation of the observed results from the expected, and the estimated λ for genomic inflation was 1.01.
Supplemental Figure 3: Box-plots of microarray expression results for three ACP1 probes. Results for probes 201629_s_at, 201630_s_at, and 215227_x_at are based on the reanalysis of three Stanley Medical Research Institute (SMRI) gene expression microarray datasets from postmortem brains using 34 subjects with BP (14 with suicide and 20 without suicide). Intensity values are plotted on the Y- axis. The solid lines within the boxes represent the mean signal intensities, and the bars represent the 95% confidence intervals. Subjects 4 and 11, which have signal intensities below the 95% confidence interval, were included in the analysis.
Supplementary Table 1: Association Results for the top 2,507 SNPs with p < 0.001 identified in the primary attempted suicide association analysis. Likelihood ratio p-values are given for both the primary study (GAIN-BP, TGEN, and German samples) and the replication study (Wellcome Trust Case Control Consortium, STEP-BD and University College London samples). Odds ratios for both studies represent the risk for the minor allele using an additive model. Meta-analysis results for the combined samples are presented for SNPs with odds ratios in the same direction. Chromosome, base pair locations, and RefSeq gene locations were taken from the UCSC Genome Browser (March 2006). The genotyping status for each SNP is reported individually for each study (GAIN-BP, TGEN, and German samples) as imputed (I) or observed (O). Replication data was not available for 101 of the 2,507 SNPs. Table abbreviations: BP- base pair; Alleles – minor, major allele; CHR-chromosome
Supplementary Table 2: Results by sample for the top associated regions (p < 1 × 10⁻⁵) from the primary attempted suicide association analysis. Likelihood ratio p-values, odds ratios, and SNP genotyping status (observed or imputed) are given for the combined sample and for the GAIN-BP, TGEN, and German samples individually.
Supplementary Table 3: Association Results for the top 2,347 SNPs with p < 0.001 identified in the male-specific attempted suicide association analysis (GAIN-BP, TGEN, and German samples). The minor and major alleles, minor allele frequency, likelihood ratio p-value, and odds ratio are given for each SNP. Odds ratios represent the risk for the minor allele using an additive model. Chromosome, base pair locations, and RefSeq gene locations were taken from the UCSC Genome Browser (March 2006). The genotyping status for each SNP is reported individually for each study (GAIN-BP, TGEN, and German samples) as imputed (I) or observed (O). Table abbreviations: BP- base pair; Alleles – minor, major allele; MAF- minor allele frequency; CHR-chromosome
Supplementary Table 4: Association Results for the top 2,715 SNPs with p < 0.001 identified in the female-specific attempted suicide association analysis (GAIN-BP, TGEN, and German samples). The minor and major alleles, minor allele frequency, likelihood ratio p-value, and odds ratio are given for each SNP. Odds ratios represent the risk for the minor allele using an additive model. Chromosome, base pair locations, and RefSeq gene locations were taken from the UCSC Genome Browser (March 2006). The genotyping status for each SNP is reported individually for each study (GAIN-BP, TGEN, and German samples) as imputed (I) or observed (O). Table abbreviations: BP- base pair; Alleles minor, – major allele; MAF- minor allele frequency; CHR-chromosome
Supplementary Table 5: Association Results for the top 2,274 SNPs with p < 0.001 identified in the substance abuse/dependence attempted suicide association analysis (GAIN-BP and TGEN samples). The minor and major alleles, minor allele frequency, likelihood ratio p-value, and odds ratio are given for each SNP. Odds ratios represent the risk for the minor allele using an additive model. Chromosome, base pair locations, and RefSeq gene locations were taken from the UCSC Genome Browser (March 2006). The genotyping status for each SNP is reported individually for each study (GAIN-BP, TGEN, and German samples) as imputed (I) or observed (O). Table abbreviations: BP- base pair; Alleles – minor, major allele; MAF- minor allele frequency; CHR-chromosome
Supplementary Table 6: Association Results for the top 2,585 SNPs with p < 0.001 identified in the substance free attempted suicide association analysis (GAIN-BP and TGEN samples). The minor and major alleles, minor allele frequency, likelihood ratio p-value, and odds ratio are given for each SNP. Odds ratios represent the risk for the minor allele using an additive model. Chromosome, base pair locations, and RefSeq gene locations were taken from the UCSC Genome Browser (March 2006). The genotyping status for each SNP is reported individually for each study (GAIN-BP, TGEN, and German samples) as imputed (I) or observed (O). Table abbreviations: BP- base pair; Alleles – minor, major allele; MAF- minor allele frequency; CHR-chromosome
Acknowledgments
This work was supported by grants from the National Institute of Mental Health (MH079240 to V.L.W.) and the American Foundation for Suicide Prevention (V.L.W.). It was also supported in part by R01 MH079799 (J.W.S.). Drs. Willour and Potash were also supported by Margaret Price Investigatorships. The authors have no conflicts of interest or financial disclosures to report. DNA samples were prepared and distributed by Rutgers University under a contract from the NIMH. We are grateful to the many interviewers and diagnosticians who contributed to this project, and to the families who devoted their time and effort to the study.
Genome-wide SNP genotyping of the NIMH samples was performed through the Genetic Association Information Network under the direction of The Bipolar Genome Study (BiGS) Consortium. The Principal Investigators and Co-Investigators were: University of California San Diego, La Jolla, CA, John R. Kelsoe, M.D. (PI), Tiffany A. Greenwood, Ph.D., Thomas B. Barrett, M.D., Ph.D., Caroline M. Nievergelt, Ph.D., Rebecca McKinney, Paul D. Shilling, Ph.D.; Scripps Research Institute, La Jolla, CA: Nicholas Schork, Ph.D. (PI), Erin N. Smith, Ph.D., Cinnamon S. Bloss, Ph.D.; Indiana University, Bloomington, IN, John I. Nurnberger, Jr., M.D. (PI), Howard J. Edenberg, Ph.D., Tatiana Foroud, Ph.D., Daniel M. Koller; University of Chicago, Chicago, IL, Elliot Gershon, M.D. (PI), Chunyu Liu, Ph.D., Judith A. Badner, Ph.D.; Rush University Medical Center, Chicago, IL, William A. Scheftner, M.D.; Howard University, Washington, DC, William B. Lawson, M.D. (PI), Evaristus A. Nwulia, M.D., Maria Hipolito, M.D.; University of Iowa, Iowa City, IA, William Coryell, M.D. (PI); Washington University, St. Louis, MO, John Rice, Ph.D. (PI); University of California San Francisco, San Francisco, CA, William Byerley, M.D. (PI); National Institute of Mental Health, Bethesda, MD, Francis McMahon, M.D. (PI), Thomas G. Schulze, M.D.; University of Pennsylvania, Philadelphia, PA, Wade Berrettini, M.D., Ph.D. (PI); Johns Hopkins University, Baltimore, MD, James B. Potash, M.D. (PI), Peter P. Zandi, Ph.D., Pamela B. Mahon, Ph.D.; University of Michigan, Ann Arbor, MI, Melvin G. McInnis, M.D. (PI), Sebastian Zöllner, Ph.D., Peng Zhang; The Translational Genomics Research Institute, Phoenix, AZ, David Craig, Ph.D. (PI), Szabolics Szelinger.
Data and biomaterials were collected in four projects that participated in the National Institute of Mental Health (NIMH) Bipolar Disorder Genetics Initiative. From 1991–98, the Principal Investigators and Co-Investigators were: Indiana University, Indianapolis, IN, U01 MH46282, John Nurnberger, M.D., Ph.D., Marvin Miller, M.D., and Elizabeth Bowman, M.D.; Washington University, St. Louis, MO, U01 MH46280, Theodore Reich, M.D., Allison Goate, Ph.D., and John Rice, Ph.D.; Johns Hopkins University, Baltimore, MD U01 MH46274, J. Raymond DePaulo, Jr., M.D., Sylvia Simpson, M.D., MPH, and Colin Stine, Ph.D.; NIMH Intramural Research Program, Clinical Neurogenetics Branch, Bethesda, MD, Elliot Gershon, M.D., Diane Kazuba, B.A., and Elizabeth Maxwell, M.S.W.
Data and biomaterials were collected as part of ten projects that participated in the National Institute of Mental Health (NIMH) Bipolar Disorder Genetics Initiative. From 1999–03, the Principal Investigators and Co-Investigators were: Indiana University, Indianapolis, IN, R01 MH59545, John Nurnberger, M.D., Ph.D., Marvin J. Miller, M.D., Elizabeth S. Bowman, M.D., N. Leela Rau, M.D., P. Ryan Moe, M.D., Nalini Samavedy, M.D., Rif El-Mallakh, M.D. (at University of Louisville), Husseini Manji, M.D. (at Wayne State University), Debra A. Glitz, M.D. (at Wayne State University), Eric T. Meyer, M.S., Carrie Smiley, R.N., Tatiana Foroud, Ph.D., Leah Flury, M.S., Danielle M. Dick, Ph.D., Howard Edenberg, Ph.D.; Washington University, St. Louis, MO, R01 MH059534, John Rice, Ph.D, Theodore Reich, M.D., Allison Goate, Ph.D., Laura Bierut, M.D.; Johns Hopkins University, Baltimore, MD, R01 MH59533, Melvin McInnis M.D., J. Raymond DePaulo, Jr., M.D., Dean F. MacKinnon, M.D., Francis M. Mondimore, M.D., James B. Potash, M.D., Peter P. Zandi, Ph.D, Dimitrios Avramopoulos, and Jennifer Payne; University of Pennsylvania, PA, R01 MH59553, Wade Berrettini M.D., Ph.D.; University of California at Irvine, CA, R01 MH60068, William Byerley M.D., and Mark Vawter M.D.; University of Iowa, IA, R01 MH059548, William Coryell M.D., and Raymond Crowe M.D.; University of Chicago, IL, R01 MH59535, Elliot Gershon, M.D., Judith Badner Ph.D., Francis McMahon M.D., Chunyu Liu Ph.D., Alan Sanders M.D., Maria Caserta, Steven Dinwiddie M.D., Tu Nguyen, Donna Harakal; University of California at San Diego, CA, R01 MH59567, John Kelsoe, M.D., Rebecca McKinney, B.A.; Rush University, IL, R01 MH059556, William Scheftner M.D., Howard M. Kravitz, D.O., M.P.H., Diana Marta, B.S., Annette Vaughn-Brown, MSN, RN, and Laurie Bederow, MA; NIMH Intramural Research Program, Bethesda, MD, 1Z01MH002810-01, Francis J. McMahon, M.D., Layla Kassem, PsyD, Sevilla Detera-Wadleigh, Ph.D, Lisa Austin, Ph.D, Dennis L. Murphy, M.D.
Data and biomaterials were collected as part of eleven projects (Study 40) that participated in the National Institute of Mental Health (NIMH) Bipolar Disorder Genetics Initiative. From 2003–2007, the Principal Investigators and Co-Investigators were: Indiana University, Indianapolis, IN, R01 MH59545, John Nurnberger, M.D., Ph.D., Marvin J. Miller, M.D., Elizabeth S. Bowman, M.D., N. Leela Rau, M.D., P. Ryan Moe, M.D., Nalini Samavedy, M.D., Rif El-Mallakh, M.D. (at University of Louisville), Husseini Manji, M.D. (at Johnson and Johnson), Debra A. Glitz, M.D. (at Wayne State University), Eric T. Meyer, Ph.D., M.S. (at Oxford University, UK), Carrie Smiley, R.N., Tatiana Foroud, Ph.D., Leah Flury, M.S., Danielle M. Dick, Ph.D (at Virginia Commonwealth University), Howard Edenberg, Ph.D.; Washington University, St. Louis, MO, R01 MH059534, John Rice, Ph.D, Theodore Reich, M.D., Allison Goate, Ph.D., Laura Bierut, M.D. K02 DA21237; Johns Hopkins University, Baltimore, M.D., R01 MH59533, Melvin McInnis, M.D., J. Raymond DePaulo, Jr., M.D., Dean F. MacKinnon, M.D., Francis M. Mondimore, M.D., James B. Potash, M.D., Peter P. Zandi, Ph.D, Dimitrios Avramopoulos, and Jennifer Payne; University of Pennsylvania, PA, R01 MH59553, Wade Berrettini, M.D., Ph.D.; University of California at San Francisco, CA, R01 MH60068, William Byerley, M.D., and Sophia Vinogradov, M.D.; University of Iowa, IA, R01 MH059548, William Coryell, M.D., and Raymond Crowe, M.D.; University of Chicago, IL, R01 MH59535, Elliot Gershon, M.D., Judith Badner, Ph.D., Francis McMahon, M.D., Chunyu Liu, Ph.D., Alan Sanders, M.D., Maria Caserta, Steven Dinwiddie, M.D., Tu Nguyen, Donna Harakal; University of California at San Diego, CA, R01 MH59567, John Kelsoe, M.D., Rebecca McKinney, B.A.; Rush University, IL, R01 MH059556, William Scheftner, M.D., Howard M. Kravitz, D.O., M.P.H., Diana Marta, B.S., Annette Vaughn-Brown, M.S.N., R.N., and Laurie Bederow, M.A.; NIMH Intramural Research Program, Bethesda, MD, 1Z01MH002810-01, Francis J. McMahon, M.D., Layla Kassem, Psy.D., Sevilla Detera-Wadleigh, Ph.D, Lisa Austin, Ph.D, Dennis L. Murphy, M.D.; Howard University, William B. Lawson, M.D., Ph.D., Evarista Nwulia, M.D., and Maria Hipolito, M.D.
Footnotes
Supplementary information is available at the Molecular Psychiatry website.
References
- 1.Brent DA, Mann JJ. Family genetic studies, suicide, and suicidal behavior. Am J Med Genet C Semin Med Genet. 2005;133C:13–24. doi: 10.1002/ajmg.c.30042. [DOI] [PubMed] [Google Scholar]
- 2.Statham DJ, Heath AC, Madden PA, Bucholz KK, Bierut L, Dinwiddie SH, et al. Suicidal behaviour: An epidemiological and genetic study. Psychol Med. 1998;28:839–55. doi: 10.1017/s0033291798006916. [DOI] [PubMed] [Google Scholar]
- 3.Brent DA, Oquendo M, Birmaher B, Greenhill L, Kolko D, Stanley B, et al. Familial pathways to early-onset suicide attempt: Risk for suicidal behavior in offspring of mood-disordered suicide attempters. Arch Gen Psychiatry. 2002;59:801–7. doi: 10.1001/archpsyc.59.9.801. [DOI] [PubMed] [Google Scholar]
- 4.Glowinski AL, Bucholz KK, Nelson EC, Fu Q, Madden PA, Reich W, et al. Suicide attempts in an adolescent female twin sample. J Am Acad Child Adolesc Psychiatry. 2001;40:1300–7. doi: 10.1097/00004583-200111000-00010. [DOI] [PMC free article] [PubMed] [Google Scholar]
- 5.Brent DA, Oquendo M, Birmaher B, Greenhill L, Kolko D, Stanley B, et al. Peripubertal suicide attempts in offspring of suicide attempters with siblings concordant for suicidal behavior. Am J Psychiatry. 2003;160:1486–93. doi: 10.1176/appi.ajp.160.8.1486. [DOI] [PubMed] [Google Scholar]
- 6.Pfeffer CR, Normandin L, Kakuma T. Suicidal children grow up: Suicidal behavior and psychiatric disorders among relatives. J Am Acad Child Adolesc Psychiatry. 1994;33:1087–97. doi: 10.1097/00004583-199410000-00004. [DOI] [PubMed] [Google Scholar]
- 7.Melhem NM, Brent DA, Ziegler M, Iyengar S, Kolko D, Oquendo M, et al. Familial pathways to early-onset suicidal behavior: Familial and individual antecedents of suicidal behavior. Am J Psychiatry. 2007;164:1364–70. doi: 10.1176/appi.ajp.2007.06091522. [DOI] [PMC free article] [PubMed] [Google Scholar]
- 8.Asberg M, Traskman L, Thoren P. 5-HIAA in the cerebrospinal fluid. A biochemical suicide predictor? Arch Gen Psychiatry. 1976;33:1193–7. doi: 10.1001/archpsyc.1976.01770100055005. [DOI] [PubMed] [Google Scholar]
- 9.Brezo J, Klempan T, Turecki G. The genetics of suicide: A critical review of molecular studies. Psychiatr Clin North Am. 2008;31:179–203. doi: 10.1016/j.psc.2008.01.008. [DOI] [PubMed] [Google Scholar]
- 10.Hesselbrock V, Dick D, Hesselbrock M, Foroud T, Schuckit M, Edenberg H, et al. The search for genetic risk factors associated with suicidal behavior. Alcohol Clin Exp Res. 2004;28:70S–6S. doi: 10.1097/01.alc.0000127416.92128.b0. [DOI] [PubMed] [Google Scholar]
- 11.Zubenko GS, Maher BS, Hughes HB, 3rd, Zubenko WN, Scott Stiffler J, Marazita ML. Genome-wide linkage survey for genetic loci that affect the risk of suicide attempts in families with recurrent, early-onset, major depression. Am J Med Genet B Neuropsychiatr Genet. 2004;129B:47–54. doi: 10.1002/ajmg.b.30092. [DOI] [PubMed] [Google Scholar]
- 12.Willour VL, Zandi PP, Badner JA, Steele J, Miao K, Lopez V, et al. Attempted suicide in bipolar disorder pedigrees: Evidence for linkage to 2p12. Biol Psychiatry. 2007;61:725–7. doi: 10.1016/j.biopsych.2006.05.014. [DOI] [PubMed] [Google Scholar]
- 13.Cheng R, Juo SH, Loth JE, Nee J, Iossifov I, Blumenthal R, et al. Genome-wide linkage scan in a large bipolar disorder sample from the national institute of mental health genetics initiative suggests putative loci for bipolar disorder, psychosis, suicide, and panic disorder. Mol Psychiatry. 2006;11:252–60. doi: 10.1038/sj.mp.4001778. [DOI] [PubMed] [Google Scholar]
- 14.Sequeira A, Gwadry FG, Ffrench-Mullen JM, Canetti L, Gingras Y, Casero RA, Jr, et al. Implication of SSAT by gene expression and genetic variation in suicide and major depression. Arch Gen Psychiatry. 2006;63:35–48. doi: 10.1001/archpsyc.63.1.35. [DOI] [PubMed] [Google Scholar]
- 15.Sequeira A, Klempan T, Canetti L, ffrench-Mullen J, Benkelfat C, Rouleau GA, et al. Patterns of gene expression in the limbic system of suicides with and without major depression. Mol Psychiatry. 2007;12:640–55. doi: 10.1038/sj.mp.4001969. [DOI] [PubMed] [Google Scholar]
- 16.Sequeira A, Mamdani F, Ernst C, Vawter MP, Bunney WE, Lebel V, et al. Global brain gene expression analysis links glutamatergic and GABAergic alterations to suicide and major depression. PLoS One. 2009;4:e6585. doi: 10.1371/journal.pone.0006585. [DOI] [PMC free article] [PubMed] [Google Scholar]
- 17.Tochigi M, Iwamoto K, Bundo M, Sasaki T, Kato N, Kato T. Gene expression profiling of major depression and suicide in the prefrontal cortex of postmortem brains. Neurosci Res. 2008;60:184–91. doi: 10.1016/j.neures.2007.10.010. [DOI] [PubMed] [Google Scholar]
- 18.Kim S, Choi KH, Baykiz AF, Gershenfeld HK. Suicide candidate genes associated with bipolar disorder and schizophrenia: An exploratory gene expression profiling analysis of post-mortem prefrontal cortex. BMC Genomics. 2007;8:413. doi: 10.1186/1471-2164-8-413. [DOI] [PMC free article] [PubMed] [Google Scholar]
- 19.Shi J, Levinson DF, Duan J, Sanders AR, Zheng Y, Pe’er I, et al. Common variants on chromosome 6p22.1 are associated with schizophrenia. Nature. 2009;460:753–7. doi: 10.1038/nature08192. [DOI] [PMC free article] [PubMed] [Google Scholar]
- 20.Ferreira MA, O’Donovan MC, Meng YA, Jones IR, Ruderfer DM, Jones L, et al. Collaborative genome-wide association analysis supports a role for ANK3 and CACNA1C in bipolar disorder. Nat Genet. 2008;40:1056–8. doi: 10.1038/ng.209. [DOI] [PMC free article] [PubMed] [Google Scholar]
- 21.Novick DM, Swartz HA, Frank E. Suicide attempts in bipolar I and bipolar II disorder: A review and meta-analysis of the evidence. Bipolar Disord. 2010;12:1–9. doi: 10.1111/j.1399-5618.2009.00786.x. [DOI] [PMC free article] [PubMed] [Google Scholar]
- 22.Genomic survey of bipolar illness in the NIMH genetics initiative pedigrees: A preliminary report. Am J Med Genet. 1997;74:227–37. doi: 10.1002/(sici)1096-8628(19970531)74:3<227::aid-ajmg1>3.0.co;2-n. [DOI] [PubMed] [Google Scholar]
- 23.Smith EN, Bloss CS, Badner JA, Barrett T, Belmonte PL, Berrettini W, et al. Genome-wide association study of bipolar disorder in european american and african american individuals. Mol Psychiatry. 2009;14:755–63. doi: 10.1038/mp.2009.43. [DOI] [PMC free article] [PubMed] [Google Scholar]
- 24.Nurnberger JI, Jr, Blehar MC, Kaufmann CA, York-Cooler C, Simpson SG, Harkavy-Friedman J, et al. Diagnostic interview for genetic studies. rationale, unique features, and training. NIMH genetics initiative. Arch Gen Psychiatry. 1994;51:849, 59. doi: 10.1001/archpsyc.1994.03950110009002. discussion 863–4. [DOI] [PubMed] [Google Scholar]
- 25.McMahon FJ, Akula N, Schulze TG, Muglia P, Tozzi F, Detera-Wadleigh SD, et al. Meta-analysis of genome-wide association data identifies a risk locus for major mood disorders on 3p21.1. Nat Genet. 2010;42:128–31. doi: 10.1038/ng.523. [DOI] [PMC free article] [PubMed] [Google Scholar]
- 26.Price AL, Patterson NJ, Plenge RM, Weinblatt ME, Shadick NA, Reich D. Principal components analysis corrects for stratification in genome-wide association studies. Nat Genet. 2006;38:904–9. doi: 10.1038/ng1847. [DOI] [PubMed] [Google Scholar]
- 27.Browning BL, Browning SR. A unified approach to genotype imputation and haplotype-phase inference for large data sets of trios and unrelated individuals. Am J Hum Genet. 2009;84:210–23. doi: 10.1016/j.ajhg.2009.01.005. [DOI] [PMC free article] [PubMed] [Google Scholar]
- 28.Li Y, Willer C, Sanna S, Abecasis G. Genotype imputation. Annu Rev Genomics Hum Genet. 2009;10:387–406. doi: 10.1146/annurev.genom.9.081307.164242. [DOI] [PMC free article] [PubMed] [Google Scholar]
- 29.Dudbridge F, Gusnanto A. Estimation of significance thresholds for genomewide association scans. Genet Epidemiol. 2008;32:227–34. doi: 10.1002/gepi.20297. [DOI] [PMC free article] [PubMed] [Google Scholar]
- 30.Ioannidis JP, Thomas G, Daly MJ. Validating, augmenting and refining genome-wide association signals. Nat Rev Genet. 2009;10:318–29. doi: 10.1038/nrg2544. [DOI] [PMC free article] [PubMed] [Google Scholar]
- 31.Purcell S, Neale B, Todd-Brown K, Thomas L, Ferreira MA, Bender D, et al. PLINK: A tool set for whole-genome association and population-based linkage analyses. Am J Hum Genet. 2007;81:559–75. doi: 10.1086/519795. [DOI] [PMC free article] [PubMed] [Google Scholar]
- 32.Lauren J, Airaksinen MS, Saarma M, Timmusk T. A novel gene family encoding leucine-rich repeat transmembrane proteins differentially expressed in the nervous system. Genomics. 2003;81:411–21. doi: 10.1016/s0888-7543(03)00030-2. [DOI] [PubMed] [Google Scholar]
- 33.Filmus J, Capurro M, Rast J. Glypicans. Genome Biol. 2008;9:224. doi: 10.1186/gb-2008-9-5-224. [DOI] [PMC free article] [PubMed] [Google Scholar]
- 34.Aoki N, Ito K, Ito M. A novel mouse gene, Sh3yl1, is expressed in the anagen hair follicle. J Invest Dermatol. 2000;114:1050–6. doi: 10.1046/j.1523-1747.2000.00971.x. [DOI] [PubMed] [Google Scholar]
- 35.Hauge H, Fjelland KE, Sioud M, Aasheim HC. Evidence for the involvement of FAM110C protein in cell spreading and migration. Cell Signal. 2009;21:1866–73. doi: 10.1016/j.cellsig.2009.08.001. [DOI] [PubMed] [Google Scholar]
- 36.Souza AC, Azoubel S, Queiroz KC, Peppelenbosch MP, Ferreira CV. From immune response to cancer: A spot on the low molecular weight protein tyrosine phosphatase. Cell Mol Life Sci. 2009;66:1140–53. doi: 10.1007/s00018-008-8501-8. [DOI] [PMC free article] [PubMed] [Google Scholar]
- 37.O’Brien WT, Klein PS. Validating GSK3 as an in vivo target of lithium action. Biochem Soc Trans. 2009;37:1133–8. doi: 10.1042/BST0371133. [DOI] [PMC free article] [PubMed] [Google Scholar]
- 38.Gould TD, Chen G, Manji HK. In vivo evidence in the brain for lithium inhibition of glycogen synthase kinase-3. Neuropsychopharmacology. 2004;29:32–8. doi: 10.1038/sj.npp.1300283. [DOI] [PubMed] [Google Scholar]
- 39.Wexler EM, Geschwind DH, Palmer TD. Lithium regulates adult hippocampal progenitor development through canonical wnt pathway activation. Mol Psychiatry. 2008;13:285–92. doi: 10.1038/sj.mp.4002093. [DOI] [PubMed] [Google Scholar]
- 40.Taddei ML, Chiarugi P, Cirri P, Buricchi F, Fiaschi T, Giannoni E, et al. Beta-catenin interacts with low-molecular-weight protein tyrosine phosphatase leading to cadherin-mediated cell-cell adhesion increase. Cancer Res. 2002;62:6489–99. [PubMed] [Google Scholar]
- 41.Baca-Garcia E, Perez-Rodriguez MM, Keyes KM, Oquendo MA, Hasin DS, Grant BF, et al. Suicidal ideation and suicide attempts in the united states: 1991–1992 and 2001–2002. Mol Psychiatry. 2010;15:250–9. doi: 10.1038/mp.2008.98. [DOI] [PMC free article] [PubMed] [Google Scholar]
- 42.Hawton K, van Heeringen K. Suicide. Lancet. 2009;373:1372–81. doi: 10.1016/S0140-6736(09)60372-X. [DOI] [PubMed] [Google Scholar]
- 43.Currier D, Mann JJ. Stress, genes and the biology of suicidal behavior. Psychiatr Clin North Am. 2008;31:247–69. doi: 10.1016/j.psc.2008.01.005. [DOI] [PMC free article] [PubMed] [Google Scholar]
- 44.Angst J, Angst F, Gerber-Werder R, Gamma A. Suicide in 406 mood-disorder patients with and without long-term medication: A 40 to 44 years’ follow-up. Arch Suicide Res. 2005;9:279–300. doi: 10.1080/13811110590929488. [DOI] [PubMed] [Google Scholar]
Associated Data
This section collects any data citations, data availability statements, or supplementary materials included in this article.
Supplementary Materials
Supplementary Figure 1: Scatterplot matrix of each of the top 5 principal components versus the others shown for the suicide attempters versus non-attempters. The top 5 principal components were calculated by Eigenstrat using data from 137,892 SNPs that were genotyped in common across the three combined datasets. The suicide attempters and non-attempters cluster well together yielding little evidence of stratification that might confound the association results.
Supplementary Figure 2: Q-Q plot of results from the genome-wide study of suicide attempters versus non-attempters. Results are from an analysis with mach2dat testing associations with each of the 2,408,051 observed and imputed SNPs under the additive model using logistic regression and controlling for the top 5 principal components and a dummy-coded variable indexing the three combined datasets. There is no excessive deviation of the observed results from the expected, and the estimated λ for genomic inflation was 1.01.
Supplemental Figure 3: Box-plots of microarray expression results for three ACP1 probes. Results for probes 201629_s_at, 201630_s_at, and 215227_x_at are based on the reanalysis of three Stanley Medical Research Institute (SMRI) gene expression microarray datasets from postmortem brains using 34 subjects with BP (14 with suicide and 20 without suicide). Intensity values are plotted on the Y- axis. The solid lines within the boxes represent the mean signal intensities, and the bars represent the 95% confidence intervals. Subjects 4 and 11, which have signal intensities below the 95% confidence interval, were included in the analysis.
Supplementary Table 1: Association Results for the top 2,507 SNPs with p < 0.001 identified in the primary attempted suicide association analysis. Likelihood ratio p-values are given for both the primary study (GAIN-BP, TGEN, and German samples) and the replication study (Wellcome Trust Case Control Consortium, STEP-BD and University College London samples). Odds ratios for both studies represent the risk for the minor allele using an additive model. Meta-analysis results for the combined samples are presented for SNPs with odds ratios in the same direction. Chromosome, base pair locations, and RefSeq gene locations were taken from the UCSC Genome Browser (March 2006). The genotyping status for each SNP is reported individually for each study (GAIN-BP, TGEN, and German samples) as imputed (I) or observed (O). Replication data was not available for 101 of the 2,507 SNPs. Table abbreviations: BP- base pair; Alleles – minor, major allele; CHR-chromosome
Supplementary Table 2: Results by sample for the top associated regions (p < 1 × 10⁻⁵) from the primary attempted suicide association analysis. Likelihood ratio p-values, odds ratios, and SNP genotyping status (observed or imputed) are given for the combined sample and for the GAIN-BP, TGEN, and German samples individually.
Supplementary Table 3: Association Results for the top 2,347 SNPs with p < 0.001 identified in the male-specific attempted suicide association analysis (GAIN-BP, TGEN, and German samples). The minor and major alleles, minor allele frequency, likelihood ratio p-value, and odds ratio are given for each SNP. Odds ratios represent the risk for the minor allele using an additive model. Chromosome, base pair locations, and RefSeq gene locations were taken from the UCSC Genome Browser (March 2006). The genotyping status for each SNP is reported individually for each study (GAIN-BP, TGEN, and German samples) as imputed (I) or observed (O). Table abbreviations: BP- base pair; Alleles – minor, major allele; MAF- minor allele frequency; CHR-chromosome
Supplementary Table 4: Association Results for the top 2,715 SNPs with p < 0.001 identified in the female-specific attempted suicide association analysis (GAIN-BP, TGEN, and German samples). The minor and major alleles, minor allele frequency, likelihood ratio p-value, and odds ratio are given for each SNP. Odds ratios represent the risk for the minor allele using an additive model. Chromosome, base pair locations, and RefSeq gene locations were taken from the UCSC Genome Browser (March 2006). The genotyping status for each SNP is reported individually for each study (GAIN-BP, TGEN, and German samples) as imputed (I) or observed (O). Table abbreviations: BP- base pair; Alleles minor, – major allele; MAF- minor allele frequency; CHR-chromosome
Supplementary Table 5: Association Results for the top 2,274 SNPs with p < 0.001 identified in the substance abuse/dependence attempted suicide association analysis (GAIN-BP and TGEN samples). The minor and major alleles, minor allele frequency, likelihood ratio p-value, and odds ratio are given for each SNP. Odds ratios represent the risk for the minor allele using an additive model. Chromosome, base pair locations, and RefSeq gene locations were taken from the UCSC Genome Browser (March 2006). The genotyping status for each SNP is reported individually for each study (GAIN-BP, TGEN, and German samples) as imputed (I) or observed (O). Table abbreviations: BP- base pair; Alleles – minor, major allele; MAF- minor allele frequency; CHR-chromosome
Supplementary Table 6: Association Results for the top 2,585 SNPs with p < 0.001 identified in the substance free attempted suicide association analysis (GAIN-BP and TGEN samples). The minor and major alleles, minor allele frequency, likelihood ratio p-value, and odds ratio are given for each SNP. Odds ratios represent the risk for the minor allele using an additive model. Chromosome, base pair locations, and RefSeq gene locations were taken from the UCSC Genome Browser (March 2006). The genotyping status for each SNP is reported individually for each study (GAIN-BP, TGEN, and German samples) as imputed (I) or observed (O). Table abbreviations: BP- base pair; Alleles – minor, major allele; MAF- minor allele frequency; CHR-chromosome