

Abstract
Subtype selective dopamine receptor ligands have long been sought after as therapeutic and/or imaging agents for the treatment and monitoring of neurologic disorders. We report herein on a combined structure- and ligand-based approach to explore the molecular mechanism of the subtype selectivity for a large class of D2-like dopamine receptor ligands (163 ligands in total). Homology models were built for both human D2l and D3 receptors in complex with haloperidol. Other ligands, which included multiple examples of substituted phenylpiperazines, were aligned against the binding conformations of haloperidol and three dimensional quantitative structure activity relationship (3D-QSAR) analyses were carried out. The receptor models show that although D2 and D3 share highly similar folds and 3D conformations, the slight sequence differences at their extracellular loop regions result in the binding cavity in D2 being comparably shallower than in D3, which may explain why some larger ligands bind with greater affinity at D3 compared to D2 receptors. The QSAR models show excellent correlation and high predictive power even when evaluated by the most stringent criteria. They confirm that the origins of subtype selectivity for the ligands arise primarily due to differences in the contours of the two binding sites. The predictive models suggest that while both steric and electrostatic interactions contribute to the compounds’ binding affinity, the major contribution arises from hydrophobic interactions, with hydrogen bonding conferring binding specificity. The current work provides clues for the development of more subtype selective dopamine receptor ligands. Furthermore, it demonstrates the possibility of being able to apply similar modeling methods to other subtypes or classes of receptors to study GPCR receptor-ligand interactions at a molecular level.
Keywords: Dopamine receptor, subtype selective, homology, molecular dynamics, CoMFA
INTRODUCTION
Dopamine receptors are members of a large class of G-protein coupled receptors (GPCRs) for biogenic amines which are essential for the normal activities of vertebrate central nervous systems (CNS). Dopaminergic neurotransmission is mediated by five receptor subtypes (D1-D5) in the CNS. Dysfunction of the cerebral dopaminergic system has been implicated in a variety of neurological and neuropsychiatric disorders, such as schizophrenia, Parkinson’s disease and drug addiction.1 Since it has been found that different subtype receptors play distinct pathological roles in the G-protein signaling pathways of these disorders, subtype selective ligands are desired for the development of CNS drugs and/or imaging agents for the treatment or diagnosis of neurological and neuropsychiatric diseases.2
Among the five subtypes of dopamine receptors that have been characterized, the D2, D3 and D4 receptors are classified as members of the D2-like family. There are two isoforms for D2 receptors: D2S (short) and D2l (long). D2 and D3 receptors share the greatest homology among the D2-like family, with more than 50% amino acid sequence identity overall, and 79% homology within the transmembrane (TM) domains.3 However, in the pursuit of pharmacotherapeutic agents with reduced side effects, or receptor subtype specific imaging agents, it would be desirable to have D2/D3 selective ligands because of their different pharmacological properties and neuroanatomical locations in the brain. The development of D2 and D3 receptor selective ligands has been a major research effort in many laboratories, and has resulted in the development of moderately selective ligands over the past few years.4-14 To further improve the selectivity of these lead compounds, structure-activity relationships have been studied using computational drug design approaches. However, the majority of work has focused on maximizing the selectivity for D2/D4 or D3/D4 subtypes, since D4 is more phylogenetically distant. So far the most D2/D3 selective ligands are about 100-fold selective and only one QSAR study examining this selectivity has been reported. Salama et al reported on QSAR studies using a data set of 79 D2/D3 receptor ligands, correlating their selectivity with 3D descriptors using CoMFA/CoMSIA approaches.14 The challenge to designing D2/D3 selective ligands is increased by the lack of x-ray diffraction structural data about the dopaminergic or even any aminergic receptors. As a result, the origin for the selectivity of the ligands remains elusive at a structural molecular level.
The recently reported crystal structure of the human β2-adrenergic receptor15-17 opens a new channel for the rational design of more subtype selective dopamine receptor ligands from a structure-based perspective. The β2-adrenergic receptor is more homologous to the dopamine receptors than bovine rhodopsin,18-20 which had previously been the sole available structure template for homology modeling of GPCRs. The comparison between bovine rhodopsin and β2-adrenergic receptor revealed important structural differences between rhodopsin and other class A GPCRs, particularly in the a) orientation and positions of the TM regions and b) structure of the loop regions,15, 21, 22 which are important for the ligand (agonist/antagonist) binding and activation of the receptors. Compared to bovine rhodopsin, the crystal structure of β2-adrenergic receptor provides a better template for homology modeling of dopamine receptors, because of its higher sequence identity/similarity to the latter, especially in the loops. Moreover, the structure of β2-adrenergic receptor contains a diffusible ligand carazolol, which is a partial inverse agonist. This makes it a notable template to study receptor-ligand interactions. Using the β2-adrenergic receptor as the template, several models of the dopamine receptors have been reported using different homology modeling approaches,13, 23, 24 and receptor-ligand interactions were evaluated at molecular level for some ligands.
In this work we report a combined structure- and ligand-based method to further explore the molecular mechanism of ligand selectivity for D2/D3 receptors. Homology models were built for both receptors complexed with haloperidol, using the crystal structures of both β2-adrenergic receptor and bovine rhodopsin as templates. Molecular dynamics simulations were performed to refine the models in explicit lipid bilayer/solvent environments. The conformations of haloperidol taken from the refined models were then used as templates to align a library of 162 compounds for further 3D-QSAR analyses. Predictive models were established by CoMSIA methods for both D2 and D3 receptors correlating the ligands’ affinities (Ki values). Overlay of the two receptor structures, along with the alignments of the whole ligand library at their active sites reveals several novel structural features of the receptor subtypes, shedding light on the origins of ligand selectivity for D2/D3 receptors at the molecular level.
MATERIALS AND METHODS
Homology Modeling of D2/D3 Receptors
The homology models of D2 or D3 receptors were obtained by comparative modeling in the program MODELLER9.225, using the crystal structure of the human β2-adrenergic GPCR (pdb code: 2RH1)15 and the bovine rhodopsin (pdb code: 1F88)18 as the templates. The sequence alignments were obtained by the automated sequence alignment program ClustalW226 with some manual adjustments in the loop regions to maximize homology. There are significant sequence diversities in the loop regions for the D2/D3 receptors, as well as for the templates, especially at the intracellular loop region 3 (IL3). For the crystal structure of β2-adrenergic receptor (pdb code: 2RH1), this region was replaced by T4 lysozyme to increase the solubility and stability of the receptor; while for rhodopsin, this loop is much shorter. Since the active site of the GPCRs is located in the extracellular region near loop2 (EL2), the IL3 loop is unlikely to play a major role in ligand binding. In order to improve the quality of the MODELLER results, it was removed from the modeling process for both of the targets. For EL2, the sequences of both D2 and D3 receptors are much shorter (total length only about 10 residues) than either the human β2-adrenergic receptor or bovine rhodopsin, and likely plays a critical role in forming the binding site for small molecular ligands.27 A conserved disulfide bond was built between EL2 and TM3 to rigidify the structure. Loop refining was automated by using the “very fast” refinement method within MODELLER. A total of 50 models per receptor subtype were obtained. The model with the lowest DOPE energy calculated by MODELLER was then picked and exported to SYBYL7.2 (Tripos International, St Louis, MO, USA) for further manipulation.
In SYBYL the bound ligand was modified manually to the D2/D3 antagonist, haloperidol. Hydrogen atoms were added to both the receptor and the ligand, treating the ligand as protonated. The structures were then minimized using the AMBER99 force field and the Gasteiger-Huckel partial charges for the ligand, with the protein backbone atoms fixed in position, to a gradient of 0.05 kcal/(mol•Å).
Model Refinement
The resulting model of haloperidol-bound D2 or D3 receptor was further refined by multiple molecular dynamics (MD) simulations28 in explicit membrane/solvent environments. A POPC lipid bilayer membrane patch (75Å × 75Å) was generated in VMD1.8.629. The protein was inserted into and combined with the membrane so that the lipid and water molecules overlapping with the protein were deleted. A 5Å layer of TIP3P water molecules was added in the directions above and below the membrane respectively, with an exclusion radii of 3.3Å to solvate the whole system. Counter-ions were also added to produce a salt concentration of 100mM. All the above manipulations were accomplished in VMD1.8.6.
The MD simulations were performed using the NAMD2.6 program30 with the all-atom CHARMM27 force field31, 32 following a published protocol33. Specifically, for each receptor a total of 10 copies of the system were prepared from the initial starting geometry. While each copy started with the same starting geometry different sampling paths were initiated by different seed numbers; the use of multiple copies allows for better sampling of the system. For each simulation copy, the following five rounds of equilibrations were completed: (i) 2,000 steps of energy minimization for the non-backbone atoms; (ii) five cycles of a 500-step energy minimization with decreasing position restraints (1, 0.8, 0.6, 0.4, 0.2) on the protein Cα atoms; (iii) a gradual increase in the temperature from 50° K to 310° K in 100,000 steps (100ps) of constant volume (NVT ensemble) simulation with restraints (with a force constant of 3 kcal/(mol•Å2)) applied to the protein Cα atoms; (iv) five 40,000 step (40 ps each, 200 ps in total) constant surface area ensemble MD equilibration with decreasing positional restraints on the Cα atoms; (v) 200,000 steps (200 ps) equilibration without any restraints. A total of 500 ps/copy were run for the equilibration steps. Another 1500 ps simulation/copy were run for the production step with the last 500 ps trajectory being collected and used for averaging the structure.
For each simulation copy, the time-averaged structure of the production run was obtained by removing water, lipid and ions from the structure and retaining only the protein and the bound ligand, aligning each frame (1000 frames for a 500 ps trajectory) to the first one and averaging the coordinates. The final averaged structure was obtained by aligning 9 different time-averaged structures from different copies of simulations to the first one and averaging the coordinates. This structure was then minimized by 500 steps to remove any short range repulsions. The minimized model was saved as the MD-refined, haloperidol-bound homology model of D2 or D3 receptor and used for the subsequent studies.
In the simulations, a cutoff of 12 Å was used for non-bonded interactions, and long-range electrostatic interactions were treated using the Particle Mesh Ewald (PME) method34. Langevin dynamics and a Langevin piston algorithm were used to maintain the temperature at 310K and a pressure of 1 atm. The r-RESPA multiple time step method35 was employed with a 1 fs time step for bonded atoms, a 2 fs step for short-range non-bonded atoms, and a 4 fs step for long-range electrostatic forces. The bonds between hydrogen and heavy atoms were constrained with the SHAKE algorithm.
Ligand Alignments
Besides haloperidol, the ligands investigated in this study include 162 compounds synthesized earlier by a) Mach and co-workers and b) the Newman group at the National Institute of Drug Abuse (NIDA-IRP).4-9 All ligands were evaluated for affinity on human D2/D3 receptors using competitive radioligand binding protocols with the radioligand 125I-IABN,4, 5, 36 thus ensuring consistency and comparability. The essential features of the scaffold include a) a protonated nitrogen on a non-aromatic cyclic ring (piperazine, piperidine, or tropane) (Region B), b) a heterocyclic appendage (Region D) attached to the basic nitrogen by a spacer (Region C), and c) an aromatic substituent (Region A) on the para-position of the piperazine/piperidine/tropane ring (Figure 1). The structure of the representative ligand, haloperidol is shown in Figure 1. The structures for all the compounds studied and their experimental Ki values are listed in Supplemental Information (Table 1).
Figure 1.

Structure of the previously reported D2/D3 ligands. Haloperidol is shown as the model ligand.
The time-averaged haloperidol conformations from the MD-refined receptor complexes were separated from the models and manually modified into a starting 3D conformation for each ligand in SYBYL. The starting conformations were then imported into Maestro 5.1 (Schrodinger, New York, NY, USA) and a conformer library for each ligand generated using the MCMM method found in MacroModel. ROCS 2.3.1 (OpenEye Scientific Software, Santa Fe, NM, USA) was used subsequently to retrieve the conformer from each library with the maximum shape alignment against the haloperidol reference structure. All the parameters were set to their default values. The program EON 2.0.1 (OpenEye Scientific Software, Santa Fe, NM, USA) was also employed to improve electrostatic overlap on the alignments by ROCS when necessary. This procedure was applied to obtain two different sets of ligand alignments for both the D2 and D3 binding sites, for the 3D-QSAR analysis described below.
3D-QSAR Analyses
The dataset consisting of the aligned conformations of the 162 ligands plus haloperidol (163 compounds total) was then divided into training (n=122) and test (n=41) sets for 3D-QSAR study. Since the experimental D2 and D3 activities varied significantly, different training/test sets were built for the two cases. For D2, the 41 ligands forming the test set were 6, 14, 17, 22, 23, 29, 31, 40, 43, 46, 50, 59, 62, 67, 68, 70, 73, 76, 82, 85, 86, 88, 90, 93, 95, 97, 103, 107, 109, 114, 117, 120, 126, 131, 137, 141, 142, 146, 154, 159, and 161. They were selected in such a way that their Ki values were randomly but uniformly distributed in the range of the values for the whole set so that the model’s predictive power could be effectively evaluated.
For D3, the 41 ligands forming the test set were 2, 3, 4, 8, 20, 21, 25, 33, 39, 55, 58, 64, 68, 69, 72, 75, 76, 77, 80, 81, 89, 91, 92, 93, 96, 97, 99, 100, 101, 109, 113, 119, 123, 131, 133, 143, 148, 149, 154, 159, and 163. The Gasteiger-Huckel partial charges were calculated for each ligand and used in the analyses. Several CoMSIA models were developed for the training set within the QSAR module of SYBYL using the default settings. The QSAR equations were calculated using the partial least-squares (PLS) algorithm. The cross-validated correlation coefficients R2 (commonly referred to as q2) were obtained by the leave-one-out (LOO) cross-validation technique. No column filtering was applied in any of the analyses. The predictive correlation coefficient (r2test) was determined by the predicted pKi versus the experimental observed values in the test set.
In order to thoroughly evaluate the models’ quality, a set of more rigorous criteria was used as suggested by Tropsha et al.37-39 For a predictive model tested in the test set, beside the r2test, the coefficient of determination40 and slope of regression lines when forcing the intercept through the origin are also needed to assess how far the predicted values deviated from the observed activities in the absolute scale. For a set of data (xi, yi), the coefficient of determination was calculated as the correlation coefficient R2 for a linear regression with the Y-intercept set to 0.0 (i.e., described by Y = KX), which is different from the conventional R2 for Y = KX +b. This test was incorporated because when actual vs. predicted activities were compared, an exact fit is required instead of just a linear correlation. An intercept would imply additional adjustment for the prediction, thus higher inaccuracy.
Coefficients of determination were calculated as for predicted versus observed activities, and for observed versus predicted activities. Slopes of regression lines, when forcing the intercept through origin, were also calculated as K for predicted versus observed activities, and K' for observed versus predicted activities. These statistical parameters were then compared with the recommended values to assess the QSAR models.38, 39
RESULTS AND DISCUSSION
Receptor Modeling
The initial structural homology models obtained with MODELLER were then extensively refined with MD simulations, using their native environment of a fully solvated lipid bilayer. The simulations were run for a total of 20 ns (10 copies with 2 ns each), which resulted in extensive sampling of the protein conformation in its native environment. The ligand haloperidol was also included in the receptor modeling based on the following reasons:
1) we are particularly interested in the ligand bound conformation of the receptors, i.e. to exploit the receptor structure to guide the design of more selective and potent ligands. Therefore we chose to build the ligand in situ to avoid a docking procedure. MD simulations were employed to effectively sample the conformational flexibility of both receptor and ligand in the context of each other.
2) haloperidol is a well characterized potent dopamine receptor antagonist. It binds to D2 and D3 receptor relatively non-selectively (1.1 nM versus 13 nM). An antagonist in complex with the dopamine receptors provides a prototype to study receptor-ligand interactions. The use of an antagonist is important for consistency with the experimental methods used to measure the binding affinities, the assays are run under conditions ensuring the receptor is in an inactive state.
3) haloperidol is of intermediate size in the large compound library that was studied. The published D2/D3 compounds consist of different sizes and lengths, with molecular weights ranging from 291 to 589, and volume ranging from 922 to 1464 (calculated in SYBYL). For the convenience of ligand alignment, an intermediate sized ligand would be a good template to overlay other ligands upon. Haloperidol also has 5 fully rotatable bonds, which makes it relatively rigid at the active site for easier sampling while flexible enough for other ligands to align on.
To validate the MD-refined models, the stereochemical quality of the structures were evaluated using PROCHECK.41 A comparison of the initial PROCHECK results and after MD refinement showed that the models’ stereochemical quality were greatly improved by the MD simulations (Table 2). For both the D2 and D3 receptors, >90% of backbone dihedral angles now reside in the core regions, in contrast to 80% before refinement. Only one residue in the refined D2 structure now falls in the disallowed regions of the Ramachandran plot.42 It is actually located at the truncated cytoplasmic end of TM6, near the truncated loop IL3, distal from the orthosteric binding site. This deviation was, therefore, left unchanged.
Table 2.
The distribution (in percentage) of the backbone dihedral angles on Ramachandran’s plot for the receptor models before and after MD refinements.
| % Distribution |
||||
|---|---|---|---|---|
| Model | Core | Allowed | Generous | Disallowed |
| D2 (before) | 85.0 | 13.0 | 1.2 | 0.8 |
| D2 (after) | 92.5 | 5.1 | 2.0 | 0.4 |
| D3 (before) | 84.5 | 11.2 | 2.8 | 1.6 |
| D3 (after) | 94.0 | 4.4 | 1.6 | 0.0 |
The important role of EL2 has been emphasized for ligand binding of class A GPCRs,15, 20, 43 its modeling is, therefore, a critical component for a reliable receptor structure. The sequence length for EL2 varies widely within the class A GPCRs, which makes it a challenging task to successfully develop a homology model. In one recent work, the EL2 of dopamine receptors were modeled by modifying the sequence of it in human β2-adrenergic receptor into the dopamine receptors, using a loop database and refined by MD simulations (in vacuo).13 In other models of dopamine receptors, the refinements were performed in a similar manner,23, 24 focusing on the EL2 regions alone without a thorough sampling of the surrounding residues, especially the TM regions.
The MD-refined haloperidol bound D2/D3 receptor structures are shown in Figure 2. Compared with the structure before refinement, there are considerably large structure rearrangements for the receptor, especially in the loop regions, for both D2 and D3. A major characteristic movement, pertinent to ligand binding, is the retraction of EL2 away from EL1. The N-terminal of EL2, which is more hydrophilic than the C-terminal, (D2: NNADQNE, D3: TTGDPT), lifts upward to interact with the extracellular solvents, while the C-terminal portion of EL2 goes into the binding site making a hydrophobic contour capable of interacting with the ligand. The conserved disulfide linkage between TM3 and EL2 restricts the position of EL2.
Figure 2.

The models of D2/D3 receptors before and after MD refinements shown in cartoon representation. The TM regions and EL1 and 2 are labeled. a) D2 receptor before (magenta) and after (green) refinements. b) D3 receptor before (yellow) and after (blue) refinements.
Another observation is the rearrangement of the ligand at the orthosteric site (Figure 3). In D2, some minor adjustments of the ligand are observed. The para-fluoro phenyl end of haloperidol tilts towards TM7 from the TM2/7 cleft, making a bend from its previous linear binding conformation. In contrast, in D3 there is penetration of the para-chloro phenyl ring of the ligand deeper into the binding pocket. Examination of the D2 counterpart reveals that a cysteine residue (C3.36) resides in this location, making the ligand penetration impossible in D2. Although D2 and D3 share almost identical sequence for TM3, the adjacent EL1 for D3 is one residue shorter than D2 (D2: GGVWNFS, D3: GEWKFS). As a consequence, the TM3 helix of D3 twists towards the extracellular end compared to D2, forcing the same residue C3.36 in D3 to shift away from the binding pocket, creating an empty space for the ligand to occupy (Figure 4). An estimation of the volume of the binding site44 indicates that the binding site is 30-50% larger in D3 than D2. The binding crevice is, therefore, more accessible to the extracellular aqueous solvent at D2. The ligand selectivity for the two subtype receptors could partially result from a difference in the size of the two binding pockets. Our models suggest that, although D2 and D3 share a very high sequence identity in the TM regions, which make up most of the binding sites, different compositions of the loop regions could affect the contour and topography of the binding pockets leading to binding selectivity. This effect was not unprecedented. In a comparison of the β1 and β2 adrenergic receptor crystal structures, it was observed that differences at distant receptor sites could confer subtype selectivity by influencing the conserved residues’ conformations, kinetics and dynamics.17, 45
Figure 3.

Close up view of the orthosteric sites before and after refinements for D2 and D3. Haloperidol is shown in stick model. a) D2 receptor before (magenta) and after (green) refinements. b) D3 receptor before (yellow) and after (blue) refinements. c) D3 overlaid with D2.
Figure 4.

A comparison of the binding sites in D2 and D3. For clarity, TM6 and TM7 are removed. Haloperidol and the C3.36 residue are shown in stick model. A) D2; b) D3; c) D3 overlaid with D2.
Receptor-ligand Interactions
Figure 5 shows the ligand haloperidol binding at the orthosteric site making extensive interactions with the receptors. The prominent salt bridge between the highly conserved Asp3.32 of the receptor and the protonated nitrogen on the piperidine scaffold of the ligand is responsible for the anchorage of the ligand. The ligand orientation is an L shape in D2, with the para-chloro phenyl ring tilting towards TM4, and the para-fluoro phenyl moiety bending towards TM7. The para-chloro phenyl end is tightly flanked by residues of the aromatic clusters (W6.48, F6.51, F6.52 and H6.55) on TM6, the hydrophobic core (V3.33 and C3.36) of TM3 and the hydrophobic residues (I183 and I184) on EL2. In addition to the salt bridge, there is a hydrogen bond between the hydroxyl substituent on the piperidium ring of haloperidol and the side chain of Y7.35 on D2. Besides that, S5.42 and S5.46 are also within close proximity of the para-chloro phenyl ring. Therefore, if there is donor/acceptor substituent on the ring, it could also contribute to binding selectivity by hydrogen bonding with the serine residues deep within the pocket. At the other end of the ligand, the para-fluoro phenyl moiety is relatively flexible, extending to the open cleft between TM2/7. In contrast for the D3 receptor the orientation of the ligand is almost linearly parallel with the axis of TM3, with a slight rotation of the para-fluoro phenyl plane along the TM2 axis. The hydrophobic binding contour for the D3 receptor consists of W6.48, F6.51, F6.52 and H6.55 on TM6, V3.33, C3.36 and I3.40 of TM3 and I183 on EL2. The binding site on D3 looks like a tunnel, with the ligand fitting inside in a rod-like orientation. The ligands with longer spacer chains are better accommodated in the D3 than D2 binding site. Since the ligand is buried deeper, no hydrogen bond can be established between the hydroxyl group and any residue on D3. Although Y7.35 is a conserved residue, it is too far away to establish a hydrogen bond with the hydroxyl group on haloperidol. The S5.42 and S5.46 residues, especially S5.42 are also out of hydrogen bonding range. The importance of the hydroxyl substituent on the ligand as well as Y7.35 on D2 for the their binding has been reported before7, 46, 47 and is confirmed in our receptor model. No other specific interaction is present between the ligand and receptor residues for both receptors. However, the binding pocket is delineated by the hydrophobic residues of TM2/3/6/7 and EL2, which could confer ligand selectivity by creating subtle differences in the binding site topography.
Figure 5.

Interactions of the receptor residues with haloperidol. The important residues are shown in stick model and labeled. a) hydrophobic interactions on D2; b) hydrogen bonding on D2; c) hydrophobic interactions on D3; c) hydrogen bonding on D3.
The analysis of receptor-ligand interactions confirms that most residues at the binding site are conserved, yet structurally (3-dimensionally) dissimilar between the D2 and D3 receptors. Consequently, using the receptor models to design ligands with greater ligand selectivity remains a challenging task. However, our comparative modeling studies suggest that consideration of the overall binding site contours, instead of individual residues on the receptors, will be required to further optimize the lead compounds for binding selectivity.
Ligand Alignments
Establishing a suitable alignment is the most crucial step to successfully building a 3D-QSAR model, especially for a large set of structurally diverse ligands. In our work, the ligand alignments were achieved by using the ROCS program to overlay a conformer library for each ligand upon the bound conformation of haloperidol, retrieving the conformation with the maximum pharmacophore overlap with the query (haloperidol), based on matching both 3D shape and chemistry. A good superposition of the conserved protonated amine of all the ligands over that of haloperidol was used as a prerequisite to establish the alignments. Since ROCS only uses the heavy atoms of a ligand, the protons on the amines were not taken into consideration for shape superimposition. EON was also used to refine the ROCS hits by electrostatic similarity. Nevertheless, sometimes the output still returned the top scoring hit with a mismatched H atom at the amine terminal. In this case, the nitrogen center was manually inverted and another round of conformer generation-ROCS alignment-EON refinement was carried out. This iteration process was repeated multiple times until a satisfactory alignment (visual inspection) was achieved for the particular ligand. For a ligand L1 with large structural deviation from haloperidol, a straightforwardly precise superimposition with haloperidol could be difficult to obtain or determine. To deal with this situation, a second ligand L2, which is more similar with the target ligand L1, but previously aligned with haloperidol, was then used as the query structure instead to obtain the alignment for the target (L1).
The superimposition for all the 163 ligands is depicted in Figure 6(a) and (b), respectively, along with the orthosteric sites of the MD refined D2 and D3 receptor model. As the primary recognition element, the central moiety, which could be piperazium, piperidium, or tropanium, is responsible for securing the overall orientation of the whole ligand. For the alignments in D2, it was observed that ligands make a “bend” toward the TM2/7 cleft at the heterocyclic appendage end. For ligands with a shorter spacer, the bent orientation seems to result in a tighter fit to the binding pocket. Those with longer alkyl spacer make a sharper turn, possibly disfavoring the adoption of this orientation. Multiple SAR studies have found that shortening of the spacer resulted in preferential D2 binding over D3.3, 7, 8, 12-14 The alignments produced from our models again suggest that the smaller ligands are more D2 selective because of the shallower binding pocket of D2. In the models for D3, the binding site in the TM5/6 region is deeper. Therefore, the ligands penetrate more and adopt a more extended, linear conformation, making extensive interactions with the receptor residues. This may be the basis for why longer ligands tend to be are more selective for D3 compared to D2 receptors.
Figure 6.

Alignments for the 163 ligands obtained by ROCS shown in the binding site on the receptors. Atom color scheme: C, yellow; O, red; N, blue; S, orange; Cl, yellow; F, grey; Br, maroon; and I, purple. Hydrogen atoms are un-displayed.
3D-QSAR Models
The CoMFA and CoMSIA models were derived from the 121 ligands in the training set, for D2 and D3 receptors, respectively. To explore the effect of various fields on the predictability of the models, three separate CoMSIA models were built using different combinations of steric, electrostatic, hydrophobic, and hydrogen bond (donor and acceptor) fields. The PLS analysis results are summarized in Table 3. For the D2 models, the statistical indices are reasonably high, with CoMSIA model 3 having the best cross-validated q2. This indicates that all models have good predictability. For the D3 models, the three COMSIA models have even higher cross-validated q2, demonstrating their predictive power. The high statistical values indicate that the alignment reflects the natural binding conformations of the ligands, and it lays the foundation of a reliable QSAR model.
Table 3.
Results from CoMSIA models for the training set of the two alignments on D2/D3 receptors.
| % Contribution |
||||||||||
|---|---|---|---|---|---|---|---|---|---|---|
| Recepto r |
Model | r2 | q2 | SEE | F | PC |
Steric |
Electro- static |
Hydro - phobic |
H-bond (D/A) |
| CoMSIA1 | 0.896 | 0.509 | 0.267 | 139.7 | 7 | 9.0 | 14.7 | 33.7 | 17.8/24.7 | |
| D2 | CoMSIA2 | 0.878 | 0.552 | 0.288 | 117.7 | 7 | 11.2 | 20.5 | 41.8 | 26.5/- |
| CoMSIA3 | 0.839 | 0.586 | 0.330 | 100.0 | 6 | 14.1 | 31.1 | 54.8 | - | |
| CoMSIA1 | 0.926 | 0.752 | 0.349 | 289.3 | 5 | 9.0 | 15.4 | 26.2 | 28.4/21.0 | |
| D3 | CoMSIA2 | 0.876 | 0.757 | 0.449 | 206.5 | 4 | 19.0 | 32.4 | 48.5 | - |
| CoMSIA3 | 0.844 | 0.759 | 0.502 | 212.1 | 3 | 42.6 | 57.4 | - | - | |
r2: non-cross-validated correlation coefficient; q2: cross-validated correlation coefficient; SEE: standard error of estimation; PC: principal component number; D: hydrogen bond donor; A: hydrogen bond acceptor
Validation is always a crucial step in QSAR modeling. It has been found that the widely accepted LOO cross-validated q2 is inadequate to assess the predictive ability of the QSAR models,37 since some models based on the training set with randomized affinities appeared to have high q2 values, but showed low predictive power to an external test set. This could be explained by a chance correlation or structural redundancy.48 Therefore, we set out to validate the models by predicting the binding affinities of the compounds in the test set using the above models. The results are reported in Table 4. A set of rigorous criteria have been suggested for the evaluation of a QSAR model, including calculating the coefficients of determination40 ( and ) and slopes of regression (K and K') when forcing the intercept to pass through the origin. A QSAR model has been concluded to have an acceptable predictive power if the following conditions are satisfied:37-39 (i) q2 > 0.5; (ii) > 0.6; (iii) <0.1 and 0.85 ≤ K ≤ 1.15 or < 0.1 and 0.85 ≤ K'≤ 1.15, (iv) < 0.3. Therefore, the predicted values of the test set in Table 4 were also used to calculate , , K and K' as reported in Table 5. Figure 7 shows the corresponding plots of the calculated versus the experimental values for the training set and the test set of the three models for D2 and D3 respectively. For the test set, the fittings between the predictive versus experimental values and experimental versus predictive values (the calculation of and K') are illustrated in Figures 8 and 9 for the D2 and D3 models, respectively. It is clear that all the above conditions are satisfied by each model in our studies, for both D2 and D3 receptor subtypes. Since they behave almost equally well for the external test set in predicting the ligands’ binding affinity, any of the models could be applied alternatively in evaluating a new compound’s activity for a thorough prediction. If all the models collectively suggest a compound has high affinity for a particular receptor subtype, it is very likely to be a potent ligand.
Table 4.
Predicted affinities of the test set utilizing the three CoMSIA models.
| D2 | D3 | ||||||||||||||
|---|---|---|---|---|---|---|---|---|---|---|---|---|---|---|---|
|
| |||||||||||||||
| Exp.a
pKi |
CoMSIA1 | CoMSIA2 | CoMSIA3 | Exp. pKi |
CoMSIA1 | CoMSIA2 | CoMSIA3 | ||||||||
|
|
|
||||||||||||||
| Ligand | Pred.b | Resi.c | Pred. | Resi. | Pred. | Resi. | Ligand | Pred. | Resi. | Pred. | Resi. | Pred. | Resi. | ||
| 6 | 8.638 | 7.962 | −0.676 | 8.010 | −0.628 | 8.211 | −0.428 | 2 | 6.983 | 6.389 | −0.595 | 6.380 | −0.603 | 6.187 | −0.796 |
| 14 | 6.693 | 6.432 | −0.260 | 6.319 | −0.373 | 6.433 | −0.260 | 3 | 6.602 | 6.479 | −0.123 | 6.491 | −0.111 | 6.351 | −0.251 |
| 17 | 7.499 | 7.682 | 0.183 | 7.831 | 0.332 | 7.489 | −0.010 | 4 | 6.690 | 6.449 | −0.241 | 6.374 | −0.316 | 6.155 | −0.536 |
| 22 | 7.668 | 7.729 | 0.061 | 7.676 | 0.009 | 7.730 | 0.063 | 8 | 6.195 | 5.913 | −0.282 | 6.161 | −0.034 | 6.013 | −0.182 |
| 23 | 7.264 | 7.540 | 0.276 | 7.610 | 0.347 | 7.392 | 0.129 | 20 | 8.377 | 8.843 | 0.466 | 8.984 | 0.607 | 9.001 | 0.625 |
| 29 | 7.943 | 7.592 | −0.351 | 7.631 | −0.313 | 7.699 | −0.244 | 21 | 9.046 | 8.947 | −0.099 | 9.224 | 0.178 | 9.213 | 0.167 |
| 31 | 7.403 | 7.329 | −0.075 | 7.322 | −0.082 | 7.413 | 0.010 | 25 | 8.886 | 8.686 | −0.200 | 8.944 | 0.058 | 8.894 | 0.008 |
| 40 | 6.364 | 6.494 | 0.131 | 6.351 | −0.012 | 6.415 | 0.052 | 33 | 9.155 | 9.180 | 0.025 | 9.147 | −0.008 | 8.952 | −0.203 |
| 43 | 7.327 | 6.486 | −0.841 | 6.464 | −0.863 | 6.404 | −0.923 | 39 | 8.583 | 8.581 | −0.002 | 8.787 | 0.203 | 8.783 | 0.199 |
| 46 | 5.975 | 6.333 | 0.358 | 6.249 | 0.274 | 6.278 | 0.303 | 55 | 9.585 | 9.094 | −0.491 | 8.973 | −0.612 | 8.820 | −0.765 |
| 50 | 6.206 | 6.409 | 0.203 | 6.422 | 0.216 | 6.604 | 0.397 | 58 | 8.197 | 7.233 | −0.965 | 7.344 | −0.854 | 7.364 | −0.834 |
| 59 | 6.264 | 6.242 | −0.022 | 5.998 | −0.266 | 6.190 | −0.074 | 64 | 7.072 | 7.274 | 0.202 | 7.505 | 0.433 | 7.369 | 0.297 |
| 62 | 5.684 | 6.616 | 0.932 | 6.697 | 1.013 | 6.632 | 0.948 | 68 | 7.747 | 8.700 | 0.953 | 8.222 | 0.475 | 7.869 | 0.122 |
| 67 | 7.889 | 7.886 | −0.003 | 7.905 | 0.016 | 7.810 | −0.080 | 69 | 6.366 | 7.928 | 1.562 | 7.707 | 1.341 | 7.580 | 1.214 |
| 68 | 7.526 | 7.752 | 0.226 | 7.900 | 0.374 | 7.795 | 0.269 | 72 | 7.492 | 8.143 | 0.651 | 8.155 | 0.663 | 8.442 | 0.950 |
| 70 | 8.975 | 8.677 | −0.298 | 8.685 | −0.290 | 8.624 | −0.351 | 75 | 8.678 | 8.367 | −0.311 | 8.496 | −0.182 | 8.727 | 0.050 |
| 73 | 8.310 | 8.326 | 0.017 | 8.273 | −0.037 | 8.175 | −0.135 | 76 | 9.432 | 8.939 | −0.493 | 8.763 | −0.669 | 8.989 | −0.443 |
| 76 | 8.921 | 8.204 | −0.717 | 8.142 | −0.779 | 8.252 | −0.669 | 77 | 8.076 | 8.427 | 0.352 | 8.430 | 0.354 | 8.453 | 0.377 |
| 82 | 7.030 | 7.164 | 0.134 | 7.081 | 0.051 | 6.957 | −0.073 | 80 | 9.398 | 9.614 | 0.216 | 9.522 | 0.124 | 9.342 | −0.056 |
| 85 | 7.627 | 7.139 | −0.488 | 7.010 | −0.617 | 7.040 | −0.587 | 81 | 8.824 | 8.791 | −0.033 | 8.638 | −0.186 | 8.929 | 0.105 |
| 86 | 6.979 | 7.004 | 0.026 | 6.892 | −0.087 | 6.777 | −0.202 | 89 | 7.308 | 7.360 | 0.052 | 7.030 | −0.278 | 6.944 | −0.364 |
| 88 | 7.588 | 7.190 | −0.399 | 7.109 | −0.480 | 6.999 | −0.589 | 91 | 8.921 | 8.501 | −0.419 | 8.743 | −0.178 | 8.948 | 0.027 |
| 90 | 7.161 | 7.333 | 0.172 | 7.303 | 0.141 | 7.042 | −0.119 | 92 | 8.523 | 8.973 | 0.451 | 8.598 | 0.075 | 8.705 | 0.182 |
| 93 | 6.496 | 6.150 | −0.346 | 6.226 | −0.270 | 6.256 | −0.240 | 93 | 8.745 | 8.722 | −0.023 | 8.455 | −0.290 | 8.698 | −0.047 |
| 95 | 6.604 | 6.333 | −0.270 | 6.491 | −0.113 | 6.738 | 0.134 | 96 | 7.932 | 7.664 | −0.268 | 8.429 | 0.497 | 8.327 | 0.395 |
| 97 | 7.547 | 7.667 | 0.120 | 7.302 | −0.245 | 7.225 | −0.322 | 97 | 9.301 | 9.326 | 0.025 | 9.250 | −0.051 | 8.963 | −0.338 |
| 103 | 7.583 | 6.738 | −0.845 | 6.616 | −0.967 | 6.338 | −1.245 | 99 | 8.886 | 8.501 | −0.385 | 8.770 | −0.116 | 8.866 | −0.020 |
| 107 | 6.896 | 6.992 | 0.096 | 6.875 | −0.021 | 6.786 | −0.110 | 100 | 9.000 | 8.416 | −0.584 | 9.126 | 0.126 | 8.876 | −0.124 |
| 109 | 6.752 | 6.674 | −0.078 | 6.591 | −0.161 | 6.442 | −0.310 | 101 | 6.796 | 8.539 | 1.743 | 8.988 | 2.192 | 8.822 | 2.026 |
| 114 | 5.370 | 5.139 | −0.232 | 4.883 | −0.487 | 4.996 | −0.374 | 109 | 5.672 | 6.017 | 0.345 | 6.028 | 0.357 | 6.018 | 0.347 |
| 117 | 7.080 | 6.579 | −0.501 | 6.748 | −0.333 | 7.029 | −0.051 | 113 | 5.261 | 6.126 | 0.865 | 5.933 | 0.672 | 6.315 | 1.054 |
| 120 | 7.222 | 7.214 | −0.008 | 6.848 | −0.374 | 6.840 | −0.382 | 119 | 6.165 | 6.915 | 0.750 | 6.667 | 0.502 | 6.438 | 0.273 |
| 126 | 7.813 | 7.462 | −0.350 | 7.526 | −0.287 | 7.533 | −0.280 | 123 | 6.975 | 6.113 | −0.862 | 6.205 | −0.770 | 6.157 | −0.818 |
| 131 | 7.268 | 7.627 | 0.359 | 7.807 | 0.540 | 7.769 | 0.501 | 131 | 6.857 | 7.441 | 0.584 | 7.359 | 0.502 | 7.322 | 0.465 |
| 137 | 7.991 | 8.065 | 0.073 | 8.007 | 0.016 | 8.025 | 0.033 | 133 | 6.312 | 7.611 | 1.300 | 7.028 | 0.717 | 6.778 | 0.466 |
| 141 | 7.551 | 8.319 | 0.767 | 8.258 | 0.706 | 8.225 | 0.674 | 143 | 9.222 | 8.258 | −0.964 | 8.604 | −0.617 | 8.594 | −0.628 |
| 142 | 7.451 | 7.429 | −0.022 | 7.412 | −0.039 | 7.357 | −0.094 | 148 | 8.469 | 8.616 | 0.147 | 8.814 | 0.345 | 8.611 | 0.142 |
| 146 | 8.181 | 7.672 | −0.509 | 7.864 | −0.317 | 7.934 | −0.247 | 149 | 8.638 | 8.635 | −0.003 | 8.651 | 0.012 | 8.536 | −0.102 |
| 154 | 7.708 | 7.298 | −0.409 | 7.363 | −0.345 | 7.530 | −0.178 | 154 | 8.602 | 8.687 | 0.084 | 8.649 | 0.047 | 8.546 | −0.056 |
| 159 | 8.097 | 7.942 | −0.155 | 7.618 | −0.478 | 7.624 | −0.473 | 159 | 9.523 | 9.231 | −0.292 | 8.940 | −0.583 | 8.875 | −0.648 |
| 161 | 6.827 | 7.417 | 0.591 | 7.287 | 0.460 | 7.441 | 0.615 | 163 | 9.097 | 8.713 | −0.384 | 8.590 | −0.507 | 8.540 | −0.557 |
Exp. refers to experimentally measured pKi.
Pred. refers to predicted pKi.
Resi. refers to the corresponding difference between the predicted and measured pKi.
Table 5.
Statistical results from the three CoMSIA models each for the two receptors.
| Receptor | Model | r2 | q2 | r2 test | K | K' | |||||
|---|---|---|---|---|---|---|---|---|---|---|---|
| CoMSIAl | 0.896 | 0.509 | 0.757 | 0.710 | 0.987 | 0.062 | 0.754 | 1.010 | 0.004 | 0.044 | |
| D2 | CoMSIA2 | 0.878 | 0.552 | 0.740 | 0.710 | 0.982 | 0.041 | 0.729 | 1.015 | 0.015 | 0.019 |
| CoMSIA3 | 0.839 | 0.586 | 0.740 | 0.699 | 0.981 | 0.055 | 0.734 | 1.016 | 0.008 | 0.035 | |
| CoMSIA1 | 0.926 | 0.752 | 0.733 | 0.639 | 1.003 | 0.128 | 0.733 | 0.992 | 0.000 | 0.094 | |
| D3 | CoMSIA2 | 0.876 | 0.757 | 0.765 | 0.698 | 1.006 | 0.088 | 0.765 | 0.989 | 0.000 | 0.067 |
| CoMSIA3 | 0.844 | 0.759 | 0.764 | 0.710 | 1.001 | 0.071 | 0.764 | 0.994 | 0.001 | 0.054 |
Figure 7.

QSAR modeling. Experimentally measured pKi versus the fitted values for the training-set compounds (○) and the predicted values for the test-set compounds (■) from the CoMSIA model 1, 2 and 3 for D2 and D3.
Figure 8.

QSAR modeling. Observed vs. predicted and predicted vs. observed pKi by the CoMSIA model 1, 2 and 3, using the test set. Two regression results, with (solid line) or without (dashed line) forcing the intercept to be zero are shown for each dataset for D2.
Figure 9.

QSAR modeling. Observed vs. predicted and predicted vs. observed pKi by the CoMSIA model 1, 2 and 3, using the test set. Two regression results, with (solid line) or without (dashed line) forcing the intercept to be zero are shown for each dataset for D3.
To further validate the models, different selections of molecules making up the test and training sets or different test set and training set size were also evaluated. Very similar QSAR models, with about the same predictive power, were produced (results not shown), indicating that the models are robust and the results are informative for interpreting molecular interactions.
Figures 10 and 11 show illustrations of the molecular fields from the model which contains all the contributing factors (CoMSIA1) for D2 and D3 receptors, respectively, with the ligand haloperidol rendered within the fields. From the D2 receptor models, the contribution breakdown suggests that hydrophobic interactions are the major determinant factor for the compounds’ binding affinities, while steric interactions play a minimal role. For the D3 models, although less important, hydrophobic interactions are still the most important contribution to the compounds’ binding. Hydrogen bonding also contributes a large portion to the binding affinity in both D2 and D3, which may reinforce the binding selectivity of some ligands. A side by side comparison of the steric maps shows that the binding crevice is deeper in D3, as it favors more bulky groups all around and deep beneath the para-chloro phenyl ring. In contrast, the D2 site only favors some substitutions on the ring, or along the spacer on the heterocyclic appendage (para-fluoro phenyl ring), since the site is more open in this region. The hydrophobic maps show that the ligands are intrinsically hydrophobic, with a little preference of hydrophilic property inside the cavity. It is not desirable for the D2 receptor to have more hydrogen bond donating substituents near the hydroxyl substituent on the piperidium group of haloperidol, since the hydroxyl group could be a donor interacting with the D2 receptor (Y7.35) with high affinity. On D3 this interaction is absent, consistent with previous receptor models showing that a hydroxyl substituent on the piperidium ring is a critical pharmacophore for the selectivity between the two receptor subtypes. The CoMSIA results agree with the receptor models in probing the difference of the binding sites and mapping the molecular fingerprints of the ligands that discriminate between the two receptors. Furthermore it provides valuable information to optimize the lead compounds in order to develop more potent and/or selective ligands.
Figure 10.

Molecular field maps derived from the model (CoMSIA1) of D2, with ligand haloperidol illustrated. Contours of the steric map are shown in a); electrostatic map in b); hydrophobic map in c); hydrogen bond donor in d); and hydrogen bond acceptor in e). Atom color scheme: C, grey (3) or green (34); O, red; N, blue; S, yellow. Hydrogen atoms are un-displayed. The contours are displayed at 80% favored and 20% disfavored level. Increased binding affinity is correlated with: more bulk near green, less bulk near yellow in the steric map; more positive charge near blue, more negative charge near red in the electrostatic map; more hydrophobic near orange, less hydrophobic near violet in the hydrophobic map; more hydrogen bond donor (on the receptor) near cyan, less hydrogen bond donor near purple in the hydrogen bond donor map; more hydrogen bond acceptor (on the receptor) near magenta, and less hydrogen bond acceptor near red in the hydrogen bond acceptor map.
Figure 11.

Molecular field maps derived from the model (CoMSIA1) of D3, with ligand haloperidol illustrated. Figure caption is the same as in Figure 10.
Previously only limited molecular modeling studies have been reported on the selectivity of dopamine receptor ligands. These studies have focused on the D2 receptor, using either structure or ligand based methods. In the earlier reported work, the 3D models of the D2 receptors were constructed either by using the bovine rhodposin structure as the template for homology modeling43, 47, 49, 50 or using ab initio theoretical and computational techniques.51 The resultant models were, therefore, not accurate enough for evaluating receptor-ligand interactions quantitatively. Even for the homology models based on the more closely related β2-adrenergic receptor,13, 23, 24, 52 comparing the D2 receptor structure with the highly homologous D3 receptor would be problematic without extensive model refinements, since the difference between the two receptor subtypes could be subtle. The analysis of our refined D2/D3 models suggests that substantial structural changes are observed in the refinement process, indicating that comprehensive refinements are necessary to discern the difference at the binding sites. In the ligand based studies, most of the QSAR models were built from training sets consisting of small number of ligands or structurally very similar ligands, not thoroughly validated, or not very statistically predictive.14, 53-55
CONCLUSIONS
In this work, we have utilized both structure and ligand-based approaches of homology modeling and 3D-QSAR to explore the intermolecular interactions of a large library of ligands with dopamine D2/D3 receptors. Our goal was to establish molecular models capable of explaining the mechanism of binding selectivity for the two highly homologous receptor subtypes. The combination of the two approaches and utilization of a large diverse compound library allowed the exploration of the molecular basis of subtype selectivity, by 1) obtaining reliable 3D models of prototypical ligand bound D2/D3 receptor complexes, 2) using the ligand bound conformation to guide the alignments for the compound library, and 3) deriving highly predictive QSAR models based on the ligand alignments.
The developed QSAR models included ligands with diverse structures, and highly variable binding affinities spanning 5 orders of magnitude (mM to sub-nM range), while still achieving excellent results correlating the 3D molecular fields with their binding affinities on the two receptors. Our work sheds light on how different sequence compositions, especially in the extracellular loop regions of the receptors, can lead to differences in size and contouring properties of the orthosteric sites, which in turn results in recognition preferences. The work should be beneficial in seeking more potent and/or selective dopamine D2/D3 receptor ligands, and it is also expandable to other dopamine receptor subtypes in the pursuit of small molecular modulators and/or imaging agents for neurologic disorders.
Supplementary Material
Table 1.
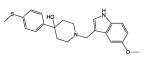
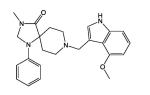
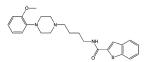
Selected ligands and experimental binding affinities (Ki) of the 163 ligands used in this study. All values represent the average of multiple determinations as reported in literature.4-9 (See supplemental Table 1 for a complete listing of all 163).
| Ligand | Chemical Structure | D2 (nM) |
D3 (nM) |
|---|---|---|---|
| 1 |

|
1.1 | 13 |
| 9 |
|
5.5 | 580 |
| 11 |
|
101 | 150 |
| 22 |
|
21.5 | 0.2 |
| 32 |

|
24.1 | 1 |
| 35 |

|
0.05 | 0.3 |
| 46 |

|
1060 | 5.21 |
| 61 |

|
196 | 224 |
| 90 |

|
69 | 2.9 |
| 121 |
|
58.8 | 724 |
The compound number refers to the compounds as they are listed in the supplementary Table of all 162 compound that were used for this evaluation. The Ki values (nMolar) were determined using competitive radioligand binding protocols. Human D2I or D3 receptors expressed in stably trnasfected HEK-293 cells and the radioligand 125 l-IABN were used used for these binding studies. The concentration of 125 l-IABN that was used was approximately equal to the Kd values for D2 (0.04 nM )and D3 (0.03 nM) dopamine receptors and the compounds were evaluated over a 5-order of magnitude dose range in triplicate using two concentrations per decade. IC50 values for the competition curves were determined using the computer program TABLECURVE. IC50 values were converted to Ki values. The Ki values shown represent the mean values for n ≥ 3 determinations.
ACKNOWLEDGMENT
This work was support by the following grants R01 DA13584-03S1 (RRL) and R01 DA23957-01 (RRL and RHM) and R01 DA029840-01 (RHM and RRL).
Footnotes
Supporting Information Available. The structures of the receptor models and the molecules in their alignments used in the QSAR study are available as pdb, and mol2 files respectively. A supplementary Table 1 containing the complete set of ligand structures and Ki values is also available. This material is available free of charge via the Internet at http://pubs.acs.org.
REFERENCES
- 1.Girault JA, Greengard P. The neurobiology of dopamine signaling. Arch Neurol. 2004;61:641–4. doi: 10.1001/archneur.61.5.641. [DOI] [PubMed] [Google Scholar]
- 2.Zhang A, Neumeyer JL, Baldessarini RJ. Recent progress in development of dopamine receptor subtype-selective agents: potential therapeutics for neurological and psychiatric disorders. Chem Rev. 2007;107:274–302. doi: 10.1021/cr050263h. [DOI] [PubMed] [Google Scholar]
- 3.Boeckler F, Gmeiner P. Dopamine D3 receptor ligands: recent advances in the control of subtype selectivity and intrinsic activity. Biochim Biophys Acta. 2007;1768:871–87. doi: 10.1016/j.bbamem.2006.12.001. [DOI] [PubMed] [Google Scholar]
- 4.Chu W, Tu Z, McElveen E, Xu J, Taylor M, Luedtke RR, Mach RH. Synthesis and in vitro binding of N-phenyl piperazine analogs as potential dopamine D3 receptor ligands. Bioorg Med Chem. 2005;13:77–87. doi: 10.1016/j.bmc.2004.09.054. [DOI] [PubMed] [Google Scholar]
- 5.Grundt P, Carlson EE, Cao J, Bennett CJ, McElveen E, Taylor M, Luedtke RR, Newman AH. Novel heterocyclic trans olefin analogues of N-{4-[4-(2,3-dichlorophenyl)piperazin-1-yl]butyl}arylcarboxamides as selective probes with high affinity for the dopamine D3 receptor. J Med Chem. 2005;48:839–48. doi: 10.1021/jm049465g. [DOI] [PubMed] [Google Scholar]
- 6.Vangveravong S, McElveen E, Taylor M, Xu J, Tu Z, Luedtke RR, Mach RH. Synthesis and characterization of selective dopamine D2 receptor antagonists. Bioorg Med Chem. 2006;14:815–25. doi: 10.1016/j.bmc.2005.09.008. [DOI] [PubMed] [Google Scholar]
- 7.Grundt P, Husband SL, Luedtke RR, Taylor M, Newman AH. Analogues of the dopamine D2 receptor antagonist L741,626: Binding, function, and SAR. Bioorg Med Chem Lett. 2007;17:745–9. doi: 10.1016/j.bmcl.2006.10.076. [DOI] [PMC free article] [PubMed] [Google Scholar]
- 8.Paul NM, Taylor M, Kumar R, Deschamps JR, Luedtke RR, Newman AH. Structure-activity relationships for a novel series of dopamine D2-like receptor ligands based on N-substituted 3-aryl-8-azabicyclo[3.2.1]octan-3-ol. J Med Chem. 2008;51:6095–109. doi: 10.1021/jm800532x. [DOI] [PMC free article] [PubMed] [Google Scholar]
- 9.Newman AH, Grundt P, Cyriac G, Deschamps JR, Taylor M, Kumar R, Ho D, Luedtke RR. N-(4-(4-(2,3-dichloro- or 2-methoxyphenyl)piperazin-1-yl)butyl)heterobiarylcarboxamides with functionalized linking chains as high affinity and enantioselective D3 receptor antagonists. J Med Chem. 2009;52:2559–70. doi: 10.1021/jm900095y. [DOI] [PMC free article] [PubMed] [Google Scholar]
- 10.Bettinetti L, Schlotter K, Hubner H, Gmeiner P. Interactive SAR studies: rational discovery of super-potent and highly selective dopamine D3 receptor antagonists and partial agonists. J Med Chem. 2002;45:4594–7. doi: 10.1021/jm025558r. [DOI] [PubMed] [Google Scholar]
- 11.Hocke C, Prante O, Lober S, Hubner H, Gmeiner P, Kuwert T. Synthesis and radioiodination of selective ligands for the dopamine D3 receptor subtype. Bioorg Med Chem Lett. 2004;14:3963–6. doi: 10.1016/j.bmcl.2004.05.052. [DOI] [PubMed] [Google Scholar]
- 12.Bettinetti L, Hubner H, Gmeiner P. Chirospecific and subtype selective dopamine receptor binding of heterocyclic methoxynaphthamide analogs. Arch Pharm (Weinheim) 2005;338:276–80. doi: 10.1002/ardp.200400997. [DOI] [PubMed] [Google Scholar]
- 13.Ehrlich K, Gotz A, Bollinger S, Tschammer N, Bettinetti L, Harterich S, Hubner H, Lanig H, Gmeiner P. Dopamine D2, D3, and D4 selective phenylpiperazines as molecular probes to explore the origins of subtype specific receptor binding. J Med Chem. 2009;52:4923–35. doi: 10.1021/jm900690y. [DOI] [PubMed] [Google Scholar]
- 14.Salama I, Hocke C, Utz W, Prante O, Boeckler F, Hubner H, Kuwert T, Gmeiner P. Structure-selectivity investigations of D2-like receptor ligands by CoMFA and CoMSIA guiding the discovery of D3 selective PET radioligands. J Med Chem. 2007;50:489–500. doi: 10.1021/jm0611152. [DOI] [PubMed] [Google Scholar]
- 15.Cherezov V, Rosenbaum DM, Hanson MA, Rasmussen SG, Thian FS, Kobilka TS, Choi HJ, Kuhn P, Weis WI, Kobilka BK, Stevens RC. High-resolution crystal structure of an engineered human beta2-adrenergic G protein-coupled receptor. Science. 2007;318:1258–65. doi: 10.1126/science.1150577. [DOI] [PMC free article] [PubMed] [Google Scholar]
- 16.Rasmussen SG, Choi HJ, Rosenbaum DM, Kobilka TS, Thian FS, Edwards PC, Burghammer M, Ratnala VR, Sanishvili R, Fischetti RF, Schertler GF, Weis WI, Kobilka BK. Crystal structure of the human beta2 adrenergic G-protein-coupled receptor. Nature. 2007;450:383–7. doi: 10.1038/nature06325. [DOI] [PubMed] [Google Scholar]
- 17.Rosenbaum DM, Cherezov V, Hanson MA, Rasmussen SG, Thian FS, Kobilka TS, Choi HJ, Yao XJ, Weis WI, Stevens RC, Kobilka BK. GPCR engineering yields high-resolution structural insights into beta2-adrenergic receptor function. Science. 2007;318:1266–73. doi: 10.1126/science.1150609. [DOI] [PubMed] [Google Scholar]
- 18.Palczewski K, Kumasaka T, Hori T, Behnke CA, Motoshima H, Fox BA, Le Trong I, Teller DC, Okada T, Stenkamp RE, Yamamoto M, Miyano M. Crystal structure of rhodopsin: A G protein-coupled receptor. Science. 2000;289:739–45. doi: 10.1126/science.289.5480.739. [DOI] [PubMed] [Google Scholar]
- 19.Okada T, Fujiyoshi Y, Silow M, Navarro J, Landau EM, Shichida Y. Functional role of internal water molecules in rhodopsin revealed by X-ray crystallography. Proc Natl Acad Sci U S A. 2002;99:5982–7. doi: 10.1073/pnas.082666399. [DOI] [PMC free article] [PubMed] [Google Scholar]
- 20.Okada T, Sugihara M, Bondar AN, Elstner M, Entel P, Buss V. The retinal conformation and its environment in rhodopsin in light of a new 2.2 A crystal structure. J Mol Biol. 2004;342:571–83. doi: 10.1016/j.jmb.2004.07.044. [DOI] [PubMed] [Google Scholar]
- 21.Michino M, Abola E, Brooks CL, Dixon JS, Moult J, Stevens RC. Community-wide assessment of GPCR structure modelling and ligand docking: GPCR Dock 2008. Nat Rev Drug Discov. (3rd) 2009;8:455–63. doi: 10.1038/nrd2877. [DOI] [PMC free article] [PubMed] [Google Scholar]
- 22.Topiol S, Sabio M. X-ray structure breakthroughs in the GPCR transmembrane region. Biochem Pharmacol. 2009;78:11–20. doi: 10.1016/j.bcp.2009.02.012. [DOI] [PubMed] [Google Scholar]
- 23.Selent J, Lopez L, Sanz F, Pastor M. Multi-receptor binding profile of clozapine and olanzapine: a structural study based on the new beta2 adrenergic receptor template. ChemMedChem. 2008;3:1194–8. doi: 10.1002/cmdc.200800074. [DOI] [PubMed] [Google Scholar]
- 24.McRobb FM, Capuano B, Crosby IT, Chalmers DK, Yuriev E. Homology modeling and docking evaluation of aminergic G protein-coupled receptors. J Chem Inf Model. 2010;50:626–37. doi: 10.1021/ci900444q. [DOI] [PubMed] [Google Scholar]
- 25.Marti-Renom MA, Stuart AC, Fiser A, Sanchez R, Melo F, Sali A. Comparative protein structure modeling of genes and genomes. Annu Rev Biophys Biomol Struct. 2000;29:291–325. doi: 10.1146/annurev.biophys.29.1.291. [DOI] [PubMed] [Google Scholar]
- 26.Larkin MA, Blackshields G, Brown NP, Chenna R, McGettigan PA, McWilliam H, Valentin F, Wallace IM, Wilm A, Lopez R, Thompson JD, Gibson TJ, Higgins DG. Clustal W and Clustal X version 2.0. Bioinformatics. 2007;23:2947–8. doi: 10.1093/bioinformatics/btm404. [DOI] [PubMed] [Google Scholar]
- 27.Shi L, Javitch JA. The binding site of aminergic G protein-coupled receptors: the transmembrane segments and second extracellular loop. Annu Rev Pharmacol Toxicol. 2002;42:437–67. doi: 10.1146/annurev.pharmtox.42.091101.144224. [DOI] [PubMed] [Google Scholar]
- 28.Caves LS, Evanseck JD, Karplus M. Locally accessible conformations of proteins: multiple molecular dynamics simulations of crambin. Protein Sci. 1998;7:649–66. doi: 10.1002/pro.5560070314. [DOI] [PMC free article] [PubMed] [Google Scholar]
- 29.Humphrey W, Dalke A, Schulten K. VMD: visual molecular dynamics. J Mol Graph. 1996;14:33–8. doi: 10.1016/0263-7855(96)00018-5. 27-8. [DOI] [PubMed] [Google Scholar]
- 30.Phillips JC, Braun R, Wang W, Gumbart J, Tajkhorshid E, Villa E, Chipot C, Skeel RD, Kale L, Schulten K. Scalable molecular dynamics with NAMD. J Comput Chem. 2005;26:1781–802. doi: 10.1002/jcc.20289. [DOI] [PMC free article] [PubMed] [Google Scholar]
- 31.MacKerell AD, Bashford D, Bellott M, Dunbrack RL, Evanseck JD, Field MJ, Fischer S, Gao J, Guo H, Ha S, Joseph-McCarthy D, Kuchnir L, Kuczera K, Lau FTK, Mattos C, Michnick S, Ngo T, Nguyen DT, Prodhom B, Reiher WE, Roux B, Schlenkrich M, Smith JC, Stote R, Straub J, Watanabe M, Wiorkiewicz-Kuczera J, Yin D, Karplus M. All-atom empirical potential for molecular modeling and dynamics studies of proteins. Journal of Physical Chemistry B. 1998;102:3586–3616. doi: 10.1021/jp973084f. [DOI] [PubMed] [Google Scholar]
- 32.Mackerell AD, Jr., Feig M, Brooks CL. Extending the treatment of backbone energetics in protein force fields: limitations of gas-phase quantum mechanics in reproducing protein conformational distributions in molecular dynamics simulations. J Comput Chem. (3rd) 2004;25:1400–15. doi: 10.1002/jcc.20065. [DOI] [PubMed] [Google Scholar]
- 33.Wang HL, Cheng X, Taylor P, McCammon JA, Sine SM. Control of cation permeation through the nicotinic receptor channel. PLoS Comput Biol. 2008;4:e41. doi: 10.1371/journal.pcbi.0040041. [DOI] [PMC free article] [PubMed] [Google Scholar]
- 34.Darden T, York D, Pedersen L. Particle Mesh Ewald - an N.Log(N) Method for Ewald Sums in Large Systems. Journal of Chemical Physics. 1993;98:10089–10092. [Google Scholar]
- 35.Tuckerman M, Berne BJ, Martyna GJ. Reversible Multiple Time Scale Molecular-Dynamics. Journal of Chemical Physics. 1992;97:1990–2001. [Google Scholar]
- 36.Luedtke RR, Freeman RA, Boundy VA, Martin MW, Huang Y, Mach RH. Characterization of (125)I-IABN, a novel azabicyclononane benzamide selective for D2-like dopamine receptors. Synapse. 2000;38:438–49. doi: 10.1002/1098-2396(20001215)38:4<438::AID-SYN9>3.0.CO;2-5. [DOI] [PubMed] [Google Scholar]
- 37.Golbraikh A, Tropsha A. Beware of q2! J Mol Graph Model. 2002;20:269–76. doi: 10.1016/s1093-3263(01)00123-1. [DOI] [PubMed] [Google Scholar]
- 38.Golbraikh A, Shen M, Xiao Z, Xiao YD, Lee KH, Tropsha A. Rational selection of training and test sets for the development of validated QSAR models. J Comput Aided Mol Des. 2003;17:241–53. doi: 10.1023/a:1025386326946. [DOI] [PubMed] [Google Scholar]
- 39.Tropsha A, Golbraikh A. Predictive QSAR modeling workflow, model applicability domains, and virtual screening. Curr Pharm Des. 2007;13:3494–504. doi: 10.2174/138161207782794257. [DOI] [PubMed] [Google Scholar]
- 40.Sachs L. Applied Statistics. A Handbook of Techniques. Springer-Verlag; 1984. p. 349. [Google Scholar]
- 41.Laskowski RA, MacArthur MW, Moss DS, Thornton JM. PROCHECK: A program to check the stereochemical quality of protein structures. J Appl Crystallogr. 1993;26:283–291. [Google Scholar]
- 42.Ramachandran GN, Ramakrishnan C, Sasisekharan V. Stereochemistry of polypeptide chain configurations. J Mol Biol. 1963;7:95–9. doi: 10.1016/s0022-2836(63)80023-6. [DOI] [PubMed] [Google Scholar]
- 43.Shi L, Javitch JA. The second extracellular loop of the dopamine D2 receptor lines the binding-site crevice. Proc Natl Acad Sci U S A. 2004;101:440–5. doi: 10.1073/pnas.2237265100. [DOI] [PMC free article] [PubMed] [Google Scholar]
- 44.Brady GP, Jr., Stouten PF. Fast prediction and visualization of protein binding pockets with PASS. J Comput Aided Mol Des. 2000;14:383–401. doi: 10.1023/a:1008124202956. [DOI] [PubMed] [Google Scholar]
- 45.Warne T, Serrano-Vega MJ, Baker JG, Moukhametzianov R, Edwards PC, Henderson R, Leslie AG, Tate CG, Schertler GF. Structure of a beta1-adrenergic G-protein-coupled receptor. Nature. 2008;454:486–91. doi: 10.1038/nature07101. [DOI] [PMC free article] [PubMed] [Google Scholar]
- 46.Kulagowski JJ, Broughton HB, Curtis NR, Mawer IM, Ridgill MP, Baker R, Emms F, Freedman SB, Marwood R, Patel S, Patel S, Ragan CI, Leeson PD. 3-((4-(4-Chlorophenyl)piperazin-1-yl)-methyl)-1H-pyrrolo-2,3-b-pyridine: an antagonist with high affinity and selectivity for the human dopamine D4 receptor. J Med Chem. 1996;39:1941–2. doi: 10.1021/jm9600712. [DOI] [PubMed] [Google Scholar]
- 47.Simpson MM, Ballesteros JA, Chiappa V, Chen J, Suehiro M, Hartman DS, Godel T, Snyder LA, Sakmar TP, Javitch JA. Dopamine D4/D2 receptor selectivity is determined by A divergent aromatic microdomain contained within the second, third, and seventh membrane-spanning segments. Mol Pharmacol. 1999;56:1116–26. doi: 10.1124/mol.56.6.1116. [DOI] [PubMed] [Google Scholar]
- 48.Clark RD, Sprous DG, Leonard JM. Validating models based on large dataset. In: Holtje HD, Sippl W, editors. 13th European Symposium on Quantitative Structure-Activity Relationships. Prous Sci.; 2001. 2001. pp. 475–485. [Google Scholar]
- 49.Neve KA, Cumbay MG, Thompson KR, Yang R, Buck DC, Watts VJ, DuRand CJ, Teeter MM. Modeling and mutational analysis of a putative sodium-binding pocket on the dopamine D2 receptor. Mol Pharmacol. 2001;60:373–81. doi: 10.1124/mol.60.2.373. [DOI] [PubMed] [Google Scholar]
- 50.Lan H, Durand CJ, Teeter MM, Neve KA. Structural determinants of pharmacological specificity between D(1) and D(2) dopamine receptors. Mol Pharmacol. 2006;69:185–94. doi: 10.1124/mol.105.017244. [DOI] [PubMed] [Google Scholar]
- 51.Kalani MY, Vaidehi N, Hall SE, Trabanino RJ, Freddolino PL, Kalani MA, Floriano WB, Kam VW, Goddard WA. The predicted 3D structure of the human D2 dopamine receptor and the binding site and binding affinities for agonists and antagonists. Proc Natl Acad Sci U S A. (3rd) 2004;101:3815–20. doi: 10.1073/pnas.0400100101. [DOI] [PMC free article] [PubMed] [Google Scholar]
- 52.Ericksen SS, Cummings DF, Weinstein H, Schetz JA. Ligand selectivity of D2 dopamine receptors is modulated by changes in local dynamics produced by sodium binding. J Pharmacol Exp Ther. 2009;328:40–54. doi: 10.1124/jpet.108.141531. [DOI] [PMC free article] [PubMed] [Google Scholar]
- 53.Nilsson J, Homan EJ, Smilde AK, Grol CJ, Wikstrom H. A multiway 3D QSAR analysis of a series of (S)-N-[(1-ethyl-2-pyrrolidinyl)methyl]-6-methoxybenzamides. J Comput Aided Mol Des. 1998;12:81–93. doi: 10.1023/a:1007977010551. [DOI] [PubMed] [Google Scholar]
- 54.Hansch C, Verma RP, Kurup A, Mekapati SB. The role of QSAR in dopamine interactions. Bioorg Med Chem Lett. 2005;15:2149–57. doi: 10.1016/j.bmcl.2005.02.012. [DOI] [PubMed] [Google Scholar]
- 55.Samanta S, Debnath B, Gayen S, Ghosh B, Basu A, Srikanth K, Jha T. QSAR modeling on dopamine D2 receptor binding affinity of 6-methoxy benzamides. Farmaco. 2005;60:818–25. doi: 10.1016/j.farmac.2005.06.018. [DOI] [PubMed] [Google Scholar]
Associated Data
This section collects any data citations, data availability statements, or supplementary materials included in this article.