Abstract
A mitochondrial matrix-specific p53 construct (termed p53–290) in HepG2 cells was utilized to determine the impact of p53 in the mitochondrial matrix following oxidative stress. H2O2 exposure reduced cellular proliferation similarly in both p53–290 and vector cells, and p53–290 cells demonstrating decreased cell viability at 1 mM H2O2 (~85% viable). Mitochondrial DNA (mtDNA) abundance was decreased in a dose-dependent manner in p53–290 cells while no change was observed in vector cells. Oximetric analysis revealed reduced maximal respiration and reserve capacity in p53–290 cells. Our results demonstrate that mitochondrial matrix p53 sensitizes cells to oxidative stress by reducing mtDNA abundance and mitochondrial function.
Keywords: Mitochondrial DNA, Oxidative stress, Oximetry, p53
1. Introduction
Tumor suppressor protein p53 is a well-characterized modulator of cellular processes (Efeyan and Serrano, 2007; Lanni et al., 2012). From transcriptional control to cell cycle regulation, p53 is an important regulator of cellular homeostasis and damage response in the nucleus (Bieging and Attardi, 2012; Reinhardt and Schumacher, 2012; Tokino and Nakamura, 2000). However, scientific attention has focused a role for p53 outside the nuclear compartment and in the context of the mitochondria.
Compartmentally, protein interactions in the mitochondria can be considered as interactions that occur on the “outside” of the mitochondria and those that occur within the mitochondrial matrix. p53 is an important regulator of the intrinsic apoptotic pathway and thus impacts the outer mitochondrial membrane (Marchenko et al., 2007; Vaseva and Moll, 2009). While the characterization of the outer-mitochondrial membrane p53 interactions has been extensive and ongoing, less attention has been focused on the function of p53within the mitochondrial matrix. p53 is capable of crossing the mitochondrial membranes and entering the matrix (Achanta et al., 2005; Mahyar-Roemer et al., 2004). There, p53 can interact with mitochondrial DNA (mtDNA) directly at the site of DNA damage (Achanta et al., 2005; Bakhanashvili et al., 2008). Studies have suggested that p53 can augment mtDNA repair but they did not characterize the impact of this intramitochondrial interaction on electron transport. Experimental studies that might elucidate such functions are confounded by p53 effects on the nuclear compartment from the strong nuclear localization signal sequence inherent to p53 (Liang and Clarke, 1999, 2001).
We previously characterized a novel p53 construct that over-expresses p53 exclusively within the mitochondrial matrix (Koczor et al., 2012). This construct contains: 1) the mitochondrial targeting sequence from ornithine transcarbamylase attached to the N-terminus of WT-p53, and 2) truncation of the nuclear localization sequence (amino acids 291–393) in the C-terminus of WT-p53. This construct, termed p53–290, demonstrated that mitochondrial matrix p53 sensitizes cells to antiretroviral compounds ddC (2′,3′-dideoxycytidine) and ddI (2′,3′-dideoxyinosine) (Koczor et al., 2012). Due to the increased risk of oxidative stress-induced mtDNA damage as a result of leakage from the electron transport chain, we next explored the impact of mitochondrial p53 in presence of chemically-induced oxidative stress with H2O2 exposure (McKenzie et al., 2004). Results demonstrate that mitochondrial p53 decreased mtDNA abundance andmitochondrial function following H2O2. We conclude that translocation of p53 to the mitochondria sensitizes cells to oxidative stress, decreases mitochondrial electron transport reserve capacity, and facilitates cell death.
2. Materials and methods
2.1. Mitochondrial p53 construct design
Mitochondrial matrix-targeted p53 was designed as previously described (Koczor et al., 2012). Briefly, site-directed mutagenesis (Stratagene/Agilent, Santa Clara, CA) was utilized to introduce BsiWI restriction sites around the nuclear localization sequence contained in the C-terminal portion of WT p53 (amino acids 291–393) of a commercially available WT p53 plasmid (Clontech, Mountain View, CA). The C-terminal region was restriction digested, ligated, and sequenced to ensure fidelity. The validated construct was stably transfected into HepG2 cells (American Type Culture Collection, Manassas, VA). Vector-only HepG2 cells were used as controls. G418 (600 µg/mL — Lonza, Hopkinton, MA) was used to select for positive colonies. Transfected HepG2 cells were grown in complete medium consisting of Eagle's minimal essential medium (Fisher Scientific, Waltham, MA) with 10% fetal bovine serum (Hyclone, Invitrogen/Life Sciences, Grand Island, NY) and penicillin-streptomycin (Invitrogen) at 37 °C and 5% CO2.
2.2. Cell proliferation and viability
H2O2 was obtained from Fisher Scientific. Cells were plated at 1 × 10⁵ cells per well in a six-well dish. Cells were allowed to proliferate for 24 hours in the absence of H2O2. After the initial 24 hours, media were aspirated from the cells, and H2O2 (100 µM, 250 µM, 500 µM, and 1 mM) prepared in Earles Basic Salt Solution (Fisher Scientific) was added to cells. Cells were incubated at 37 °C for 1 hour in the presence of H2O2. Following exposure, medium was aspirated, and fresh complete media was added to the cells. Cells were allowed to proliferate for 24 hours at 37 °C. After 24 hours, cells were collected by trypsinization and counted using the trypan blue exclusion assay and a hemocytometer.
2.3. mtDNA abundance
Cells were plated at 1 × 10⁵ cells per well in a six-well dish. Cells were allowed to proliferate for 24 hours in the absence of H2O2. After the initial 24 hours, media were aspirated from the cells, and H2O2 (100 µM, 250 µM, 500 µM, and 1 mM) prepared in Earles Basic Salt Solution was added to cells. Cells were incubated at 37 °C for 1 hour in the presence of H2O2. Following exposure, medium was aspirated, and fresh complete media was added to the cells. Cells were allowed to proliferate for 24 hours at 37 °C. Subsequently, the cells were lysed using 1× Tris-EDTA with 30 µg/mL of proteinase K (Invitrogen) and 0.5% SDS. Samples were allowed to lyse for 24 hours at 37 °C. After lysis, the DNA was extracted from each sample using the MagNA Pure LC (Roche). The resulting DNA samples were quantitated and analyzed for mtDNA abundance using the Lightcycler 480 (Roche). Nuclear DNA was amplified using the single-copy POLG2 nuclear gene (forward, 5′-AGCTGTTGACGGAAAGGAG-3′; reverse,5′-CAGAAG AGAATCCCGGCTAA-3′), and mtDNA was amplified using the COXI mitochondrial gene (forward, 5′-TTCGCCGACCGTTGACTATT-3′; reverse, 5′-AAGATTATTACAAATGCATGGGC-3′).
2.4. Oximetric analysis
Oximetry and analysis were performed using an XF24 extracellular flux analyzer (Seahorse Bioscience, Billerica, MA) using methods described by the manufacturer. HepG2 vector and p53–290 cells were seeded at 3 × 10⁴ cells per well and were allowed to grow for 24 hours in normal growth media. After the initial 24 hours, cells were exposed to H2O2 (100 µM, 250 µM, 500 µM, and 1 mM)for 1 hour at 37 °C. After incubation, H2O2 was removed and fresh complete media were placed on the cells for 24 hours. After 24 hours, media were aspirated from the XF24 wells, unbuffered Dulbecco's modified Eagle's medium (Seahorse Bioscience) was supplemented with 4 mmol/L glucose (Sigma-Aldrich), and 1 mmol/L sodium pyruvate (Sigma-Aldrich) was added to each well. Cells were allowed to equilibrate in the newmedia for 30 minutes before analysis by the XF24 system. Cells were sequentially exposed to oligomycin (1 µg/mL; Sigma-Aldrich), fluoro-carbonyl cyanide phenyl-hydrazone (FCCP-1.0 µmol/L; Sigma-Aldrich), and rotenone (2.0 µmol/L; Sigma-Aldrich) to determine cellular and mitochondrial oxygen consumption rates (OCRs). Data are expressed as a pmol/min/105 cells. Results from these experiments were used to determine basal respiration, proton leakage (defined as the difference between the OCR following oligomycin exposure and nonmitochondrial OCR after rotenone treatment), maximal respiration (defined as the maximum OCR after fluoro-carbonyl cyanide phenylhydrazone [FCCP] uncoupling), reserve capacity (defined as the difference between the maximum respiration OCR and the basal respiration OCR), and the respiratory control ratio (defined as the ratio of the maximum OCR after FCCP uncoupling to the OCR following oligomycin exposure).
2.5. Statistical analysis
All experiments were performed with n ≥ 3, with significance determined using a one-way analysis of variance or a two-tailed Student's t-test, where appropriate, with P < 0.05 (GraphPad Prism, La Jolla, CA). A Tukey post hoc test was performed for each data set, along with a Grubbs test to determine outliers.
3. Results
This study exploited a novel p53 construct that overexpresses p53 that is targeted within the mitochondrial matrix (Koczor et al., 2012). This was accomplished because the construct capitalized on the addition of a mitochondrial targeting sequence on the N-terminal side of human p53 while simultaneously removing the region encoding amino acids 291–393 to eliminate intrinsic nuclear localization of native p53 polypeptide (Fig. 1). This novel construct, termed p53–290, was stably transfected into HepG2 cells which enabled exploration of mitochondrial p53 function intramitochondrially. Previously published work by our group demonstrated overexpression of p53–290 selectively localized to the mitochondria (Koczor et al., 2012).
Fig. 1.

Mitochondrial matrix p53 construct. Mitochondrial matrix p53 (termed p53–290) was generated using site directed mutagenesis to introduce BsiWi restriction enzyme site around the C-terminal nuclear localization sequence inherent to p53 (291–393 region, shown with slanted lines). Restriction digestion and subsequent ligation enable truncation of the 291–393 amino acid region of p53. The mitochondrial targeting sequence (MTS) was obtained from ornithine transcarbamylase and ligated to the N-terminus.
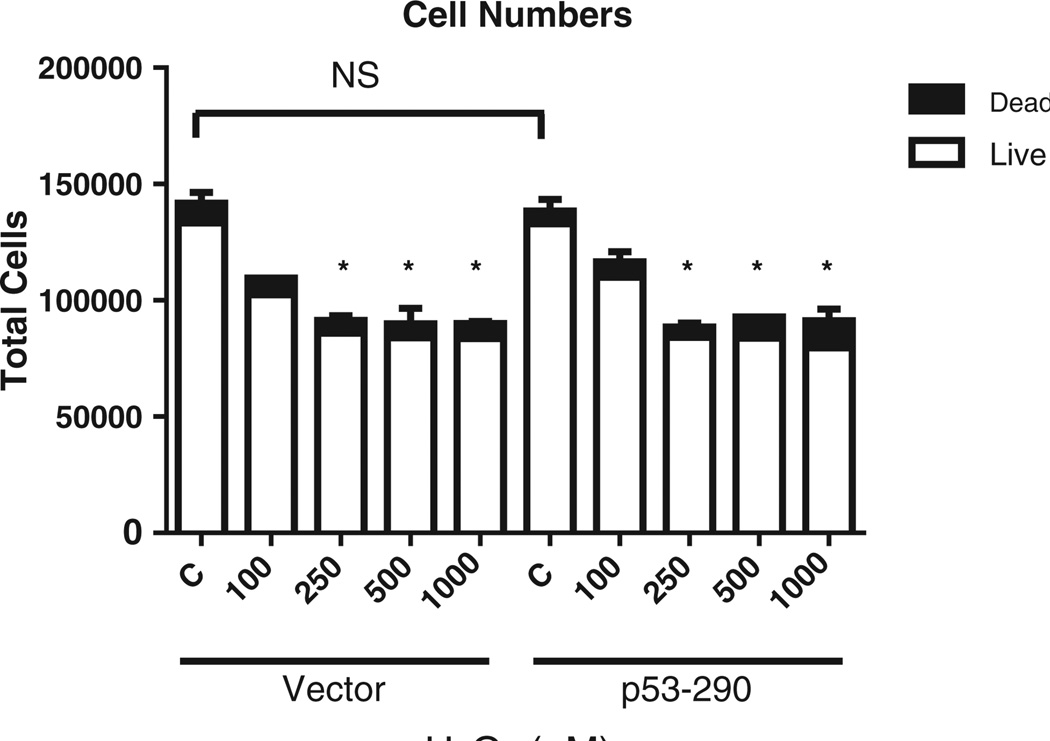
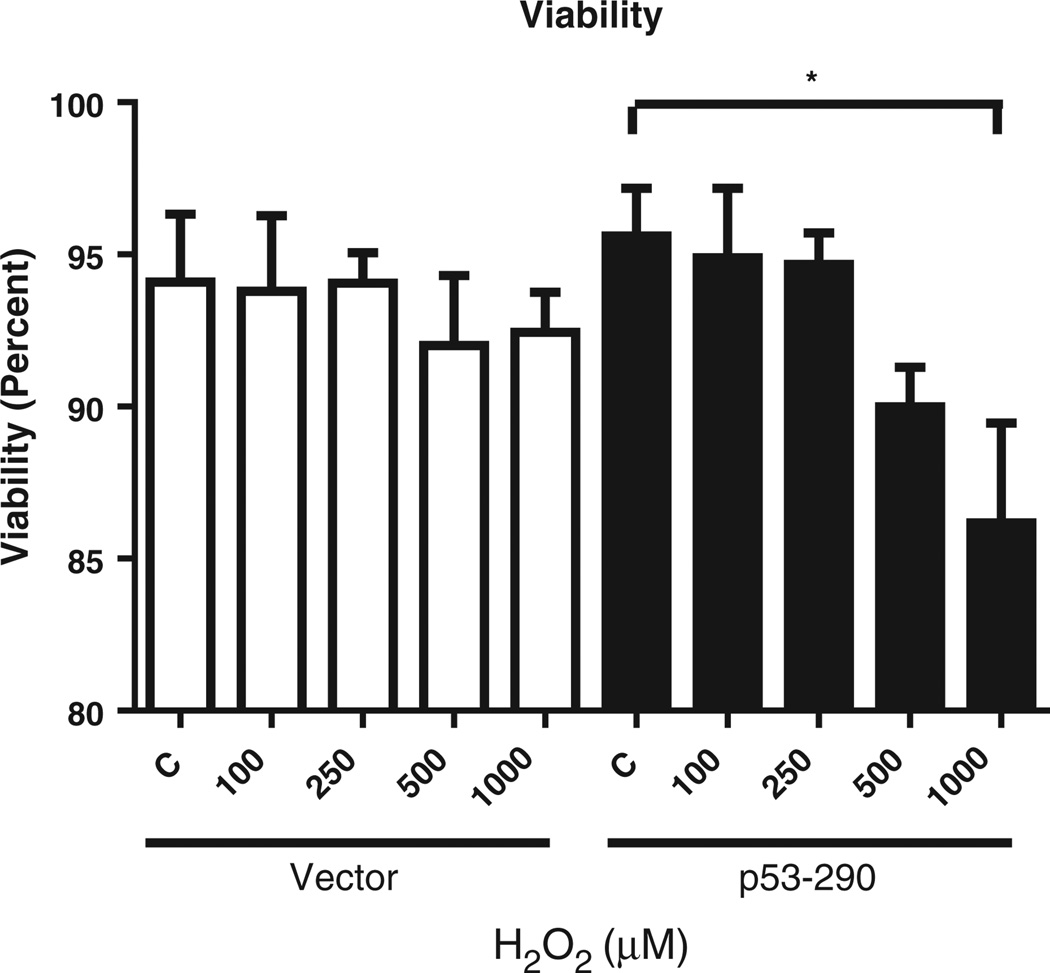
To determine the effects of enhanced oxidative stress on cells overexpressing mitochondrial p53, we created a biochemical oxidative milieu. Cells (p53–290 and vector cells) were treated with a range of H2O2 concentrations for 1 hour to establish a dose effect of oxidative stress in this system. We found a decrease in cellular proliferation as determined by trypan blue exclusion assays (Fig. 2). Exposure to 100 µMH2O2 reduced cell proliferation in p53–290 and vector cells. Exposure to 250 µM, 500 µM, and 1 mM H2O2 inhibited cellular proliferation of both p53–290 and vector. The viability of the cells remained unchanged at 100 µM and 250 µM H2O2 in p53–290 and vector (Fig. 3). However, cell viability decreased in p53–290 cells at 500 µM and 1 mM H2O2 while no change was observed in vector cells. These results demonstrate that p53–290 cells are more sensitive to H2O2 exposure than vector cells.
Fig. 2.
Cellular proliferation. P53–290 and vector-only HepG2 cells were exposed to H2O2 for 1 hour, and the cells were allowed to proliferate for 24 hours before being collected and counted. Cell counts revealed a decrease in cellular proliferation following H2O2 in a dose-dependent manner. No proliferation differences were seen between the p53–290 or vector response to H2O2.
Fig. 3.
Cell viability. Cell counts revealed a decrease in cell viability following H2O2 in a dose-dependent manner. Trypan blue exclusion assays demonstrated that p53–290 cells were more sensitive to H2O2 exposure, with viability decreasing to 85% at 1 mM H2O2. Vector cells remained above 90% viable with each H2O2 exposure dose.
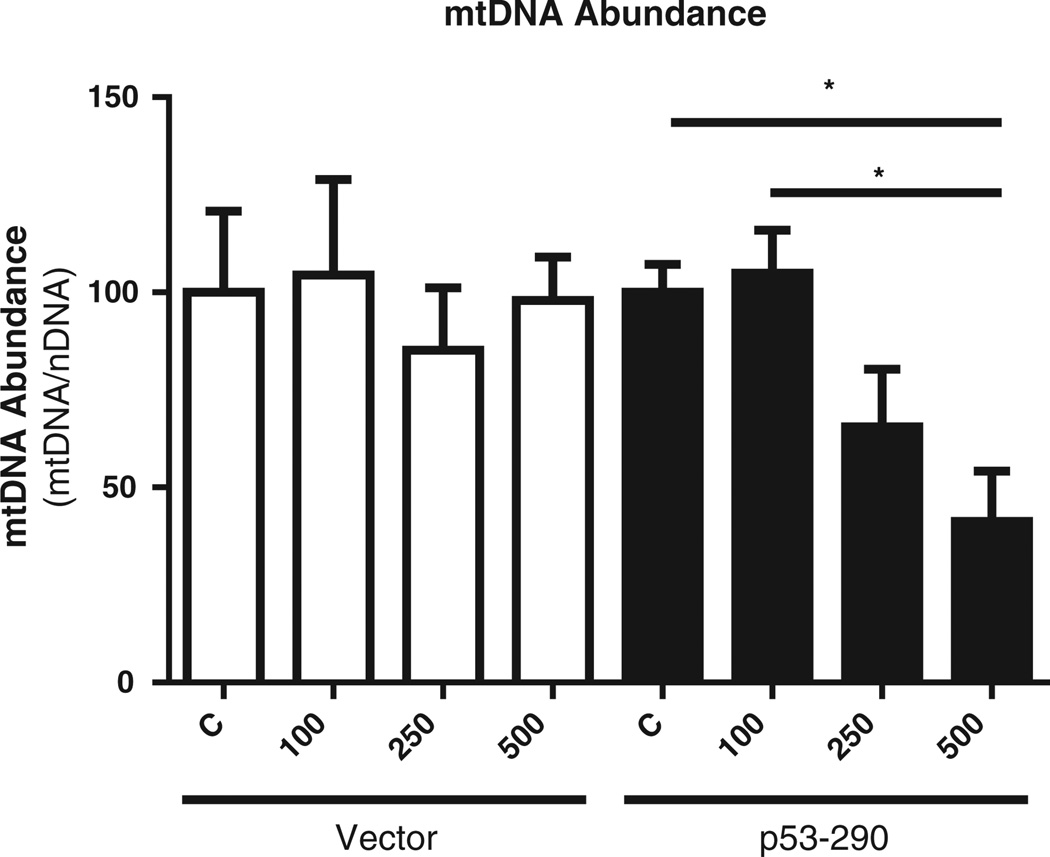
Previous work demonstrated that p53 interacts with mtDNA (Achanta et al., 2005), and mtDNA is susceptible to oxidative stress due to its close proximity to the mitochondrial electron transport chain (Inoue et al., 2003). We determined if mitochondrial p53 alters mtDNA abundance following H2O2 exposure at doses that did not decrease viability. Utilizing a multiplex approach, we normalized mtDNA abundance to nuclear DNA. We have previously shown that p53–290 cells have diminished mtDNA abundance in absence of any stress (~60% of vectormtDNA abundance) (Koczor et al., 2012). We therefore normalized mtDNA abundance of each treatment group to that of the untreated controls. Results showed no change in mtDNA abundance in the vector cells following H2O2 exposure (Fig. 4). P53–290 cells demonstrated a decrease in mtDNA abundance at higher doses of H2O2. In the p53–290 cells, mtDNA abundance was less than 50% of control cells at 500 µM. These results show p53–290 enhances mtDNA depletion following oxidative stress.
Fig. 4.
Mitochondrial DNA abundance. Abundance of mtDNA was determined 24 hours following the 1 hour H2O2 exposure. mtDNA abundance (normalized to nuclear DNA) decreased in p53–290 cells at doses of 250 µM and 500 µM H2O2. No decrease in mtDNA copy number was observed in vector cells.
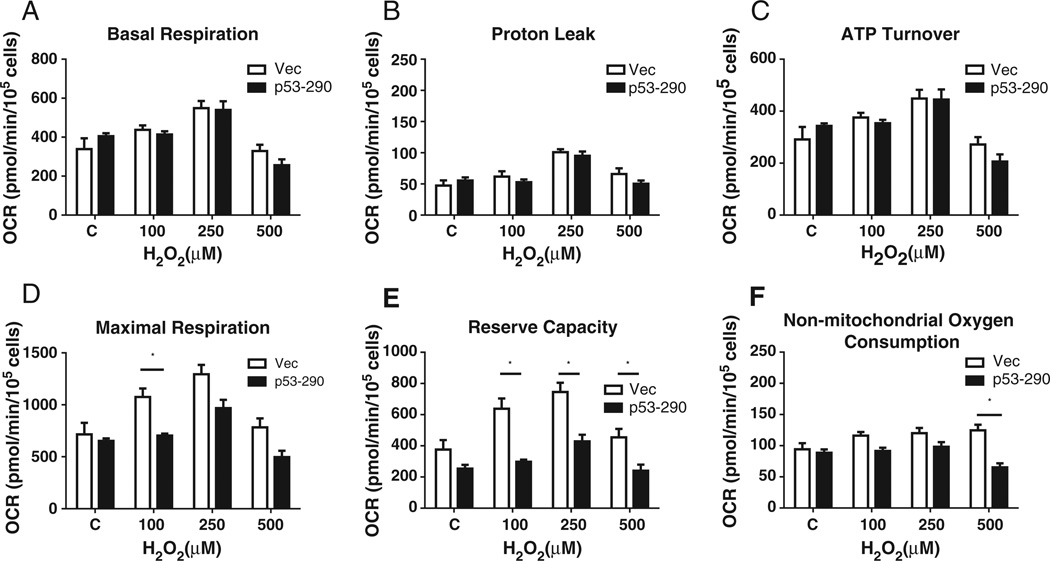
Reduced mtDNA abundance may impact of mitochondrial function. Using a Seahorse XF24 analyzer, we determined the mitochondrial function of p53–290 and vector cells 24 hours following H2O2 exposure. Oximetric measurements were normalized to cell numbers. No change was observed in the basal respiration, proton leakage, or ATP turnover between the p53–290 and vector cells (Fig. 5a, b, and c, respectively). We found decreased maximal respiration in p53–290 cells at all doses of H2O2 utilized, though the decrease was only statistically significant at 100 µM (Fig. 5d). However, the decrease in maximal respiration in p53–290 cells was largely due to reduced reserve capacity (i.e. maximal respiration minus basal respiration). P53–290 cell exhibited significantly reduced reserve capacity at all doses of H2O2 (Fig. 5e). These data show that the presence of p53 within the mitochondrial matrix diminishes the potential of the electron transport chain to increase ATP production in periods of high stress. Finally, no change in non-mitochondrial respiration was observed except at 500 µM H2O2 in p53–290 cells (Fig. 5f). As this is also the dose of H2O2 where the viability of p53–290 cells begins to decrease, this observed change is likely attributed to changes in the cell related to cell death.
Fig. 5.
Mitochondrial respiration. Mitochondrial respiratory function was determined 24 hours following H2O2 exposure. All respiratory measurements were normalized to cell counts. Maximal respiration was higher in vector cells compared to p53–290 cells. Reserve capacity (i.e. maximal respiration minus basal respiration) was diminished in p53–290 cells compared to vector following H2O2. No change was observed in basal respiration, ATP turnover, or proton leakage.
4. Discussion
This work expands on our previous report of the function of p53 within the mitochondria and focuses on the effects of p53 within the matrix (Koczor et al., 2012). The novel p53–290 construct enables elucidation of p53's role on mitochondrial function following oxidative stress. This study documents that increased mitochondrial concentrations of p53, which has been shown to occur following oxidative stress (Vaseva et al., 2012), can enhance the sensitivity of cells to the oxidative stress. Our results also suggest that mitochondrial p53 is important in modulating mtDNA copy number and mitochondrial function following oxidative stress.
Cell proliferation of both p53–290 and vector cells are both affected by H2O2 exposure (Fig. 2). Both cell lines undergo a cell cycle arrest following 1 hour of H2O2 exposure. Because this effect was observed at 100 µM H2O2 in each cell type, it is reasonable to conclude that no difference in the manner of cell cycle arrest induction relates to p53 at this concentration. However, viability was reduced at high concentrations of H2O2 in the p53–290 cells (Fig. 3). This effect, seen at concentrations of 500 µM and above, demonstrates increased sensitivity of the p53–290 cells to H2O2 exposure. The cause of the observed decrease in viability is unclear, but a recent study implicated mitochondrial p53 in promoting necrosis following cellular stress (Vaseva et al., 2012). In that report, both mitochondrial p53 and oxidative stress were required to induce mitochondrial permeability transition pore (MPTP) opening. As our model already has p53 overexpressed in the mitochondrial matrix, only the stressor (i.e. oxidative stress) would be required to promote MPTP opening. In addition, enhanced oxidative stress can promote the intrinsic apoptosis pathway due to mtDNA damage (Druzhyna et al., 2003; LeDoux et al., 2007). Further studies of MPTP opening and mtDNA damage will be necessary to address this issue.
We determined the abundance of mtDNA 24 hours following H2O2 exposure. When mtDNA abundance was normalized to the untreated controls, we found no change in vector mtDNA abundance following H2O2 exposure (Fig. 4). However, we identified a decrease in mtDNA abundance in p53–290 cells at concentrations of H2O2 where cell death is not present. These results suggest that H2O2 exposure causes mtDNA depletion before a loss of cell viability. These data also show that mtDNA is more susceptible to oxidative stress in p53 overexpressing cells. Previous work has shown that p53 can interact with pol γ to promote mtDNA repair via base excision repair (Achanta et al., 2005; Altilia et al., 2012; Bakhanashvili et al., 2008). If more mitochondrial p53 is present, it may act with pol γ to produce more mtDNA repair intermediates, leaving partially repaired mtDNA that does not function properly to encode electron transport chain subunits. This would suggest that mitochondrial p53 is in a stoichiometric balance with pol γ, and overexpression of mitochondrial p53 hinders normal p53–pol γ base excision repair activity. The altered p53–pol γ interactions would promote decreased mtDNA abundance, as observed in our model. The exact kinetic parameters of p53 on mtDNA abundance and repair remain to be elucidated.
We investigated the role of p53–290 on mitochondrial function as mtDNA depletion can affect electron transport chain subunit production. Following transient H2O2 exposure, we noted an increase in basal respiration in both p53–290 and vector cells compared to untreated controls (Fig. 5a). Low levels of oxidative stress have been associated with prosurvival, compensatory effects in the cell (Trachootham et al., 2008).We found no change in basal respiration, ATP turnover, or proton leakage between p53–290 or vector cells following H2O2 exposure (Fig. 5a, b, and c, respectively). Those results suggest that in oxidative stress conditions, no measurable difference in mitochondrial function would be observed in mitochondrial p53-overexpressing cells. However, we identified a decrease in maximal respiration in the p53–290 cells following H2O2 exposure compared vector cells (Fig. 5d). This decrease in maximal respiration was a result of the decreased reserve capacity of the p53–290 cells following H2O2 exposure (Fig. 5e). These results show that p53–290 cells have a limited reserve capacity following oxidative stress and that mitochondrial p53may diminish the compensatory response to transient oxidative stress. Combined with the mtDNA abundance results, these data suggest the H2O2 exposure decreases mtDNA abundance in p53–290 cells which then is compounded to decreased mitochondrial function and diminished reserve capacity.
Overall, the results suggest that mitochondrial p53 increases cellular susceptibility to oxidative stress. Due to the importance of mitochondria and mtDNA in cellular function, an increase in mitochondrial p53 can promote cellular dysfunction and induce cell death. Utilizing our novel p53–290 construct, we are able to delineate the functions of individual subcellular populations of p53, specifically the mitochondrial matrix p53. Our results here demonstrate that mitochondrial p53 is responsible for enhanced mitochondrial sensitivity to oxidative stress, a finding that suggests an important role of mitochondrial matrix p53 in cell death initiation.
Footnotes
This study was supported by DHHS/NIH/NIDA DA030996 to W.L.
References
- Achanta G, Sasaki R, Feng L, Carew JS, Lu W, Pelicano H, Keating MJ, Huang P. Novel role of p53 in maintaining mitochondrial genetic stability through interaction with DNA Pol gamma. EMBO J. 2005;24:3482–3492. doi: 10.1038/sj.emboj.7600819. [DOI] [PMC free article] [PubMed] [Google Scholar]
- Altilia S, Santoro A, Malagoli D, Lanzarini C, Ballesteros Alvarez JA, Galazzo G, Porter DC, Crocco P, Rose G, Passarino G, Roninson IB, Franceschi C, Salvioli S. TP53 codon 72 polymorphism affects accumulation of mtDNA damage in human cells. Aging. 2012;4:28–39. doi: 10.18632/aging.100425. [DOI] [PMC free article] [PubMed] [Google Scholar]
- Bakhanashvili M, Grinberg S, Bonda E, Simon AJ, Moshitch-Moshkovitz S, Rahav G. p53 in mitochondria enhances the accuracy of DNA synthesis. Cell Death Differ. 2008;15:1865–1874. doi: 10.1038/cdd.2008.122. [DOI] [PubMed] [Google Scholar]
- Bieging KT, Attardi LD. Deconstructing p53 transcriptional networks in tumor suppression. Trends Cell Biol. 2012;22:97–106. doi: 10.1016/j.tcb.2011.10.006. [DOI] [PMC free article] [PubMed] [Google Scholar]
- Druzhyna NM, Hollensworth SB, Kelley MR, Wilson GL, Ledoux SP. Targeting human 8-oxoguanine glycosylase to mitochondria of oligodendrocytes protects against menadione-induced oxidative stress. Glia. 2003;42:370–378. doi: 10.1002/glia.10230. [DOI] [PubMed] [Google Scholar]
- Efeyan A, Serrano M. p53: guardian of the genome and policeman of the oncogenes. Cell Cycle. 2007;6:1006–1010. doi: 10.4161/cc.6.9.4211. [DOI] [PubMed] [Google Scholar]
- Inoue M, Sato EF, Nishikawa M, Park AM, Kira Y, Imada I, Utsumi K. Mitochondrial generation of reactive oxygen species and its role in aerobic life. Curr. Med. Chem. 2003;10:2495–2505. doi: 10.2174/0929867033456477. [DOI] [PubMed] [Google Scholar]
- Koczor CA, White RC, Zhao P, Zhu L, Fields E, Lewis W. p53 and mitochondrial DNA: their role in mitochondrial homeostasis and toxicity of antiretrovirals. Am. J. Pathol. 2012;180:2276–2283. doi: 10.1016/j.ajpath.2012.01.045. [DOI] [PMC free article] [PubMed] [Google Scholar]
- Lanni C, Racchi M, Memo M, Govoni S, Uberti D. p53 at the crossroads between cancer and neurodegeneration. Free Radic. Biol. Med. 2012;52:1727–1733. doi: 10.1016/j.freeradbiomed.2012.02.034. [DOI] [PubMed] [Google Scholar]
- LeDoux SP, Druzhyna NM, Hollensworth SB, Harrison JF, Wilson GL. Mitochondrial DNA repair: a critical player in the response of cells of the CNS to genotoxic insults. Neuroscience. 2007;145:1249–1259. doi: 10.1016/j.neuroscience.2006.10.002. [DOI] [PMC free article] [PubMed] [Google Scholar]
- Liang SH, Clarke MF. The nuclear import of p53 is determined by the presence of a basic domain and its relative position to the nuclear localization signal. Oncogene. 1999;18:2163–2166. doi: 10.1038/sj.onc.1202350. [DOI] [PubMed] [Google Scholar]
- Liang SH, Clarke MF. Regulation of p53 localization. FEBS J. 2001;268:2779–2783. doi: 10.1046/j.1432-1327.2001.02227.x. [DOI] [PubMed] [Google Scholar]
- Mahyar-Roemer M, Fritzsche C, Wagner S, Laue M, Roemer K. Mitochondrial p53 levels parallel total p53 levels independent of stress response in human colorectal carcinoma and glioblastoma cells. Oncogene. 2004;23:6226–6236. doi: 10.1038/sj.onc.1207637. [DOI] [PubMed] [Google Scholar]
- Marchenko ND, Wolff S, Erster S, Becker K, Moll UM. Monoubiquitylation promotes mitochondrial p53 translocation. EMBO J. 2007;26:923–934. doi: 10.1038/sj.emboj.7601560. [DOI] [PMC free article] [PubMed] [Google Scholar]
- McKenzie M, Liolitsa D, Hanna MG. Mitochondrial disease: mutations and mechanisms. Neurochem. Res. 2004;29:589–600. doi: 10.1023/b:nere.0000014829.42364.dd. [DOI] [PubMed] [Google Scholar]
- Reinhardt HC, Schumacher B. The p53 network: cellular and systemic DNA damage responses in aging and cancer. Trends Genet. 2012;28:128–136. doi: 10.1016/j.tig.2011.12.002. [DOI] [PMC free article] [PubMed] [Google Scholar]
- Tokino T, Nakamura Y. The role of p53-target genes in human cancer. Crit. Rev. Oncol. Hematol. 2000;33:1–6. doi: 10.1016/s1040-8428(99)00051-7. [DOI] [PubMed] [Google Scholar]
- Trachootham D, Lu W, Ogasawara MA, Nilsa RD, Huang P. Redox regulation of cell survival. Antioxid. Redox Signal. 2008;10:1343–1374. doi: 10.1089/ars.2007.1957. [DOI] [PMC free article] [PubMed] [Google Scholar]
- Vaseva AV, Moll UM. The mitochondrial p53 pathway. Biochim. Biophys. Acta. 2009;1787:414–420. doi: 10.1016/j.bbabio.2008.10.005. [DOI] [PMC free article] [PubMed] [Google Scholar]
- Vaseva AV, Marchenko ND, Ji K, Tsirka SE, Holzmann S, Moll UM. p53 opens the mitochondrial permeability transition pore to trigger necrosis. Cell. 2012;149:1536–1548. doi: 10.1016/j.cell.2012.05.014. [DOI] [PMC free article] [PubMed] [Google Scholar]


