

Abstract
Objective
Enhanced fatty acid desaturation by stearoyl-CoA desaturase enzyme-1 (SCD1) is associated with obesity. This study determined desaturation in cord plasma of newborns of mothers with and without gestational diabetes (GDM).
Study design
Newborns of mothers with GDM (n=21) and without (Control, n=22) were recruited. Cord plasma fatty acid desaturation indices (palmitoleic/palmitic, oleic/stearic ratios) were compared, and correlated with anthropometrics and biochemical measures. A subset of VLDL desaturation indices were determined to approximate liver SCD1 activity.
Results
The total oleic/stearic index was higher in GDM, despite adjustment for cord glucose concentrations. Among GDM and Controls, the oleic/stearic index correlated with cord glucose concentrations (rs=0.36, p=0.02). Both palmitoleic/palmitic and oleic/stearic indices correlated with waist circumference (r=0.47, p=0.001; r=0.37, p=0.01). The VLDL oleic/stearic index was higher in GDM.
Conclusion
The elevated total oleic/stearic index suggests increased lipogenesis in GDM newborns. Factors in addition to glucose supply may influence fetal SCD1 activity.
Keywords: fatty acid, desaturation, lipogenesis, obesity, fetal programming
Introduction
Fetal metabolism is dependent upon substrates from the maternal nutrient environment. While evidence suggests that fatty acid synthesis is active before term 1, 2, little is known about fetal fatty acid desaturase pathways, which are subject to hormonal and nutrient regulation. Mouse fetal lung tissues have demonstrated Δ9 stearoyl-CoA desaturase expression 3, while human fetal liver samples have been shown to exhibit Δ5 and Δ6 desaturase activities 4. Whether maternal conditions during pregnancy affect (i.e. “program”) fetal desaturase activity is not known.
Stearoyl CoA desaturase enzyme-1 (SCD1) is a lipogenic Δ9 desaturase 5 that is upregulated in obesity and insulin resistance 6, 7. SCD1 converts saturated fatty acids (SFA) (16-carbon palmitic acid, 16:0, and 18-carbon stearic acid, 18:0) to monounsaturated fatty acids (MUFA) (palmitoleic 16:1n-7, and oleic 18:1n-9, respectively) for incorporation into triglycerides. Using gas chromatography/mass spectrometry (GC/MS), the fatty acid composition of tissues can be determined. Through GC/MS, SCD1 activity can be estimated from the desaturation indices, the product-to-precursor ratios (palmitoleic/palmitic 16:1n-7/16:0, and oleic/stearic 18:1n-9/18:0) 8, 9. In obesity, the desaturation indices correlate with measures of adiposity in animal tissues 10, and in human subjects 11, 12. SCD1 expression is responsive to the nutrient and hormonal environments, with induction by carbohydrates 13 and fat 14, but with suppression by polyunsaturated fatty acids (PUFA) 15. SCD1 is induced by insulin, but suppressed by leptin 16.
Gestational diabetes (GDM) exposes the fetus to changes in the in utero nutrient environment. While adult human studies have shown that plasma reflects hepatic SCD1 expression 9, this has not been confirmed in fetal life, and we explore this concept in the present study. Preterm infants have demonstrated de novo synthesis of monounsaturated fatty acids, supporting the likelihood that hepatic SCD1 is active in utero 17. Therefore, we hypothesized that unfavorable maternal conditions in GDM may stimulate fetal SCD1 activity, resulting in increased cord plasma desaturation. The objectives of this study were 1) to compare the cord plasma desaturation indices in GDM and Control newborns, and 2) to determine whether the indices were related to infant anthropometric or biochemical measures. We demonstrated a higher oleic/stearic desaturation index in cord plasma of GDM newborns, which may be related to measures of infant adiposity.
Materials and Methods
Study subjects and cord blood sample collection
The study was approved by the Human Subjects Committee at the Los Angeles Biomedical Research Institute at Harbor-UCLA (the study center, Torrance, CA). When expectant mothers were admitted for labor, informed consent was obtained from those who were interested in enrolling their infants in a prospective study intended to follow up to three years of age. Infants born to mothers with GDM (GDM), and normal weight infants of mothers without diabetes (Control) were recruited at 37-42 weeks gestational age. (Small-for-gestational age infants were also recruited, but there were insufficient numbers for analysis.) GDM in the mother was determined using previously established diagnostic criteria 18, and managed by their personal physicians. Control infants had estimated weight >10th percentile and <90th percentile for age and gender 19, confirmed after delivery.
Infants were excluded for multiple gestation, unknown dates, pre-pregnancy maternal diabetes, and syndromic/chromosomal conditions. GDM subjects born SGA were excluded from this analysis.
Umbilical venous cord blood was collected by needle and syringe from the clamped cord after delivery, except in five samples, for which the mode of collection was not documented. The study subjects were evaluated by physical examination, anthropometric measurements, chart review, and maternal interview including a 24-hour dietary recall. Newborn findings are presented in this report.
Anthropometrics
Birth weights were recorded by hospital personnel immediately after delivery. Recumbent infant lengths were determined using a Kiddimeter (Raven Equipment Limited, Essex, UK) in all but a few subjects, for whom tape measure lengths were used. Head circumference was measured at the widest occipitofrontal circumference. The ponderal index was calculated 20. Weight-for-length percentiles were based on CDC growth charts from the year 2000. Percent body fat was determined by the summation of skinfold thickness measurements (triceps, biceps, suprailiac, and subscapular) obtained by Holtain calipers generally at 12-48 hours of life, using the following equations for total body density: Male: d=1.1690-0.0788Log(sum of skinfolds), Female: d=1.2063-0.0999Log(sum of skinfolds) 21. Waist circumference was determined at the level just above the umbilicus.
Biochemical measures of metabolism
Serum (for total cholesterol, LDL, HDL, and triglycerides) and plasma (for all other measures) were isolated from cord blood by centrifugation as soon as possible after collection. Samples were stored at -80°C until analysis. The following biochemical measures were obtained: plasma glucose levels (hexokinase method, Sigma); adiponectin (Linco Human Adiponectin ELISA kit, Millipore); leptin (Linco Human Leptin ELISA kit, Millipore); C-peptide ( Human C-peptide Radioimmunoassay, Millipore); insulin (fluoroimmunoassay, Beckman Coulter); Non-esterified fatty acid (NEFA) levels (enzymatic colorimetric method assay, Wako); total cholesterol, LDL cholesterol, HDL cholesterol, and triglyceride levels (Beckman Coulter Unicel® DxC 800 system, timed endpoint methods).
Plasma fatty acid analysis
Fatty acid extraction and GC/MS
Total fatty acids (including those from triglycerides, phospholipids, and cholesteryl esters) were extracted from 50 μl plasma. Plasma underwent saponification, acidification, and petroleum ether extraction as previously described 22. Fatty acids were derivatized as methyl esters for GC/MS analysis using a Hewlett-Packard model 6890 gas chromatograph, with a Bpx70 column (30-m length, 250-μm diameter, 0.25-μm film thickness; SGE, Inc., Austin, TX), and a model 5973 selective mass detector (not flame ionization detector, FID). Gas chromatography conditions were: helium flow rate, 1 ml/min; initial oven temperature, 150°C, programmed to increase at 3°C/min to a final temperature of 221°C. Expected retention times for palmitic, palmitoleic, stearic, and oleic acids based on known standards were: 6.6, 7.2, 9.5, and 10.2 minutes, respectively. Mass spectra of fatty acids were obtained through electron impact ionization, with the mass detector set in scan mode, and a 2 minute solvent delay. The identities of the following fatty acids were confirmed by observation of their characteristic ions between m/z 200-400: palmitic, m/z 270; palmitoleic, m/z 268 and 236; stearic, m/z 298; oleic, m/z 296, 264. Fatty acids were considered undetectable if a peak was too low for integration, or the mass spectrum of a peak at the expected retention time did not show characteristic ions. Samples were run in triplicate and the relative abundance is presented as a percent of total fatty acids.
The GC/MS methods were validated by standard curves, demonstrating variation in ionization efficiencies among the fatty acids when each one was analyzed against an internal standard. Measured-to-actual response factors include: palmitic 0.93, palmitoleic 0.33, stearic 1.50, oleic 1.57, arachidonic (ARA) 0.35, and docosahexaenoic acid (DHA) 0.25. (Therefore, in comparison to other studies 23, 24, the palmitic acid and DHA abundances with our methods seem lower, while stearic acid seems higher.)
Calculation of desaturation indices
The area under each GC peak is proportional to the relative abundance of each fatty acid. Desaturation indices were determined by calculating the ratios of relative abundances of the MUFA products (palmitoleic, oleic) to saturated fatty acid (SFA) precursors (palmitic, stearic). The palmitoleic/palmitic and oleic/stearic desaturation indices 8, 11, 12 were calculated.
VLDL isolation
Cord plasma VLDL desaturation indices were determined as a surrogate measure of fetal liver SCD1 activity 9 from 10 Control and 10 GDM subjects. (Insufficient samples to analyze in the whole cohort.) Preliminary chylomicron separation was not done due to their absence in cord plasma 25. A previously published method for VLDL isolation 26 was adapted for smaller volumes. Briefly, 250 μl of plasma was overlaid with 150 μl 1.006 g/mL density NaCl/KBr solution in Ultra Clear thin-walled tubes, then ultracentrifuged with tube adaptors (SWTi55 rotor, Beckman Coulter) for 20 hours at 45,000 rpm at 4°C. VLDL was removed in the top 120 μl of supernatant. Fatty acids were extracted and analyzed as above with tri-deuterated heptadecanoic acid as an internal standard.
Maternal dietary intake – 24 hour recall
Maternal dietary intake was estimated by recall of the 24 hour period before food was withheld before delivery. The Nutrition Data System for Research Software generated intake values based on the University of Minnesota Nutrition Coordinating Center Food and Nutrient Database. Mothers were asked whether the recall represented “typical” (average), more, or less than usual intake.
Statistical Methods
Based on data available at the time of the study design 8, 20 subjects per group was estimated to provide 80% power to detect a 36% difference in the 16:1/16:0 ratio and a 20% difference in the 18:1/18:0 ratio between groups with p<0.05. The primary outcomes were the palmitoleic/palmitic and oleic/stearic indices. Secondary outcomes included infant and maternal data, anthropometrics, cord plasma biochemical measures, and maternal dietary data. Statistical analysis was performed using SYSTAT (v13) and SigmaPlot 11.0. Values below limits of detection were assigned numerical values that were half of the lowest detectable limit of each assay. Normally distributed data was analyzed by ANOVA. Non-parametric data (e.g. glucose, insulin, leptin, triglycerides, dietary data) was analyzed by the Kruskal-Wallis ANOVA on Ranks. The significance level was set at 0.05. The data sets that include nonparametric data are presented as medians with 25-75% IQR for consistency in presentation. Gender distribution was compared using Fisher's exact test.
The primary ANOVA was extended to multiple regression analysis that adjusted for baseline variation (gestational age and gender), and potential confounding characteristics that were significantly different between groups (maternal age, log-transformed glucose). Insulin was not included due to non-normal distribution despite log-transformation.
Each desaturation index was correlated to maternal and infant factors related to adiposity and insulin resistance in the whole cohort, and in each group separately, using Pearson's correlations for normally distributed data, and Spearman's correlations for non-parametric data. The correlations were determined to determine if GDM status affected the relationships. Linear regression was performed to assess effect of maternal diabetes treatment within GDM. No mathematical correction was made for these secondary exploratory analyses, but note that they comprise over 50 correlations.
Results
Infant Characteristics
The ethnic group composition was representative of the patient population at the study center. In the Control group, 20 subjects were Hispanic, 1 was Black, and 1 was mixed Hispanic/White. In the GDM group, 19 were Hispanic, 1 was Asian, and 1 was mixed Hispanic/White.
Of the GDM mothers, 9 were treated by diet and lifestyle modification, 9 received metformin treatment, 2 were treated by glyburide alone, and 1 mother received insulin.
Of the subject characteristics (Table 1), the GDM group demonstrated higher maternal age (p=0.002). GDM mothers trended toward less weight gain during pregnancy (p=0.07). The remaining maternal characteristics were similar between groups. Mean maternal HbA1c (available from 18 GDM mothers, majority drawn during third trimester) was 5.6% (Table 1), indicating adequate glycemic control 27. Infant birth weight and percent body fat were similar between Controls and GDM.
Table 1. Characteristics of infants1.
| Characteristics | Control(n=22) | GDM(n=21) |
|---|---|---|
| Gender, male/female | 10M/12F | 12M/9F |
| Gestational Age, weeks | 39.6 ± 0.2 | 39.7 ± 0.2 |
| Maternal Characteristics | ||
| Maternal Age, years | 27 ± 1 | 33 ± 1** |
| Parity, including subject | 2.4 ± 0.4 | 2.1 ± 0.2 |
| Maternal Prepregnancy BMI, kg/m2 | 27.3 ± 2.0 | 31.0 ± 1.5 |
| Maternal Pregnancy Weight Gain, kg | 12.6 ± 0.8 | 8.8 ± 1.6 |
| Maternal Delivery BMI, kg/m2 | 32.1 ± 1.9 | 34.7 ± 1.4 |
| Maternal HbA1c, % | N/A | 5.6 ± 0.1 (n=18) |
| Infant Anthropometrics | ||
| Infant Birth Weight, kg | 3.43 ± 0.07 | 3.53 ± 0.8 |
| Infant Birth Length, cm | 49.8 ± 0.4 | 50.7 ± 0.3 |
| Head Circumference, cm | 34.3 ± 0.2 | 31.3 ± 1.8 |
| Ponderal Index, kg/m3 | 2.79 ± 0.05 | 2.72 ± 0.07 |
| Weight-to-length Percentile, % | 59.0 ± 5.1 | 48.4 ± 6.3 |
| Infant Percent Body Fat, %(sum of skinfolds) | 10.8 ± 0.6 | 12.2 ± 0.8 |
| Infant Waist Circumference, cm | 32.3 ± 0.4 | 33.0 ± 0.5 |
Data are presented as the mean ± SEM.
p<0.01 compared with Controls
Biochemical measures of metabolism, fatty acid profile, and desaturation indices
In the cord plasma biochemical measures (Table 2A), GDM plasma exhibited significantly higher glucose (p=0.006) and insulin measurements (p=0.04). For the lipid panels, 3 samples were insufficient for analysis in each of the Control and GDM groups, but results were similar between groups. There was a trend toward higher leptin concentrations (p=0.07) in GDM.
Table 2. Biochemical measures, profile of fatty acids of interest, and desaturation indices1.
| A. | Control (n=22) | GDM (n=21) |
|---|---|---|
| Cord Plasma Biochemical Measures | ||
| Glucose,mmol/L | 3.8 (3.0-4.2) | 4.7 (4.5-5.6)** |
| Insulin, pmol/L | 27.8 (16.7-50.0) | 45.8 (26.3-69.5)* |
| C-peptide, nmol/L | 0.13 (0.08-0.17) | 0.10 (0.07-0.15) |
| Total Cholesterol, mmol/L2 | 1.58 (1.35-1.89) | 1.49 (1.14-1.66) |
| LDL cholesterol, mmol/L2 | 0.80 (0.67-0.90) | 0.71 (0.57-0.85) |
| HDL cholesterol, mmol/L2 | 0.67 (0.52-0.92) | 0.54 (0.44-0.78) |
| Triglycerides, mmol/L2 | 0.19 (0.15-0.32) | 0.20 (0.12-0.28) |
| NEFA, mmol/L | 0.12 (0.09-0.17) | 0.12 (0.11-0.18) |
| Leptin, μg/L | 8.8 (6.2-10.4) | 10.9 (7.6-15.6)# |
| Adiponectin, mg/L | 36.0 (29.7-49.0) | 37.6 (32.6-51.0) |
| B. | ||
| Total Plasma Abundance of Fatty Acids of Interest3 | ||
| 14:0 myristic, % of total | 0.35 (0.28-0.39) | 0.46 (0.31-0.72) |
| 16:0 palmitic, % of total | 22.1 (20.3-23.3) | 19.7 (14.5-21.7)** |
| 16:1n-7 palmitoleic, % of total | 2.3 (1.9-2.8) | 2.3 (1.6-2.9) |
| 18:0 stearic, % of total | 22.6 (18.1-25.8) | 12.9 (10.5-15.2)** |
| 18:1n-9 oleic, % of total | 15.5 (10.9-16.8) | 14.4 (12.1-17.6) |
| 18:1n-7 vaccenic, % of total | 2.5 (2.0-2.9) | 2.6 (2.3-2.8) |
| 18:2 linoleic, % of total | 7.8 (6.6-9.5) | 6.6 (5.3-10.0) |
| 20:4n-6 arachidonic (ARA), % of total | 7.9 (6.9-10.1) | 8.2 (6.0-13.2) |
| 22:6n-3 docosahexaenoic (DHA), % of total | 1.0 (0.84-1.14) | 1.2 (0.79-2.47) |
| Total Plasma Desaturation Indices | ||
| 16:1/16:0 palmitoleic/palmitic, arbitrary unit | 0.11 (0.09-0.12) | 0.11 (0.09-0.14) |
| 18:1n-9/18:0 oleic/stearic, arbitrary unit | 0.67 (0.56-0.90) | 1.27 (0.92-1.68)** |
| VLDL Desaturation Indices4 | ||
| VLDL palmitoleic/palmitic index, arbitrary unit | 0.03 (0.01-0.05) | 0.06 (0.03-0.12) |
| VLDL oleic/stearic index, arbitrary unit | 0.18 (0.13-0.43) | 0.76 (0.41-1.17)* |
Data are all presented as the median with the 25-75% IQR because some variables exhibited non-normal distribution.
n=19 in Control group, n=18 in GDM group due to insufficient samples
see Methods for additional information related to interpretation
n=10 in each group due to insufficient samples to complete analysis in all subjects
p<0.05,
p<0.01, and
trend to difference, p<0.1 compared with Controls.
Of the percentages of total of the fatty acids of interest (Table 2B), GDM infants show lower abundance of palmitic (p=0.01), and stearic acid (p<0.001), while the abundances of myristic (a minor product of de novo synthesis), vaccenic (elongation product of palmitoleic acid) were similar. Of the PUFAs, the percentages of linoleic, ARA, and DHA were similar. Less than half of the subjects had detectable α-linolenic acid (ALA) or eicosapentaenoic acid (EPA), and the percent of total for each averaged less than 1% (not shown).
The total plasma palmitoleic/palmitic acid index was similar between the two groups (Table 2B). The GDM infants demonstrated significantly higher oleic/stearic acid indices than Controls (p<0.001).
VLDL desaturation indices
Palmitoleic acid was not detected in two Controls. Among the SFA and MUFA, there were similar percentages of total of palmitic (expressed as median and IQR) (Control 17.8, IQR 15.7-20.4%; GDM 19.6, IQR 16.6-23.7%), and stearic (Control 43.4, IQR 27.9-54.4%; GDM 29.6, IQR 21.4-48.2%) acids. GDM trended toward higher palmitoleic abundance (Control 0.4, IQR 0.2-0.7%; GDM 1.4, IQR 0.4-2.8%), but had significantly higher oleic (Control 7.0, IQR 3.5-21.0%; GDM 19.3, 17.3-25.1%) and vaccenic acid proportions (Control 0.2, IQR 0.0-0.3%; GDM 1.5, IQR 1.0-2.1%). GDM demonstrated higher VLDL oleic/stearic indices than Controls (p=0.03) (Table 2B).
Multiple regression
The total plasma desaturation indices between Control and GDM groups were compared in multiple regression analyses, with adjustment for potential confounding factors. After adjustment for gestational age and gender, the palmitoleic/palmitic ratio was still similar between groups, with the least square means (LSM) ± SEM 0.11±0.01 in Controls, versus 0.12±0.01 in GDM, p=0.25. The oleic/stearic ratio remained significantly higher in the GDM group (Control 0.72±0.09; GDM 1.24±0.09, p<0.001). After further adjustment for factors that were increased in the GDM group - maternal age and glucose concentrations (log-transformed for regression) - the palmitoleic/palmitic ratio remained similar between groups (Control 0.10±0.01; GDM 0.12±0.01, p=0.09), and the oleic/stearic ratio remained higher in the GDM group (Control 0.67±0.11; GDM 1.29±0.11, p=0.001).
Maternal dietary intake – 24 hour recall
There were no differences in dietary intake measures between the groups (Supplemental Table 1). Subjectively, mothers often had trouble recalling their food intake prior to delivery (dietary interviews were conducted postpartum). One mother in the Control group and 2 mothers in the GDM group could not tell study personnel whether their reported intake represented more, less, or “typical” intake (average amount). Of the mothers who did answer, intake was reported to be typical by 36% of Control mothers, and 57% of GDM mothers, while the remaining mothers reported less intake.
Correlations
With regards to measures of adiposity, the palmitoleic/palmitic index correlated positively with birth weight (p=0.03; Figure 1A), while the oleic/stearic index trended to a positive correlation (p=0.06, Figure 1B). Neither desaturation index correlated significantly with percent body fat (palmitoleic/palmitic, r=0.23; oleic/stearic, r=0.24), or the weight-for-length percentile (palmitoleic/palmitic r=0.03; oleic/stearic r=-0.05). Of note, both indices positively correlated with waist circumference (palmitoleic/palmitic p=0.001, Figure 1C; oleic/stearic p=0.01, Figure 1D), with GDM contributing more to the associations than Controls.
Figure 1. Correlations between total desaturation indices and measures of adiposity or glucose metabolism.
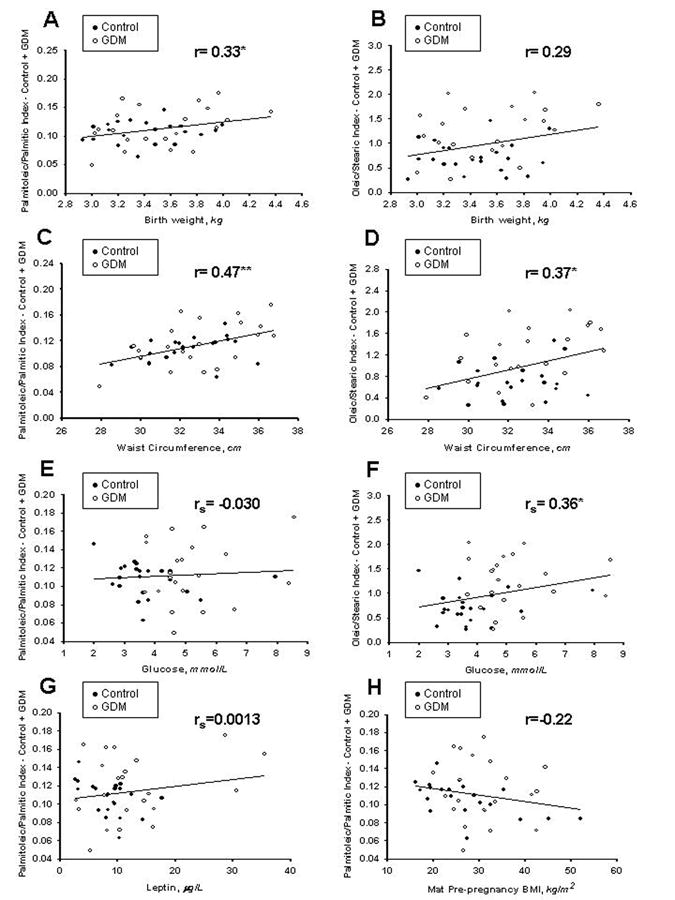
r indicates Pearson's correlation coefficient, while rs indicates Spearman's correlation coefficient. *p<0.05, **p<0.01. The palmitoleic/palmitic index correlated with birth weight (A), but the oleic/stearic index did not (B). Both the palmitoleic/palmitic and oleic/stearic indices were positively associated with waist circumference (C and D). In relation to glucose concentrations, the palmitoleic/palmitic index was not related to glucose (E), but the oleic/stearic index positively correlated (F). Among Controls only, the palmitoleic/palmitic index trended toward a negative correlation with leptin (G), and a significant negative correlation with maternal prepregnancy BMI (H).
With respect to glucose metabolism, the palmitoleic/palmitic index (Figure 1E) was unrelated to glucose, while the oleic/stearic index correlated positively (Figure 1F). Neither index correlated with insulin (palmitoleic/palmitic, rs=0.22; oleic/stearic, r=0.24) or C-peptide (palmitoleic/palmitic, r=0.05; oleic/stearic, r=0.11). While neither index correlated with leptin in the total cohort of Control and GDM subjects (palmitoleic/palmitic, rs=0.0013, Figure 1G; oleic/stearic, rs=0.19), the two groups exhibited different patterns in the palmitoleic/palmitic index, with the Controls demonstrating a trend to negative association with leptin (Control rs= -0.40, p=0.06; GDM rs=0.18). Neither index correlated significantly with adiponectin (palmitoleic/palmitic, r=0.24; oleic/stearic, r=0.13). Neither desaturation index correlated overall with maternal prepregnancy BMI (palmitoleic/palmitic, rs=-0.22, Figure 1H; oleic/stearic, rs=0.01). However the Control group palmitoleic/palmitic index was negatively associated (Control rs= -0.57, p=0.006; GDM rs=-0.1). Within the GDM group, neither desaturation index correlated significantly with type of maternal diabetes treatment (palmitoleic/palmitic, R2=0.18, oleic/stearic R2=0.28). Neither desaturation index correlated with maternal intake of palmitic, palmitoleic, stearic, or oleic acids (not shown).
Discussion
While increased SCD1 desaturation has been demonstrated in obesity in multiple populations 12, 28, 29, we sought to determine whether increased desaturation was present in newborns of mothers with gestational diabetes as well. Despite average birth weights and percent body fat, GDM infants demonstrated higher cord plasma oleic/stearic desaturation indices, which may be partially influenced by maternal supply of glucose. Both desaturation indices may be related to certain measures of adiposity. Our data also suggests that fetal liver SCD1 activity contributes to the higher cord plasma oleic/stearic desaturation index in GDM infants.
The GDM group demonstrated a greater total plasma oleic/stearic desaturation index, with lower stearic acid abundance that may represent increased turnover of stearic in conversion to oleic acid. A similar decrease in palmitic acid abundance in GDM did not lead to a difference in the palmitoleic/palmitic desaturation index, suggesting that the 16-carbon and 18-carbon fatty acid desaturation pathways may be functionally compartmentalized or differentially regulated 30. Other potential explanations include influence from maternal blood, or dilution from fatty acids released by lipolysis. However, our data is limited by lack of maternal fatty acid profiles for comparison.
Regarding maternal characteristics, the mothers varied in treatment of diabetes, and were predominantly Hispanic. Metformin (but not glyburide) crosses the placenta 31, and data published after the inception of this study suggests that metformin may suppress hepatic SCD1 32. However, there was no correlation between either desaturation index and type of diabetes treatment. The predominance of Hispanic subjects in this study enhanced comparability between groups, but limits generalizability to other populations. Therefore, further studies are needed to determine whether maternal diabetes treatment or ethnicity influence SCD1 desaturation in cord plasma.
Both glucose and insulin are known to stimulate SCD1 activity 33. Cord glucose may be influenced by maternal supply, while insulin concentrations reflect the fetal response 34. The correlation between glucose concentrations and the oleic/stearic indices in our study suggests a fetal elevation of SCD1 activity in response to maternal glucose supply in GDM. However, adjustment for glucose measurements in the multiple regression analysis did not diminish the elevation in the oleic/stearic index in the GDM group. Along with the acceptable HbA1c values, these findings would suggest that factors in addition to glucose influence the fetal desaturation indices in GDM pregnancies, and the indices are unlikely to be modified by even tighter glucose control.
The higher VLDL oleic/stearic desaturation index in GDM suggests that the fetal liver contributes to the difference in the total plasma oleic/stearic index. Cord plasma fatty acids are derived from maternal 35, placental 36, and fetal sources 1. However, maternal lipoproteins do not cross the placenta intact, and therefore we analyzed cord VLDL as a fetal-specific lipoprotein. As the main lipid export product of the liver, VLDL includes products of liver fatty acid metabolism. VLDL desaturation indices have been shown to correlate with liver SCD1 mRNA expression in humans 9, and are therefore, markers of liver SCD1 expression. Low sample numbers and volumes in the VLDL analysis limited our ability to detect the less abundant palmitoleic acid, but the difference in the oleic/stearic desaturation index remains. Future studies are needed to define how the maternal, placental, and fetal contributions affect the cord plasma desaturation indices.
Although SCD1 activity can be induced by high fat intake 14, our study did not demonstrate evidence of increased maternal fat intake among our GDM mothers. Conversely, there were no differences with PUFA intake that may suppress desaturation. Despite similar concentrations of TGs and NEFAs (which include maternal fatty acids from placental transport), we cannot exclude qualitative differences in NEFA or TG composition that may have affected fetal desaturase activity.
Low concentrations of adiponectin are associated with insulin resistance in obesity and diabetes 37, 38. We found no relationship between adiponectin and the desaturation indices, in contrast to published studies finding that the oleic/stearic desaturation index was inversely correlated with adiponectin in plasma of healthy adolescent females 39, and in the adipose tissue of adults with rare adipose disorders 40. More studies are needed to determine what factors determine this relationship (or lack thereof). The similar leptin levels between Controls and GDM are consistent with data showing that leptin correlates with birth weight 20. With respect to desaturase activity, leptin regulates liver SCD1 expression through suppression 16. However, the palmitoleic/palmitic index in only the Control group trended toward a negative association with leptin concentrations. Whether lack of a similar trend in GDM suggests an abnormal relationship with leptin requires further investigation.
While the unexpected strong negative association between the palmitoleic/palmitic index and maternal pre-pregnancy BMI among Control, but not GDM subjects, suggests a relationship that may be dysregulated in GDM, the data overall supports that cord desaturation is associated with factors other than maternal obesity. Among the infants, however, the correlation between both total desaturation indices and the waist circumference among Controls and GDM was of particular interest. Associations between desaturation indices and adiposity were previously documented in adolescence 12 and adulthood 11. Because the abdominal circumference reflects fetal growth in utero 41, and the waist circumference may be a measure of adiposity in very young children 42, 43, 44 and adolescents 45, we infer that the waist circumference may represent adiposity in the newborn as well. Future investigations are needed to determine whether the correlation between the indices and waist circumference can be used to predict future obesity and insulin resistance.
Conclusions
The findings from this study support a complex relationship between maternal, placental, and fetal factors and the total cord plasma desaturation indices. Overall, elevations in the oleic/stearic desaturation indices are present in GDM, despite normal birth weight and good maternal diabetes control during pregnancy. Although the oleic/stearic index appears to be influenced by glucose supply from the mother, additional factors are likely involved in stimulation of SCD1 activity in GDM. Both desaturation indices appear related to infant waist circumference. The difference in the total plasma oleic/stearic index may be influenced by liver desaturase activity. Whether the increased oleic/stearic desaturation index in GDM persists through early childhood will be determined in our long-term follow-up study. How the cord plasma desaturation indices may be used as biomarkers of clinical outcome in the development of obesity and metabolic disease requires further investigation.
Supplementary Material
Acknowledgments
We thank the Department of Obstetrics and Gynecology, the Department of Pediatrics, the Bionutrition Core of the CTSI, and the Biomedical Mass Spectrometry Facility for their support. We thank the following individuals for their contributions: Jessica Padilla and Evelyn Lopez (study coordinators); Peter Christenson, PhD (biostatistician); Lawrence Castellani, PhD (advice on VLDL isolation); Diana Wolfe, MD, and Christiane Guberman, MD (sample collection); Ashley Martin and Juan Vega (technical assistance). The study was supported by NIH K23 DK08324, the Clinical Scholar Award from the Pediatric Endocrine Society (to JKY), and the UCLA CTSI (UL1TR000124).
Grant support: JKY received funding from NIH K23 DK08324 and the Clinical Scholar Award from the Pediatric Endocrine Society. The research was also supported by NIH/National Center for Advancing Translational Science (NCATS) UCLA CTSI Grant Number UL1TR000124.
Footnotes
Conflicts of Interest - The authors declare no conflicts of interest.
References
- 1.King KC, Adam PA, Laskowski DE, Schwartz R. Sources of fatty acids in the newborn. Pediatrics. 1971;47(1) Suppl 2:192–198. [PubMed] [Google Scholar]
- 2.Garg M, Bassilian S, Bell C, Lee S, Lee WNP. Hepatic de Novo Lipogenesis in Stable Low-Birth-Weight Infants During Exclusive Breast Milk Feedings and During Parenteral Nutrition. Journal of Parenteral and Enteral Nutrition. 2005;29(2):81–86. doi: 10.1177/014860710502900281. [DOI] [PubMed] [Google Scholar]
- 3.Antony N, Weir JR, McDougall AR, Mantamadiotis T, Meikle PJ, Cole TJ, et al. cAMP response element binding protein1 is essential for activation of steroyl co-enzyme a desaturase 1 (Scd1) in mouse lung type II epithelial cells. PloS one. 2013;8(4):e59763. doi: 10.1371/journal.pone.0059763. [DOI] [PMC free article] [PubMed] [Google Scholar]
- 4.Rodriguez A, Sarda P, Nessmann C, Boulot P, Leger CL, Descomps B. Δ6- and Δ5-desaturase activities in the human fetal liver: kinetic aspects. Journal of lipid research. 1998;39(9):1825–1832. [PubMed] [Google Scholar]
- 5.Ntambi JM, Miyazaki M, Stoehr JP, Lan H, Kendziorski CM, Yandell BS, et al. Loss of stearoyl-CoA desaturase-1 function protects mice against adiposity. Proceedings of the National Academy of Sciences of the United States of America. 2002;99(17):11482–11486. doi: 10.1073/pnas.132384699. [DOI] [PMC free article] [PubMed] [Google Scholar]
- 6.Sjogren P, Sierra-Johnson J, Gertow K, Rosell M, Vessby B, de Faire U, et al. Fatty acid desaturases in human adipose tissue: relationships between gene expression, desaturation indexes and insulin resistance. Diabetologia. 2008;51(2):328–335. doi: 10.1007/s00125-007-0876-9. [DOI] [PubMed] [Google Scholar]
- 7.Gutierrez-Juarez R, Pocai A, Mulas C, Ono H, Bhanot S, Monia BP, et al. Critical role of stearoyl-CoA desaturase-1 (SCD1) in the onset of diet-induced hepatic insulin resistance. The Journal of clinical investigation. 2006;116(6):1686–1695. doi: 10.1172/JCI26991. [DOI] [PMC free article] [PubMed] [Google Scholar]
- 8.Attie AD, Krauss RM, Gray-Keller MP, Brownlie A, Miyazaki M, Kastelein JJ, et al. Relationship between stearoyl-CoA desaturase activity and plasma triglycerides in human and mouse hypertriglyceridemia. Journal of lipid research. 2002;43(11):1899–1907. doi: 10.1194/jlr.m200189-jlr200. [DOI] [PubMed] [Google Scholar]
- 9.Peter A, Cegan A, Wagner S, Lehmann R, Stefan N, Konigsrainer A, et al. Hepatic lipid composition and stearoyl-coenzyme A desaturase 1 mRNA expression can be estimated from plasma VLDL fatty acid ratios. Clinical chemistry. 2009;55(12):2113–2120. doi: 10.1373/clinchem.2009.127274. [DOI] [PubMed] [Google Scholar]
- 10.Jeyakumar SM, Lopamudra P, Padmini S, Balakrishna N, Giridharan NV, Vajreswari A. Fatty acid desaturation index correlates with body mass and adiposity indices of obesity in Wistar NIN obese mutant rat strains WNIN/Ob and WNIN/GR-Ob. Nutrition & metabolism. 2009;6:27. doi: 10.1186/1743-7075-6-27. [DOI] [PMC free article] [PubMed] [Google Scholar]
- 11.Warensjo E, Rosell M, Hellenius ML, Vessby B, De Faire U, Riserus U. Associations between estimated fatty acid desaturase activities in serum lipids and adipose tissue in humans: links to obesity and insulin resistance. Lipids in health and disease. 2009;8:37. doi: 10.1186/1476-511X-8-37. [DOI] [PMC free article] [PubMed] [Google Scholar]
- 12.Okada T, Furuhashi N, Kuromori Y, Miyashita M, Iwata F, Harada K. Plasma palmitoleic acid content and obesity in children. The American journal of clinical nutrition. 2005;82(4):747–750. doi: 10.1093/ajcn/82.4.747. [DOI] [PubMed] [Google Scholar]
- 13.Miyazaki M, Flowers MT, Sampath H, Chu K, Otzelberger C, Liu X, et al. Hepatic stearoyl-CoA desaturase-1 deficiency protects mice from carbohydrate-induced adiposity and hepatic steatosis. Cell metabolism. 2007;6(6):484–496. doi: 10.1016/j.cmet.2007.10.014. [DOI] [PubMed] [Google Scholar]
- 14.Hu CC, Qing K, Chen Y. Diet-induced changes in stearoyl-CoA desaturase 1 expression in obesity-prone and -resistant mice. Obesity research. 2004;12(8):1264–1270. doi: 10.1038/oby.2004.160. [DOI] [PubMed] [Google Scholar]
- 15.Sampath H, Ntambi JM. Polyunsaturated fatty acid regulation of genes of lipid metabolism. Annual review of nutrition. 2005;25:317–340. doi: 10.1146/annurev.nutr.25.051804.101917. [DOI] [PubMed] [Google Scholar]
- 16.Biddinger SB, Miyazaki M, Boucher J, Ntambi JM, Kahn CR. Leptin suppresses stearoyl-CoA desaturase 1 by mechanisms independent of insulin and sterol regulatory element-binding protein-1c. Diabetes. 2006;55(7):2032–2041. doi: 10.2337/db05-0742. [DOI] [PubMed] [Google Scholar]
- 17.Garg M, Bassilian S, Bell C, Lee S, Lee WN. Hepatic de novo lipogenesis in stable low-birth-weight infants during exclusive breast milk feedings and during parenteral nutrition. JPEN Journal of parenteral and enteral nutrition. 2005;29(2):81–86. doi: 10.1177/014860710502900281. [DOI] [PubMed] [Google Scholar]
- 18.Carpenter MW, Coustan DR. Criteria for screening tests for gestational diabetes. American journal of obstetrics and gynecology. 1982;144(7):768–773. doi: 10.1016/0002-9378(82)90349-0. [DOI] [PubMed] [Google Scholar]
- 19.Alexander GR, Himes JH, Kaufman RB, Mor J, Kogan M. A United States national reference for fetal growth. Obstetrics and gynecology. 1996;87(2):163–168. doi: 10.1016/0029-7844(95)00386-X. [DOI] [PubMed] [Google Scholar]
- 20.Ong KK, Ahmed ML, Sherriff A, Woods KA, Watts A, Golding J, et al. Cord blood leptin is associated with size at birth and predicts infancy weight gain in humans. ALSPAC Study Team. Avon Longitudinal Study of Pregnancy and Childhood. The Journal of clinical endocrinology and metabolism. 1999;84(3):1145–1148. doi: 10.1210/jcem.84.3.5657. [DOI] [PubMed] [Google Scholar]
- 21.de Bruin NC, van Velthoven KA, Stijnen T, Juttmann RE, Degenhart HJ, Visser HK. Quantitative assessment of infant body fat by anthropometry and total-body electrical conductivity. The American journal of clinical nutrition. 1995;61(2):279–286. doi: 10.1093/ajcn/61.2.279. [DOI] [PubMed] [Google Scholar]
- 22.Yee JK, Lee WN, Han G, Ross MG, Desai M. Organ-specific alterations in fatty acid de novo synthesis and desaturation in a rat model of programmed obesity. Lipids in health and disease. 2011;10:72. doi: 10.1186/1476-511X-10-72. [DOI] [PMC free article] [PubMed] [Google Scholar]
- 23.Ortega-Senovilla H, Alvino G, Taricco E, Cetin I, Herrera E. Gestational diabetes mellitus upsets the proportion of fatty acids in umbilical arterial but not venous plasma. Diabetes Care. 2009;32(1):120–122. doi: 10.2337/dc08-0679. [DOI] [PMC free article] [PubMed] [Google Scholar]
- 24.Enke U, Jaudszus A, Schleussner E, Seyfarth L, Jahreis G, Kuhnt K. Fatty acid distribution of cord and maternal blood in human pregnancy: special focus on individual trans fatty acids and conjugated linoleic acids. Lipids in health and disease. 2011;10:247. doi: 10.1186/1476-511X-10-247. [DOI] [PMC free article] [PubMed] [Google Scholar]
- 25.Acuff RV, Dunworth RG, Webb LW, Lane JR. Transport of deuterium-labeled tocopherols during pregnancy. The American journal of clinical nutrition. 1998;67(3):459–464. doi: 10.1093/ajcn/67.3.459. [DOI] [PubMed] [Google Scholar]
- 26.Fontanals-Ferrer N, Serrat-Serrat J, Sorribas-Vivas A, Gonzalez-Garcia C, Gonzalez-Sastre F, Gomez-Gerique J. Quick method of determining lipoproteins, including those of intermediate density, in serum. Clinical chemistry. 1988;34(9):1753–1757. [PubMed] [Google Scholar]
- 27.Standards of Medical Care in Diabetes—2012. Diabetes Care. 2012;35(Supplement 1):S11–S63. doi: 10.2337/dc12-s011. [DOI] [PMC free article] [PubMed] [Google Scholar]
- 28.Warensjo E, Riserus U, Vessby B. Fatty acid composition of serum lipids predicts the development of the metabolic syndrome in men. Diabetologia. 2005;48(10):1999–2005. doi: 10.1007/s00125-005-1897-x. [DOI] [PubMed] [Google Scholar]
- 29.Garcia-Serrano S, Moreno-Santos I, Garrido-Sanchez L, Gutierrez-Repiso C, Garcia-Almeida JM, Garcia-Arnes J, et al. Stearoyl-CoA desaturase-1 is associated with insulin resistance in morbidly obese subjects. Molecular medicine (Cambridge, Mass) 2011;17(3-4):273–280. doi: 10.2119/molmed.2010.00078. [DOI] [PMC free article] [PubMed] [Google Scholar]
- 30.Yee JK, Mao CS, Hummel HS, Lim S, Sugano S, Rehan VK, et al. Compartmentalization of stearoyl-coenzyme A desaturase 1 activity in HepG2 cells. Journal of lipid research. 2008;49(10):2124–2134. doi: 10.1194/jlr.M700600-JLR200. [DOI] [PMC free article] [PubMed] [Google Scholar]
- 31.Feig DS, Briggs GG, Koren G. Oral Antidiabetic Agents in Pregnancy and Lactation: A Paradigm Shift? Annals of Pharmacotherapy. 2007;41(7-8):1174–1180. doi: 10.1345/aph.1K045. [DOI] [PubMed] [Google Scholar]
- 32.Kim E, Liu NC, Yu IC, Lin HY, Lee YF, Sparks JD, et al. Metformin inhibits nuclear receptor TR4-mediated hepatic stearoyl-CoA desaturase 1 gene expression with altered insulin sensitivity. Diabetes. 2011;60(5):1493–1503. doi: 10.2337/db10-0393. [DOI] [PMC free article] [PubMed] [Google Scholar]
- 33.Prasad MR, Joshi VC. Regulation of rat hepatic stearoyl coenzyme A desaturase. The roles of insulin and carbohydrate. The Journal of biological chemistry. 1979;254(4):997–999. [PubMed] [Google Scholar]
- 34.Freinkel N. Banting Lecture 1980: of Pregnancy and Progeny. Diabetes. 1980;29(12):1023–1035. doi: 10.2337/diab.29.12.1023. [DOI] [PubMed] [Google Scholar]
- 35.Herrera E, Lasuncion M. Maternal-Fetal Transfer of Lipid Metabolites. In: Polin R, Fox W, Abman S, editors. Fetal and Neonatal Physiology. Fourth. Saunders (Elsevier); Philadeplphia, PA: 2011. pp. 441–453. [Google Scholar]
- 36.Coleman RA, Haynes EB. Synthesis and release of fatty acids by human trophoblast cells in culture. Journal of lipid research. 1987;28(11):1335–1341. [PubMed] [Google Scholar]
- 37.Weiss R, Dufour S, Groszmann A, Petersen K, Dziura J, Taksali SE, et al. Low Adiponectin Levels in Adolescent Obesity: A Marker of Increased Intramyocellular Lipid Accumulation. Journal of Clinical Endocrinology & Metabolism. 2003;88(5):2014–2018. doi: 10.1210/jc.2002-021711. [DOI] [PubMed] [Google Scholar]
- 38.Ryan AS, Berman DM, Nicklas BJ, Sinha M, Gingerich RL, Meneilly GS, et al. Plasma adiponectin and leptin levels, body composition, and glucose utilization in adult women with wide ranges of age and obesity. Diabetes Care. 2003;26(8):2383–2388. doi: 10.2337/diacare.26.8.2383. [DOI] [PubMed] [Google Scholar]
- 39.Gallo S, Egeland G, Meltzer S, Legault L, Kubow S. Plasma fatty acids and desaturase activity are associated with circulating adiponectin in healthy adolescent girls. The Journal of clinical endocrinology and metabolism. 2010;95(5):2410–2417. doi: 10.1210/jc.2009-1975. [DOI] [PubMed] [Google Scholar]
- 40.Yee JK, Phillips SA, Allamehzadeh K, Herbst KL. Subcutaneous adipose tissue fatty acid desaturation in adults with and without rare adipose disorders. Lipids in health and disease. 2012;11:19. doi: 10.1186/1476-511X-11-19. [DOI] [PMC free article] [PubMed] [Google Scholar]
- 41.Schaefer-Graf UM, Wendt L, Sacks DA, Kilavuz O, Gaber B, Metzner S, et al. How many sonograms are needed to reliably predict the absence of fetal overgrowth in gestational diabetes mellitus pregnancies? Diabetes Care. 2011;34(1):39–43. doi: 10.2337/dc10-0415. [DOI] [PMC free article] [PubMed] [Google Scholar]
- 42.Taylor RW, Jones IE, Williams SM, Goulding A. Evaluation of waist circumference, waist-to-hip ratio, and the conicity index as screening tools for high trunk fat mass, as measured by dual-energy X-ray absorptiometry, in children aged 3–19 y. The American journal of clinical nutrition. 2000;72(2):490–495. doi: 10.1093/ajcn/72.2.490. [DOI] [PubMed] [Google Scholar]
- 43.Li C, Ford ES, Mokdad AH, Cook S. Recent trends in waist circumference and waist-height ratio among US children and adolescents. Pediatrics. 2006;118(5):e1390–1398. doi: 10.1542/peds.2006-1062. [DOI] [PubMed] [Google Scholar]
- 44.Roswall J, Bergman S, Almqvist-Tangen G, Alm B, Niklasson A, Nierop AF, et al. Population-based waist circumference and waist-to-height ratio reference values in preschool children. Acta paediatrica (Oslo, Norway : 1992) 2009;98(10):1632–1636. doi: 10.1111/j.1651-2227.2009.01430.x. [DOI] [PubMed] [Google Scholar]
- 45.Spolidoro JV, Pitrez Filho ML, Vargas LT, Santana JC, Pitrez E, Hauschild JA, et al. Waist circumference in children and adolescents correlate with metabolic syndrome and fat deposits in young adults. Clinical nutrition (Edinburgh, Scotland) 2012 doi: 10.1016/j.clnu.2012.05.020. [DOI] [PubMed] [Google Scholar]
Associated Data
This section collects any data citations, data availability statements, or supplementary materials included in this article.