Abstract
Background
The inability of structural MRI to accurately measure tumor response to therapy complicates care management for patients with gliomas. The purpose of this study was to assess the potential of several noninvasive functional and molecular MRI biomarkers for the assessment of glioma response to radiotherapy.
Methods
Fourteen U87 tumor–bearing rats were irradiated using a small-animal radiation research platform (40 or 20 Gy), and 6 rats were used as controls. MRI was performed on a 4.7 T animal scanner, preradiation treatment, as well as at 3, 6, 9, and 14 days postradiation. Image features of the tumors, as well as tumor volumes and animal survival, were quantitatively compared.
Results
Structural MRI showed that all irradiated tumors still grew in size during the initial days postradiation. The apparent diffusion coefficient (ADC) values of tumors increased significantly postradiation (40 and 20 Gy), except at day 3 postradiation, compared with preradiation. The tumor blood flow decreased significantly postradiation (40 and 20 Gy), but the relative blood flow (tumor vs contralateral) did not show a significant change at most time points postradiation. The amide proton transfer weighted (APTw) signals of the tumor decreased significantly at all time points postradiation (40 Gy), and also at day 9 postradiation (20 Gy). The blood flow and APTw maps demonstrated tumor features that were similar to those seen on gadolinium-enhanced T1-weighted images.
Conclusions
Tumor ADC, blood flow, and APTw were all useful imaging biomarkers by which to predict glioma response to radiotherapy. The APTw signal was most promising for early response assessment in this model.
Keywords: APT imaging, glioma, multiparametric MRI, radiotherapy, response assessment
Glioma is the most common malignant and lethal form of primary brain tumors. Of these malignant tumors, glioblastoma accounts for ∼50% of cases, with a median survival of 12–15 months.1 Since randomized trials in the 1970s showed a survival benefit from postoperative 60-Gy whole brain radiotherapy, radiotherapy has become a major treatment method in the management of high-grade gliomas.2 Currently, MRI is the standard modality for assessing glioma treatment response in the clinic. The most common MRI sequences are T2-weighted (T2w), fluid-attenuated inversion recovery, and gadolinium (Gd)-enhanced T1-weighted (T1w). When evaluating treatment response, new or increased Gd enhancement is typically interpreted as tumor recurrence according to the standard Macdonald criteria.3 However, these conventional, structural MRI methods are not sufficiently tissue specific and suffer from some limitations. For example, Gd enhancement can occur in any area of blood–brain barrier disruption, which may be influenced by many etiologies, such as tumor recurrence and treatment effects (radiation necrosis4,5 or pseudoprogression6). In addition, Gd enhancement may disappear immediately when antiangiogenic therapies are used, and tumor recurrence often appears as a nonenhancing tumor (ie, pseudoresponse7,8). Therefore, conventional MRI alone is not adequate for assessment of the treatment response due to a lack of specificity.
Currently, various functional and molecular MR techniques are being investigated in an effort to more accurately assess glioma response to therapy.9–12 These advanced MRI approaches include diffusion imaging to probe tumor cellularity (quantified by the apparent diffusion coefficient [ADC]),13–15 perfusion imaging to detect microvascular integrity (quantified by tumor blood volume, blood flow, and vascular permeability),16,17 and proton MR spectroscopic imaging to determine metabolic status.18,19 In addition, PET, using F-18 fluorodeoxyglucose or some amino acid tracers, is being evaluated to distinguish tumor recurrence from treatment effects.20,21 Notably, it is widely accepted that patients with gliomas would significantly benefit from a multiparametric or multimodality imaging exam that can first diagnose the disease and subsequently assess the effects of treatment.22–24 Although the results are promising, there is still no standard imaging modality available for assessing treatment response in the clinic. Currently, there is an international, multidisciplinary effort to develop new response assessment criteria for malignant gliomas.25
Recently, a novel protein-based MRI contrast mechanism called amide proton transfer (APT) imaging26 has been developed. The APT technique can provide contrast because of the amide proton content of endogenous mobile cytosolic proteins27 or tissue pH. Previous preclinical and clinical studies have indicated that malignant tumors, typically overexpressing many proteins, consistently exhibit a high APT weighted (APTw) signal.28,29 The purpose of this study was to quantitatively compare the imaging features of irradiated U87 tumors in rats, using structural (T1 and T2), functional (ADC and blood flow), and molecular (APTw and magnetization transfer ratio [MTR]) sequences, in an effort to explore a more sensitive method for the assessment of glioma response to therapy.
Materials and Methods
Tumor Model Preparation
Twenty-eight male nude rats (20−22 wk; 300−350 g) were anesthetized by an intraperitoneal injection of 3−5 mL/kg of a solution containing ketamine hydrochloride, 25 mg/mL, and xylazine, 2.5 mg/mL. A midline scalp incision was made, exposing the sagittal and coronal sutures. A small burr hole was made with an electric drill, centered 3 mm to the right of the sagittal suture and 1 mm anterior to the coronal suture. A needle was placed into the burr hole at a depth of 5 mm from the skull. U87 glioma cells (1 million in 4 µL media) were stereotactically injected over 3−4 min for each rat. All experimental procedures were conducted with the approval of the Johns Hopkins Animal Care and Use Committee.
Radiotherapy
Rats underwent preliminary MRI on several post-implantation days to determine whether the tumors had reached an appropriate size for radiation studies. Only those (n = 20) who grew tumors of 4−6 mm in diameter at 11–13 days post-implantation were further used. Fourteen rats were selected as the treatment group and were irradiated using a small-animal radiation research platform.30 Briefly, the rats were anesthetized with 4% isoflurane for about 5 min, followed by 2%–2.5% isoflurane for maintenance during radiation. The rats were immobilized in a fixation device. A single, well-collimated x-ray beam with a dose of 40 Gy (n = 10) or 20 Gy (n = 4) was administered to a 10 × 10 mm2 region centered at the tumor, under on-board, cone-beam CT image guidance. Six other rats were used as the control group and received no treatment. To reduce the differences in starting tumor volume among these 3 groups (40, 20, 0 Gy), the rats were divided according to their tumor diameter sizes (4, 5, and 6 mm) and then selected in a stratified random-sampling manner. The rats were monitored daily until 90 days post-implantation. Animal survival was recorded for each group.
MRI Data Acquisition
MRI data were acquired at several time points (within 1 day before radiation, and 3, 6, 9, and 14 days after radiation). Imaging experiments were performed on a 4.7 T animal MRI system (Bruker Biospin), with an actively decoupled cross-coil setup (a 70-mm body coil for radiofrequency transmission and a 25-mm surface coil for signal reception). First, axial/coronal T2w images were acquired using the following parameters: repetition time (TR) = 3 s; echo time (TE) = 64 ms; 5 slices; thickness = 1.5 mm; field of view (FOV) = 42/32 × 32 mm2; matrix = 256/192 × 192; number of averages (NA) = 2. Then, several quantitative MRI parameters were acquired using previously described methods,31 including T1 (inversion recovery; pre-delay = 3 s; TE = 30 ms; inversion recovery times = 0.05, 0.3, 0.6, 1.2, 1.8, 2.5, and 3.5 s; NA = 4), T2 (TR = 3 s; TE = 30, 40, 50, 60, 70, 80, and 90 ms; NA = 4), isotropic ADC (TR = 3 s; TE = 80 ms; b-values = 0, 166.7, 333.3, 500, 666.7, 833.3, and 1000 s/mm2; NA = 8), blood flow (arterial spin labeling [ASL]32; 3-s labeling at a distance of 20 mm away from the imaging slice; TR = 6 s; TE = 28.6 ms), and APT (frequency-labeling offsets of ±3.5 ppm; TR = 10 s; TE = 30 ms; saturation power = 1.3 µT; saturation time = 4 s; NA = 16). Conventional MTR images were acquired with the same experimental parameters as the APT scans except that a radiofrequency saturation frequency offset of 10 ppm (2000 Hz at 4.7 T) was used. Finally, T1w images (repetition time = 700 ms; echo time = 10 ms; NA = 10) with and without Gd enhancement were acquired with the same geometry and location as the T2w images.
Image Analysis
All imaging data were processed using Interactive Data Language v7 (Exelis Visual Information Solutions). Tumor volumes were manually measured as the sum of all tumor voxels in all slices on the high-resolution T2w images. The T1 map, T2 map, and ADC map were fitted using the following equations: I = A + B exp (-TI/T1), I = I0 exp (-TE/T2), and I = I0 exp (-b ADC), respectively. The cerebral blood flow map was reconstructed from images with and without labeling, using previously described methods.32 The APT-MRI signal was quantified by the MTR asymmetry at ±3.5 ppm with respect to the water signal: MTRasym(3.5 ppm) = Ssat(−3.5 ppm)/S0 − Ssat(+3.5 ppm)/S0, where Ssat and S0 are the signal intensities with and without, respectively, selective radiofrequency irradiation.31
For the quantitative image analysis, the signal abnormalities on the high-resolution T2w images and Gd-T1w images were used as a reference for defining regions of interest. Two regions of interest (tumor and contralateral brain tissue) were drawn manually on the ADC maps and then transferred to identical sites on other co-registered MRI maps. The tumor region covered most areas of the lesions with the signal abnormalities on MRI. The contralateral normal-appearing, relatively homogeneous brain tissue was used for comparison. Ventricles and peritumoral edema were excluded.
Histology
After the terminal MRI scanning, animals were euthanized immediately using carbon dioxide inhalation for 7 min, and brains were excised and preserved in 4% paraformaldehyde at 4°C. Brain samples were sectioned (10-μm thick), and histological sections were stained with hematoxylin and eosin (H&E). Brain sections were analyzed using a light microscope at 10−200× magnification.
Statistical Analysis
All results were expressed as mean ± SD. The differences in tumor volumes and MRI signal intensities in the tumor (preradiation vs several time points postradiation), as well as differences among the starting tumor volumes for the different groups (40, 20, 0 Gy), were analyzed by a 1-way ANOVA, followed by the Tukey test. Survival was plotted on a Kaplan–Meier survival curve, and the log-rank test was used to compare groups. Excluded were rats euthanized for the histology study before they died from the tumor. The median survival duration was calculated for each group. All statistical analyses were performed using SPSS for Windows v18. The level of significance was set at P < .05.
Results
Morphological Features of Irradiated Tumors and Animal Survival
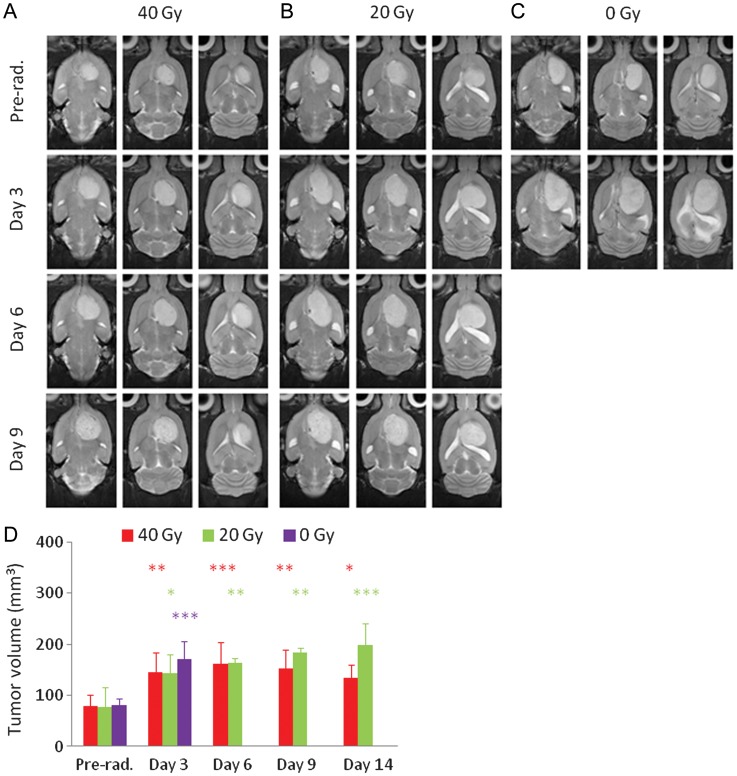
At 11–13 days post-implantation (when radiation was administered), the tumors were 4−6 mm in diameter (Fig. 1). Follow-up structural T2w MRI showed that all irradiated tumors in both the 40-Gy and 20-Gy radiation groups were still growing in size during 1–3 days postradiation. Then, these tumors remained at a size that was almost the same as (or a little larger than) the tumor size at day 3 postradiation. At day 9 postradiation, the tumors in both treatment groups became heterogeneous on the T2w images and were likely associated with severe necrosis. For the nonirradiated group, the tumors grew relatively rapidly, and all 6 rats died before the second time point postradiation. Figure 1D shows the growth of the tumor volumes as measured by T2w MRI for the 3 different groups (40 Gy, n = 10; 20 Gy, n = 4; 0 Gy, n = 6). There were no statistical differences among the starting tumor volumes for the different groups (40, 20, 0 Gy; all P > .983).
Fig. 1.
(A–C) T2w MRI features acquired at the different time points (preradiation and at 3, 6, and 9 days postradiation) for 3 different rats. (A) Eleven days post-implantation, 40 Gy; (B) 12 days post-implantation, 20 Gy; (C) 13 days post-implantation, without radiation. The irradiated tumors were still growing in size during the initial days postradiation. (D) Tumor volumes as measured by T2w MRI at the different time points (preradiation and at 3, 6, and 9 d postradiation). The statistical significance of the difference compared with preradiation: *P < .05, **P < .01, ***P < .001.
Figure 2 shows the cumulative survival curves for the 3 different groups in this study. Four rats euthanized for histology before they died from the tumor were excluded from the survival analysis. Median survivals were 28.5 days (95% confidence interval [CI], 18.6–31.4 d; 40 Gy), 26.0 days (95% CI, 15.8–36.2; 20 Gy), and 14.0 days (95% CI, 11.6–16.4; 0 Gy). There were statistically significant differences between the 40-Gy radiation group and the control group (P < .001) and between the 20-Gy radiation group and the control group (P = .033), but the difference was not significant between the 2 radiation groups (P = .825).
Fig. 2.
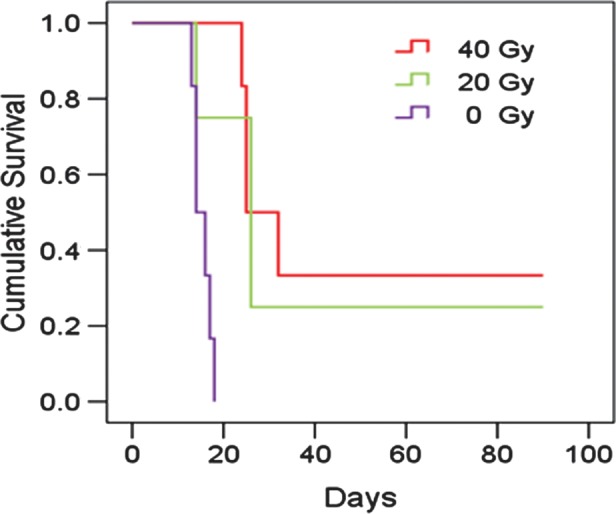
Plots of Kaplan–Meier survival curves as a function of post-implantation days for 3 different groups (40 Gy, n = 6; 20 Gy, n = 4; 0 Gy, n = 6). The rats were observed daily until 90 days post-implantation. Both the 40-Gy and 20-Gy irradiation groups survived longer than the nonirradiated control group (P < .001 and P = .033, respectively).
Multiparametric MRI of Irradiated Tumors (40 Gy)
The tumor was hyperintense on T1 and T2 maps and hypointense on MTR maps, compared with the contralateral normal brain tissue, which showed negligible changes between preradiation and postradiation (Fig. 3). However, ADC, blood flow, and APTw maps demonstrated considerable changes from preradiation to day 3, 6, or 9 postradiation. On the ADC maps, the tumor was hyperintense before radiation and showed an increase in intensity, particularly at day 9 after therapy, compared with preradiation. On the blood flow maps, the tumor was hypointense both preradiation (as reported before33) and postradiation. The blood flow signal intensities in the entire brain, including the tumor and contralateral normal tissue, decreased considerably at 3 days postradiation and remained relatively low at several later time points. Similarly, the APTw signal intensities in the tumor were high preradiation and decreased at all time points postradiation. Especially at day 9 postradiation, the APTw image intensity of the lesion became very heterogeneous, with an area that was almost isointense to the contralateral normal brain tissue.
Fig. 3.
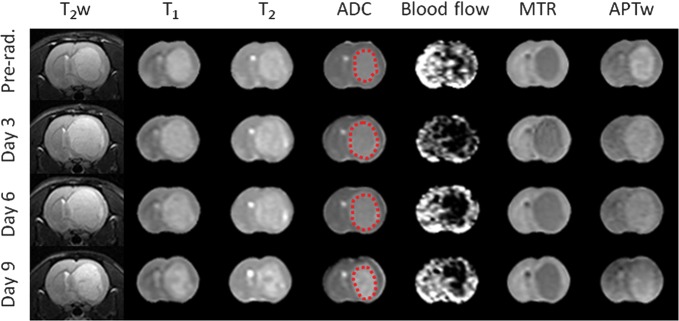
Changes in T2w, T1, T2, ADC, blood flow, MTR, and APTw images acquired at the different time points (preradiation and at 3, 6, and 9 d postradiation) for a rat with a U87MG glioma. The display windows are T1 (0.5–2 s), T2 (0–100 ms), ADC (0–2 × 10⁻⁹ m2/s), blood flow (0–200 mL/100 g/min), MTR at 2 kHz (0%–50% of the bulk water signal intensity), and APTw (−10% to 10% of the bulk water signal intensity).
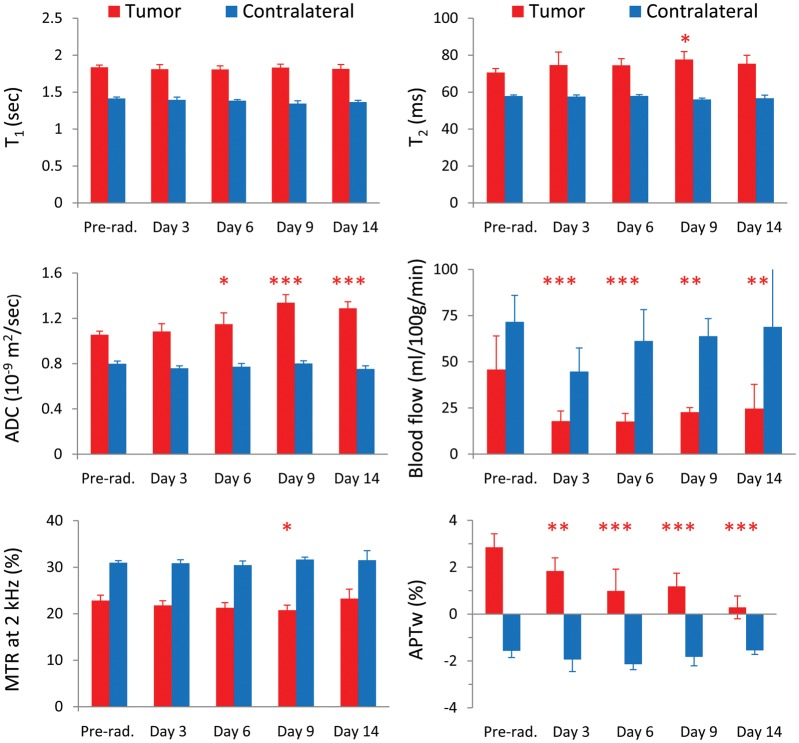
Figure 4 shows the results of the longitudinal quantitative analysis of multiparametric MRI signals of the irradiated tumors for the 40-Gy radiation group (n = 10). The average tumor ADC values did not show a significant change at 3 days postradiation, compared with preradiation (1.08 ± 0.07 vs 1.06 ± 0.03 µm2/ms; P > .05) but increased significantly at ≥6 days postradiation (1.15 ± 0.10 at day 6 postradiation, 1.34 ± 0.07 at day 9 postradiation, 1.29 ± 0.06 at day 14 postradiation vs 1.06 ± 0.03 µm2/ms preradiation; Ps < .05, <.001, <.001, respectively). The blood flow signals were low in the tumor (compared with the contralateral normal brain tissue) both preradiation and postradiation. The average tumor blood flow values (showing large standard deviations) decreased significantly at all time points postradiation (≥3 d) compared with preradiation (17.5 ± 5.2 at day 3, 17.1 ± 4.4 at day 6, 22.7 ± 2.5 at day 9, 24.7 ± 13.1 at day 14 vs 42.0 ± 20.5 mL/100 g/min preradiation; Ps < .001, <.001, <.01, <.01, respectively). In addition, average APTw signal intensities were significantly lower at all time points postradiation than at preradiation (1.78% ± 0.55% at day 3, 0.99% ± 0.93% at day 6, 1.18% ± 0.57% at day 9, 0.29% ± 0.49% at day 14 vs 2.76% ± 0.60% preradiation; Ps < .01, <.001, <.001, <.001, respectively). There were no significant changes in T1, T2, or MTR for most time points postradiation compared with preradiation.
Fig. 4.
Quantitative analysis of multiparametric MRI signal intensities at the different time points (preradiation and at 3, 6, 9, and 14 days postradiation) for the irradiated tumors (40 Gy) and the contralateral normal brain tissue (n = 10). The statistical significance of the difference compared with preradiation: *P < .05, **P < .01, ***P < .001, not marked = not significant.
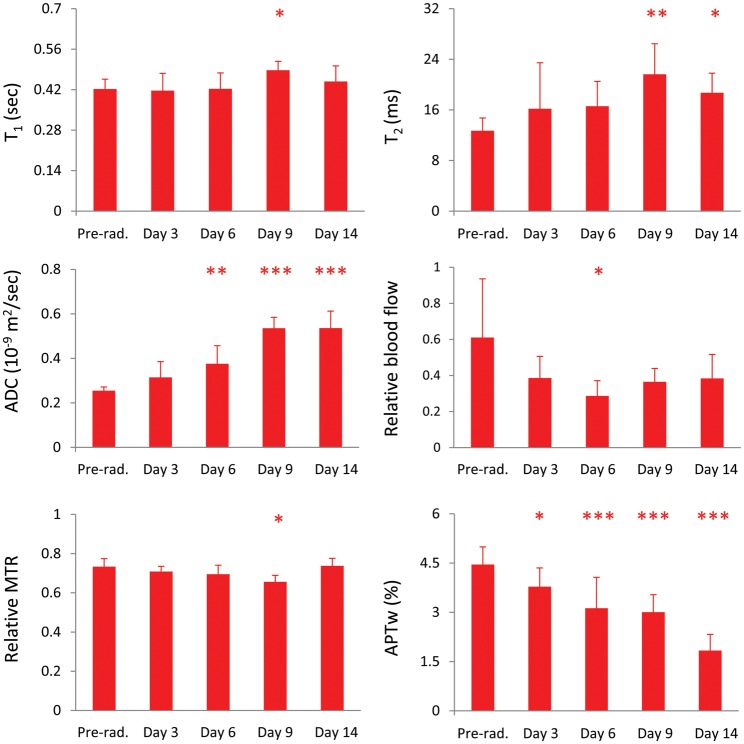
We also quantitatively analyzed the changes in relative MRI signal intensities in the tumor after therapy, with respect to contralateral normal brain tissue (Fig. 5). The statistical significances of the relative MRI intensity differences at all time points postradiation compared with preradiation were similar to those of the absolute MRI intensity differences for most MRI measures. One exception was for the relative blood flow, showing that the statistical difference was significant only at day 6 postradiation due to the fact that the signal intensities in both the tumor and the contralateral normal tissue decreased.
Fig. 5.
Quantitative analysis of relative MRI signal intensities in the tumor, with respect to contralateral normal brain tissue, after therapy (preradiation and at 3, 6, 9, and 14 days postradiation) for the 40-Gy irradiation group (n = 10). The relative T1, T2, ADC, and APTw intensities were defined as tumor value – contralateral value, and the relative blood flow and MTR intensities were defined as tumor value/contralateral value. The statistical significance of the difference compared with preradiation: *P < .05, **P < .01, ***P < .001, not marked = not significant.
Radiation Dose Effects
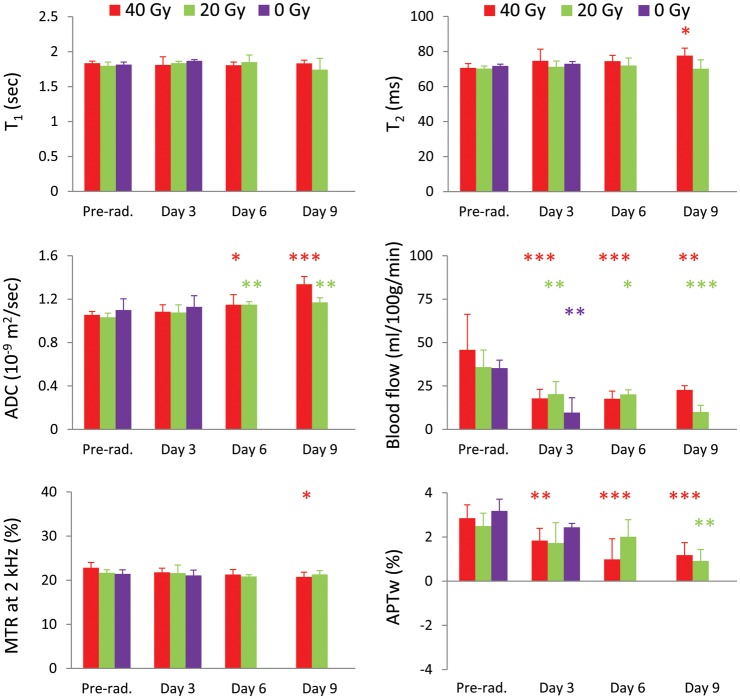
Figure 6 shows the results of the quantitative multiparametric MRI comparison at the different time points for the 3 groups (40, 20, 0 Gy). For the 20-Gy radiation group, similar to the 40-Gy group, the average tumor ADC value was significantly higher at ≥6 days postradiation than at preradiation (1.15 ± 0.03 at day 6, 1.17 ± 0.04 at day 9 vs 1.03 ± 0.04 µm2/ms preradiation; both P < .01). The tumor blood flow showed a significant decrease at all time points postradiation compared with preradiation (20.3 ± 7.2 at day 3, 20.1 ± 2.7 at day 6, 10.0 ± 3.8 at day 9 vs 45.8 ± 6.2 mL/100 g/min preradiation; Ps < .01, <.05, <.001, respectively). The APTw signal intensity exhibited a significant decrease at the later time point (day 9) postradiation compared with preradiation (2.59% ± 0.59% vs 0.91% ± 0.52%, P < .01). There were no significant changes in T1, T2, and MTR for all measured time points postradiation compared with preradiation.
Fig. 6.
Quantitative analysis of multiparametric MRI signal intensities at the different time points (preradiation and at 3, 6, and 9 days postradiation) for 3 different groups (40 Gy, n = 10; 20 Gy, n = 4; 0 Gy, n = 6). The statistical significance of the difference compared with preradiation: *P < .05, **P < .01, ***P < .001, not marked = not significant.
For the nonirradiated group, there were no significant changes in T1, T2, MTR, ADC, and APTw during the 3 days (the time period between preradiation and at day 3 postradiation for the radiation group). However, the tumor blood flow signals decreased significantly during the same period (10.3 ± 7.7 vs 35.3 ± 4.6 mL/100 g/min, P < .01).
Table 1 summarizes the changes in tumor volumes and MRI intensity values in the tumor measured at the 3 time points postradiation with respect to preradiation (40, 20, 0 Gy). Consistent with Fig. 1, the tumor volumes, as measured by T2w MRI, dramatically increased for both the irradiated and nonirradiated groups during the initial days postradiation. The tumor ADC values increased in all groups. At the 2 earlier time points (days 3 and 6) postradiation, the dose-related changes in tumor ADC values seemed small. However, at the later time point (day 9) postradiation, the tumor ADC values demonstrated a larger increase in the 40-Gy irradiation group than in the 20-Gy irradiation group. Blood flow decreased considerably postradiation and did not show an apparent difference between the 2 radiation groups. Interestingly, the blood flow value decreased dramatically, even for the nonirradiated group. Finally, the tumor APTw signals decreased in all groups. The APTw values had a dramatic decrease at 6 and 9 days postradiation in the 40-Gy irradiation group and only at the later time point (9 days) postradiation in the 20-Gy irradiation group.
Table 1.
Changes in tumor volumes and MRI parameters postradiation vs preradiation
| Parameter | Dose, Gy | Day 3, % | Day 6, % | Day 9, % |
|---|---|---|---|---|
| Tumor volume | 40 | 81.9** | 102.6*** | 91.1** |
| 20 | 87.5* | 113.1** | 141.0** | |
| 0 | 112.3*** | |||
| ADC | 40 | 2.0 | 9.3* | 29.9*** |
| 20 | 4.0 | 10.1** | 12.0** | |
| 0 | 2.3 | |||
| Blood flow | 40 | −43.1*** | −52.8*** | −56.1** |
| 20 | −44.1** | −48.3* | −73.0*** | |
| 0 | −42.3** | |||
| APTw | 40 | −33.9** | −68.2*** | −60.8*** |
| 20 | −33.1 | −25.3 | −67.5** | |
| 0 | −28.8 |
Histogram Analysis
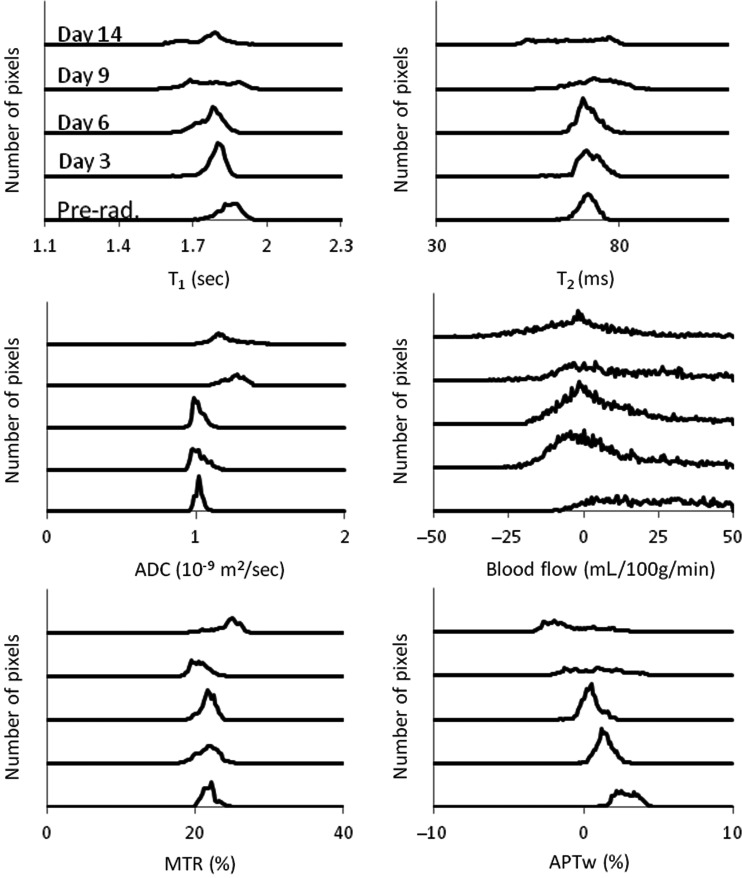
To consider tumor inhomogeneities, we further analyzed changes in multiparametric MRI histograms after radiation. Figure 7 shows the results of the histogram analysis for a typical irradiated rat (40 Gy). The histogram distribution reflects the size and status of the tumor. Before irradiation, the tumor was small and homogeneous, and all histograms (except blood flow) showed a narrow distribution. During the first days postradiation, the tumor continued to grow in size, and the histograms shifted and became broader. Starting from about 9 days postradiation, the tumor became very heterogeneous, as reflected by widened histogram distributions. The ADC histograms demonstrated a right shift following therapy,34 except at day 3, when there seemingly was a left shift. Both the blood flow and APTw histograms had a consistent left shift in response to radiation. The blood flow values quantified by the ASL technique were associated with a change of 1%–2% in bulk water intensity and thus had low signal-to-noise ratios, consistent with a relatively wide histogram distribution at all time points.
Fig. 7.
Histogram analysis of T2, T1, ADC, blood flow, MTR at 2 kHz, and APTw intensities obtained at different time points (preradiation and at 3, 6, 9, and 14 days postradiation) for a U87MG glioma in a rat. It seems that the ADC histograms demonstrated a right shift, while the blood flow and APT histograms demonstrated a consistent left shift after therapy.
Comparison With Gd-T1w MRI
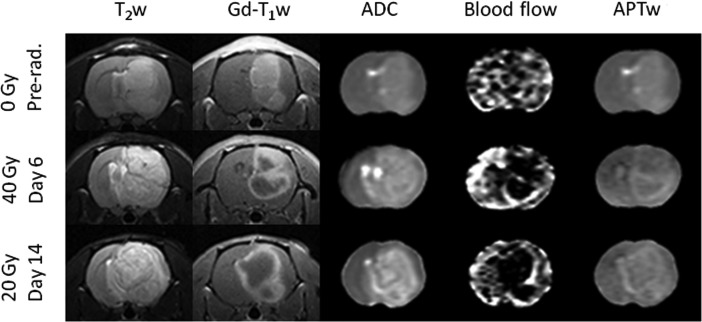
Figure 8 shows the comparison of several advanced MRI measures with the Gd-T1w maps for 3 typical rats. For all rats, T2w images demonstrated large tumor areas of hyperintensity, and Gd-T1w images clearly showed strong enhancement of the mass. The 3 tumor lesions reflected by T2w abnormalities, including peripheral edema, were all larger than Gd-enhancing regions. For the nonirradiated rats, the tumors showed relatively homogeneous enhancement on the Gd-T1w image, showing the absence of central spontaneous necrosis at this time point (when the tumor was small). It is also interesting that the blood flow could not clearly demonstrate the tumor area. For both the 40-Gy (day 6) and 20-Gy (day 14) irradiated rats, like the T2w images, the ADC maps showed large tumor areas of heterogeneous hyperintensity. Notably, both the blood flow and APTw maps identified highly heterogeneous tumor characteristics consistent with Gd-enhancement. It seemed that the Gd-enhancing rims demonstrated high blood flow and APTw signals, while the Gd-nonenhancing central areas demonstrated hypointense blood flow and relatively low APTw signals.
Fig. 8.
Comparison of the MRI features of the T2w image, Gd-T1w image, ADC map, blood flow map, and APTw map at the different time points with different doses postradiation. The display windows are ADC (0–2 × 10⁻⁹ m2/s), blood flow (0–200 mL/100 g/min), and APT (−10% to 10% of the bulk water signal intensity).
Histological Evaluation
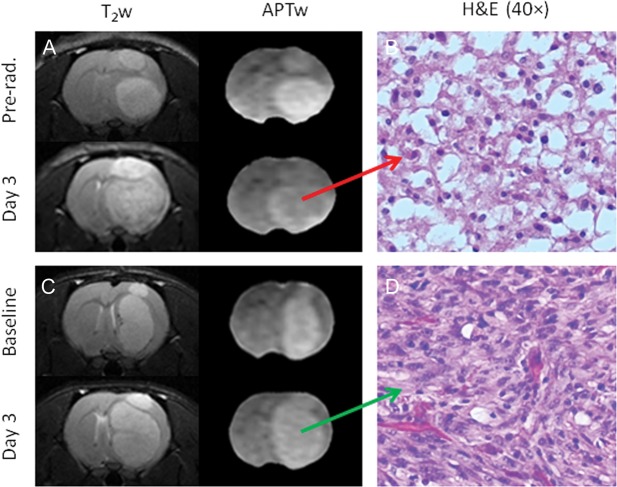
Figure 9 shows 2 examples of T2w and APTw images and high-magnification (40×) H&E images at 2 time points for rats with (40 Gy) and without radiation. The MRIs show that both irradiated and nonirradiated tumors were growing after radiation. However, the APTw signal of the tumor decreased significantly for the irradiated rat at 3 days postradiation (Fig. 9A) but remained almost the same for the nonirradiated rat during the same time period (Fig. 9C). The H&E-stained histological sections of the irradiated tumor acquired at 3 days postradiation showed hypocellularity with necrosis, nuclear shrinkage, and vacuolation changes, which were consistent with the cardinal histological characteristic of radiation necrosis (Fig. 9B). In contrast, the nonirradiated tumor exhibited high cellularity, nuclear atypia, and no vacuolation on histology (Fig. 9D).
Fig. 9.
T2w and APTw images (A and C) and high-magnification (40×) H&E-stained images (B and D) of a treated rat and an untreated rat. The H&E image (B) shows coagulative necrosis and vacuolation changes in the irradiated tumor at 3 days postradiation.
Discussion
Accurate assessment of tumor response to treatment for each individual patient is crucial in determining whether to continue the current therapy or switch to an alternative therapy.35,36 Currently, tissue sampling via surgery is the only reliable approach in the clinic. However, tissue sampling is not always feasible for all brain areas. Even when surgery is possible and advised, choosing the area to target for tissue sampling is often difficult, as gliomas are heterogeneous. Therefore, most clinicians agree that reliable imaging parameters that can distinguish between true tumor progression and treatment effects are urgently needed.25
As mentioned previously, many reports in the literature have suggested that treatment effects are associated with increasing ADC values.34,37 In this study, the ADC scan used 7 b-values, with the highest b-value (1000 s/mm2) the same as that used in most clinical studies, and the calculated ADC values were all consistent with the report in the literature.38 We clearly observed the effects of radiotherapy on tumor volumes and survival. We further observed that the mean ADC values in the tumor significantly increased at 6 days postradiation, although the tumor volumes still increased during these initial days postradiation. However, some rats showed a decrease in ADC at 3 days postradiation (Fig. 7), although the mean ADC values were a little higher at this time point than at preradiation. The exact biophysical mechanism for this disparity is currently still not clear. Generally, successful treatment may cause necrosis and/or apoptotic processes, leading to a reduction in cell density, which would increase the ADC values. However, radiation injury has been associated with gliosis, fibrosis, macrophage invasion, vascular changes, and demyelination. All these radiation-induced effects may restrict water mobility, leading to a lower ADC value.39 Moreover, inflammatory processes, cell swelling, and a reduction in blood flow may also be potential explanations.40,41
Tumor blood volume, blood flow, and vascular permeability, as measured by dynamic susceptibility weighted contrast-enhanced (DSC) MRI, dynamic contrast-enhanced MRI, or ASL MRI methods, have been widely used in tumor grading, prognosis, and differentiation between recurrent tumor and radiation necrosis in patients with gliomas.42,43 In this study, we used the noninvasive ASL technique to quantify tumor blood flow, and the results clearly showed a significant decrease in average tumor blood flow intensities at all time points postradiation (Figs. 3 and 5). However, care should be taken when interpreting the observed results. When we compared the relative signal intensities in the tumor, with respect to contralateral normal brain tissue, the relative blood flow values still decreased at all time points. However, these relative blood flow values showed significant changes only at day 6 postradiation (Fig. 5), due to the fact that the blood flow signals in the tumor and contralateral brain tissue changed simultaneously. In addition, in the nontreated rats, the tumor blood flow also showed a significant decrease. This may have been attributable to the high intracranial pressure caused by the large tumor and edema that developed with time, but further investigation is needed.
Our prior clinical data suggested that APTw hyperintensity (compared with the contralateral normal-appearing white matter) is a typical feature of high-grade gliomas,44,45 based on the increased content of cellular proteins in the tumors.46,47 Importantly, APT imaging is capable of distinguishing the mass of malignant tumors from peritumoral edema and can distinguish high- from low-grade gliomas.44,45 In addition, a recent study on the radiation necrosis rat model has shown that the APTw imaging signal was hypointense to isointense in the necrotic lesion compared with the contralateral normal brain.48 Therefore, APTw signal intensities should be lower in radiation necrosis than in viable, actively growing tumor tissue. Our histological analysis in this study demonstrated that the irradiated tumor at day 3 postradiation (Fig. 9) exhibited radiation necrosis, such as coagulative necrosis and vacuolation changes, leading to the loss of mobile cytosolic proteins, consistent with the decreased signal on the APTw image. These results showed that the APTw signal was sensitive to mobile protein changes in tumors after radiation and could be an early and reliable imaging biomarker for predicting treatment effects in patients with brain tumors.
Treatment effects mimic tumor recurrence clinically and radiographically, posing a formidable diagnostic dilemma in neuro-oncology.35,36 The results of this study have clearly shown that ADC, blood flow, and APTw changes that correlate with the appearance of radiation necrosis are all very important for helping to assess glioma response to radiotherapy. Notably, the changes in these imaging biomarkers were observed a few days earlier than the changes in irradiated tumor volumes in our model (Table 1). Thus, a clinical, multiparametric MRI study that combines various advanced MR techniques, such as diffusion imaging, perfusion imaging, and protein-based APTw imaging, will likely allow for more accurate response criteria to be developed in the future. Compared with ADC maps derived from diffusion MRI, blood volume and blood flow maps derived from perfusion MRI, as well as APTw images, typically have relatively low signal-to-noise ratios (Fig. 3). It is also important to note that the blood flow map quantified by the ASL technique showed large standard deviations. This is because ASL was associated with a change of 1%−2% in bulk water intensity32 and always had a lower contrast-to-noise ratio compared with APTw imaging, which was associated with a change of 3%−5% in bulk water intensity.44,45 Numerous studies have previously suggested that blood volume (usually measured by DSC MRI) can distinguish radiation necrosis from glioma recurrence.24,49,50 The DSC MRI method has short scan times and is currently widely available on commercial scanners. However, the blood volume measurement can be compromised by elevated vascular permeability and leakage of contrast agent. Other disadvantages of DSC MRI are the difficulty in absolute quantification, susceptibility artifacts, and operator dependence.51 In contrast, one unique advantage of both ASL perfusion MRI and APT molecular MRI is that these techniques use endogenous contrast agents, and thus no contrast agent injection is required. This is particularly significant for patients with a contraindication to Gd administration, as well as for pediatric cases, where intravenous access is often problematic.
Finally, there were a few limitations to this study. First, the number of rats was relatively small. Second, the nonirradiated rats all died during the first and second time points postradiation. Therefore, we could not further compare the MRI data between the irradiation group and nonirradiation group at the later time points. Third, one should note that the presence of spontaneous necrosis might be a confounder for radiation necrosis. Fourth, it is known that radiation effects are critically dependent on the dose and time of exposure.52 Our preliminary results (Table 1) showed that there was a decreasing trend in glioma response for the lower-dose (20 Gy) radiation group, compared with the 40-Gy radiation group. More treatment groups with varied-dose radiation or fractionized radiation should be studied in the future. Finally, ASL perfusion imaging (rather than more developed techniques, such as DSC) was used in this study. Thus, the tumor blood volume response to radiation therapy was not assessed.
Conclusions
The results of this study suggest that the ADC, blood flow, and APTw signals are all useful noninvasive biomarkers with which to predict glioma response to radiotherapy. When applied to this preclinical model, the ADC and APTw signals were more reliable for assessing radiation-induced changes, but the change in ADC was still mixed at the initial time point after radiation, even for the 40-Gy radiation group. The tumor blood flow (quantified by the ASL technique) had a relatively lower contrast-to-noise ratio than either ADC or APTw. Moreover, the relative blood flow values in tumors, with respect to contralateral normal brain tissue, were not reliable enough to assess radiation-induced changes. The APTw signal is an early and reliable imaging biomarker for response assessment in this model. Protein-based APT MRI is a safe, completely noninvasive technology, and the results can be easily translated into the clinic. A multiparametric MRI study that includes APTw imaging in a clinical setting would potentially allow for more accurate response criteria to be developed in the future.
Funding
This work was supported in part by grants from the National Institutes of Health (R01EB009731, R01CA166171, and R21EB015555 to J.Z. and R01NS043987 to J.L.) and from the National Natural Science Foundation of China (81271565 to M.W. and 81128006 to J.Z.). The author, Xiaohua Hong, was funded by the China Scholar Council as a joint-training PhD student from Tongji Medical College, Huazhong University of Science and Technology, China, and the Department of Radiology, Johns Hopkins University.
Acknowledgments
The authors thank Mary McAllister for editorial assistance.
Conflict of interest statement. J.Z. is a co-inventor on a patent at the US Patent and Trademark Office for the APT MRI technology. This patent is owned and managed by Johns Hopkins University.
References
- 1.Wen PY, Kesari S. Malignant gliomas in adults. N Engl J Med. 2008;359(5):492–507. doi: 10.1056/NEJMra0708126. [DOI] [PubMed] [Google Scholar]
- 2.Walker MD, Alexander E, Jr., Hunt WE, et al. Evaluation of BCNU and/or radiotherapy in the treatment of anaplastic gliomas. A cooperative clinical trial. J Neurosurg. 1978;49(3):333–343. doi: 10.3171/jns.1978.49.3.0333. [DOI] [PubMed] [Google Scholar]
- 3.Macdonald DR, Cascino TL, Schold SC, et al. Response criteria for phase II studies of supratentorial malignant glioma. J Clin Oncol. 1990;8(7):1277–1280. doi: 10.1200/JCO.1990.8.7.1277. [DOI] [PubMed] [Google Scholar]
- 4.Burger PC, Dubois PJ, Schold SC, Jr., et al. Computerized tomographic and pathologic studies of the untreated, quiescent, and recurrent glioblastoma multiforme. J Neurosurg. 1983;58(2):159–169. doi: 10.3171/jns.1983.58.2.0159. [DOI] [PubMed] [Google Scholar]
- 5.Kumar AJ, Leeds NE, Fuller GN, et al. Malignant gliomas: MR imaging spectrum of radiation therapy- and chemotherapy-induced necrosis of the brain after treatment. Radiology. 2000;217(2):377–384. doi: 10.1148/radiology.217.2.r00nv36377. [DOI] [PubMed] [Google Scholar]
- 6.Brandsma D, Stalpers L, Taal W, et al. Clinical features, mechanisms, and management of pseudoprogression in malignant gliomas. Lancet Oncol. 2008;9(5):453–461. doi: 10.1016/S1470-2045(08)70125-6. [DOI] [PubMed] [Google Scholar]
- 7.Pope WB, Lai A, Nghiemphu P, et al. MRI in patients with high-grade gliomas treated with bevacizumab and chemotherapy. Neurology. 2006;66(8):1258–1260. doi: 10.1212/01.wnl.0000208958.29600.87. [DOI] [PubMed] [Google Scholar]
- 8.Norden AD, Young GS, Setayesh K, et al. Bevacizumab for recurrent malignant gliomas: efficacy, toxicity, and patterns of recurrence. Neurology. 2008;70(10):779–787. doi: 10.1212/01.wnl.0000304121.57857.38. [DOI] [PubMed] [Google Scholar]
- 9.Gillies RJ, Bhujwalla Z, Evelhoch J, et al. Applications of magnetic resonance in model systems: tumor biology and physiology. Neoplasia. 2000;2:139–151. doi: 10.1038/sj.neo.7900076. [DOI] [PMC free article] [PubMed] [Google Scholar]
- 10.Waldman AD, Jackson A, Price SJ, et al. Quantitative imaging biomarkers in neuro-oncology. Nat Rev Clin Oncol. 2009;6:445–454. doi: 10.1038/nrclinonc.2009.92. [DOI] [PubMed] [Google Scholar]
- 11.Kauppinen RA, Peet AC. Using magnetic resonance imaging and spectroscopy in cancer diagnostics and monitoring: preclinical and clinical approaches. Cancer Biol Ther. 2011;12(8):665–679. doi: 10.4161/cbt.12.8.18137. [DOI] [PMC free article] [PubMed] [Google Scholar]
- 12.Verma N, Cowperthwaite MC, Burnett MG, et al. Differentiating tumor recurrence from treatment necrosis: a review of neurooncologic imaging strategies. Neuro-Oncology. 2013;15:515–534. doi: 10.1093/neuonc/nos307. [DOI] [PMC free article] [PubMed] [Google Scholar]
- 13.Chenevert TL, McKeever PE, Ross BD. Monitoring early response of experimental brain tumors to therapy using diffusion magnetic resonance imaging. Clin Cancer Res. 1997;3:1457–1466. [PubMed] [Google Scholar]
- 14.Mardor Y, Pfeffer R, Spiegelmann R, et al. Early detection of response to radiation therapy in patients with brain malignancies using conventional and high b-value diffusion-weighted magnetic resonance imaging. J Clin Oncol. 2003;21(6):1094–1100. doi: 10.1200/JCO.2003.05.069. [DOI] [PubMed] [Google Scholar]
- 15.Smith JS, Cha S, Mayo MC, et al. Serial diffusion-weighted magnetic resonance imaging in cases of glioma: distinguishing tumor recurrence from postresection injury. J Neurosurg. 2005;103:428–438. doi: 10.3171/jns.2005.103.3.0428. [DOI] [PubMed] [Google Scholar]
- 16.Sugahara T, Korogi Y, Tomiguchi S, et al. Posttherapeutic intraaxial brain tumor: the value of perfusion-sensitive contrast-enhanced MR imaging for differentiating tumor recurrence from nonneoplastic contrast-enhancing tissue. Am J Neuroradiol. 2000;21:901–909. [PMC free article] [PubMed] [Google Scholar]
- 17.Galban CJ, Chenevert TL, Meyer CR, et al. The parametric response map is an imaging biomarker for early cancer treatment outcome. Nat Med. 2009;15:572–576. doi: 10.1038/nm.1919. [DOI] [PMC free article] [PubMed] [Google Scholar]
- 18.Graves EE, Nelson SJ, Vigneron DB, et al. Serial proton MR spectroscopic imaging of recurrent malignant gliomas after gamma knife radiosurgery. Am J Neuroradiol. 2001;22:613–624. [PMC free article] [PubMed] [Google Scholar]
- 19.Rock JP, Hearshen D, Scarpace L, et al. Correlations between magnetic resonance spectroscopy and image-guided histopathology, with special attention to radiation necrosis. Neurosurg. 2002;51:912–919. doi: 10.1097/00006123-200210000-00010. [DOI] [PubMed] [Google Scholar]
- 20.Chen W. Clinical applications of PET in brain tumors. J Nucl Med. 2007;48:1468–1481. doi: 10.2967/jnumed.106.037689. [DOI] [PubMed] [Google Scholar]
- 21.Kim YH, Oh SW, Lim YJ, et al. Differentiating radiation necrosis from tumor recurrence in high-grade gliomas: assessing the efficacy of F-18-FDG PET, C-11-methionine PET and perfusion MRI. Clin Neurol Neurosurg. 2010;112(9):758–765. doi: 10.1016/j.clineuro.2010.06.005. [DOI] [PubMed] [Google Scholar]
- 22.Heiss WD, Raab P, Lanfermann H. Multimodality assessment of brain tumors and tumor recurrence. J Nucl Med. 2011;52(10):1585–1600. doi: 10.2967/jnumed.110.084210. [DOI] [PubMed] [Google Scholar]
- 23.Garteiser P, Doblas S, Watanabe Y, et al. Multiparametric assessment of the anti-glioma properties of OKN007 by magnetic resonance imaging. J Magn Reson Imaging. 2010;31(4):796–806. doi: 10.1002/jmri.22106. [DOI] [PubMed] [Google Scholar]
- 24.Corroyer-Dulmont A, Peres EA, Petit E, et al. Detection of glioblastoma response to temozolomide combined with bevacizumab based on mu MRI and mu PET imaging reveals [F-18]-fluoro-L-thymidine as an early and robust predictive marker for treatment efficacy. Neuro-Oncology. 2013;15(1):41–56. doi: 10.1093/neuonc/nos260. [DOI] [PMC free article] [PubMed] [Google Scholar]
- 25.Wen PY, Macdonald DR, Reardon DA, et al. Updated response assessment criteria for high-grade gliomas: Response Assessment in Neuro-Oncology working group. J Clin Oncol. 2010;28:1963–1972. doi: 10.1200/JCO.2009.26.3541. [DOI] [PubMed] [Google Scholar]
- 26.Zhou J, Payen JF, Wilson DA, et al. Using the amide proton signals of intracellular proteins and peptides to detect pH effects in MRI. Nat Med. 2003;9(8):1085–1090. doi: 10.1038/nm907. [DOI] [PubMed] [Google Scholar]
- 27.Kauppinen RA, Kokko H, Williams SR. Detection of mobile proteins by proton nuclear magnetic resonance spectroscopy in the guinea pig brain ex vivo and their partial purification. J Neurochem. 1992;58:967–974. doi: 10.1111/j.1471-4159.1992.tb09350.x. [DOI] [PubMed] [Google Scholar]
- 28.Zhou J, Lal B, Wilson DA, et al. Amide proton transfer (APT) contrast for imaging of brain tumors. Magn Reson Med. 2003;50(6):1120–1126. doi: 10.1002/mrm.10651. [DOI] [PubMed] [Google Scholar]
- 29.Wen Z, Hu S, Huang F, et al. MR imaging of high-grade brain tumors using endogenous protein and peptide-based contrast. Neuroimage. 2010;51(2):616–622. doi: 10.1016/j.neuroimage.2010.02.050. [DOI] [PMC free article] [PubMed] [Google Scholar]
- 30.Wong J, Armour E, Kazanzides P, et al. High-resolution, small animal radiation research platform with x-ray tomographic guidance capabilities. Int J Radiat Oncol Biol Phys. 2008;71(5):1591–1599. doi: 10.1016/j.ijrobp.2008.04.025. [DOI] [PMC free article] [PubMed] [Google Scholar]
- 31.Zhou J, Tryggestad E, Wen Z, et al. Differentiation between glioma and radiation necrosis using molecular magnetic resonance imaging of endogenous proteins and peptides. Nat Med. 2011;17(1):130–134. doi: 10.1038/nm.2268. [DOI] [PMC free article] [PubMed] [Google Scholar]
- 32.Williams DS, Detre JA, Leigh JS, et al. Magnetic resonance imaging of perfusion using spin inversion of arterial water. Proc Natl Acad Sci U S A. 1992;89(1):212–216. doi: 10.1073/pnas.89.1.212. [DOI] [PMC free article] [PubMed] [Google Scholar]
- 33.Sun YP, Schmidt NO, Schmidt K, et al. Perfusion MRI of U87 brain tumors in a mouse model. Magn Reson Med. 2004;51(5):893–899. doi: 10.1002/mrm.20029. [DOI] [PubMed] [Google Scholar]
- 34.Chenevert TL, Stegman LD, Taylor JMG, et al. Diffusion magnetic resonance imaging: an early surrogate marker of therapeutic efficacy in brain tumors. J Nat Cancer Inst. 2000;92:2029–2035. doi: 10.1093/jnci/92.24.2029. [DOI] [PubMed] [Google Scholar]
- 35.Brandes AA, Tosoni A, Spagnolli F, et al. Disease progression or pseudoprogression after concomitant radiochemotherapy treatment: pitfalls in neurooncology. Neuro-Oncology. 2008;10:361–367. doi: 10.1215/15228517-2008-008. [DOI] [PMC free article] [PubMed] [Google Scholar]
- 36.Clarke JL, Chang S. Pseudoprogression and pseudoresponse: challenges in brain tumor imaging. Curr Neur Neurosci Rep. 2009;9:241–246. doi: 10.1007/s11910-009-0035-4. [DOI] [PubMed] [Google Scholar]
- 37.Morse DL, Galons JP, Payne CM, et al. MRI-measured water mobility increases in response to chemotherapy via multiple cell-death mechanisms. NMR Biomed. 2007;20(6):602–614. doi: 10.1002/nbm.1127. [DOI] [PubMed] [Google Scholar]
- 38.Maier SE, Sun YP, Mulkern RV. Diffusion imaging of brain tumors. NMR Biomed. 2010;23:849–864. doi: 10.1002/nbm.1544. [DOI] [PMC free article] [PubMed] [Google Scholar]
- 39.Sundgren PC, Fan X, Weybright P, et al. Differentiation of recurrent brain tumor versus radiation injury using diffusion tensor imaging in patients with new contrast-enhancing lesions. Magn Reson Imaging. 2006;24(9):1131–1142. doi: 10.1016/j.mri.2006.07.008. [DOI] [PubMed] [Google Scholar]
- 40.Moffat BA, Chenevert TL, Lawrence TS, et al. Functional diffusion map: a noninvasive MRI biomarker for early stratification of clinical brain tumor response. Proc Natl Acad Sci U S A. 2005;102(15):5524–5529. doi: 10.1073/pnas.0501532102. [DOI] [PMC free article] [PubMed] [Google Scholar]
- 41.Patterson DM, Padhani AR, Collins DJ. Technology insight: water diffusion MRI—a potential new biomarker of response to cancer therapy. Nat Clin Pract Oncol. 2008;5(4):220–233. doi: 10.1038/ncponc1073. [DOI] [PubMed] [Google Scholar]
- 42.Law M, Young RJ, Babb JS, et al. Gliomas: predicting time to progression or survival with cerebral blood volume measurements at dynamic susceptibility-weighted contrast-enhanced perfusion MR imaging. Radiology. 2008;247(2):490–498. doi: 10.1148/radiol.2472070898. [DOI] [PMC free article] [PubMed] [Google Scholar]
- 43.Hu LS, Eschbacher JM, Heiserman JE, et al. Reevaluating the imaging definition of tumor progression: perfusion MRI quantifies recurrent glioblastoma tumor fraction, pseudoprogression, and radiation necrosis to predict survival. Neuro-Oncology. 2012;14(7):919–930. doi: 10.1093/neuonc/nos112. [DOI] [PMC free article] [PubMed] [Google Scholar]
- 44.Zhou J, Blakeley JO, Hua J, et al. Practical data acquisition method for human brain tumor amide proton transfer (APT) imaging. Magn Reson Med. 2008;60:842–849. doi: 10.1002/mrm.21712. [DOI] [PMC free article] [PubMed] [Google Scholar]
- 45.Zhou J, Zhu H, Lim M, et al. Three-dimensional amide proton transfer MR imaging of gliomas: initial experience and comparison with gadolinium enhancement. J Magn Reson Imaging. 2013;38(5):1119–1128. doi: 10.1002/jmri.24067. [DOI] [PMC free article] [PubMed] [Google Scholar]
- 46.Hobbs SK, Shi G, Homer R, et al. Magnetic resonance image–guided proteomics of human glioblastoma multiforme. J Magn Reson Imaging. 2003;18(5):530–536. doi: 10.1002/jmri.10395. [DOI] [PubMed] [Google Scholar]
- 47.Howe FA, Barton SJ, Cudlip SA, et al. Metabolic profiles of human brain tumors using quantitative in vivo 1H magnetic resonance spectroscopy. Magn Reson Med. 2003;49:223–232. doi: 10.1002/mrm.10367. [DOI] [PubMed] [Google Scholar]
- 48.Wang S, Tryggestad E, Zhou T, et al. Assessment of MRI parameters as imaging biomarkers for radiation necrosis in the rat brain. Int J Radiat Oncol Biol Phys. 2012;83(3):e431–e436. doi: 10.1016/j.ijrobp.2011.12.087. [DOI] [PMC free article] [PubMed] [Google Scholar]
- 49.Aronen HJ, Glass J, Pardo FS, et al. Echo-plannar MR cerebral blood-volume mapping of gliomas - Clinical utility. Acta Radiologica. 1995;36:520–528. [PubMed] [Google Scholar]
- 50.Hu LS, Baxter LC, Smith KA, et al. Relative cerebral blood volume values to differentiate high-grade glioma recurrence from posttreatment radiation effect: direct correlation between image-guided tissue histopathology and localized dynamic susceptibility-weighted contrast-enhanced perfusion MR imaging measurements. Am J Neuroradiol. 2009;30(3):552–558. doi: 10.3174/ajnr.A1377. [DOI] [PMC free article] [PubMed] [Google Scholar]
- 51.Essig M, Shiroishi MS, Nguyen TB, et al. Perfusion MRI: the five most frequently asked technical questions. Am J Roentgenol. 2013;200:24–34. doi: 10.2214/AJR.12.9543. [DOI] [PMC free article] [PubMed] [Google Scholar]
- 52.Fuss M, Wenz F, Scholdei R, et al. Radiation-induced regional cerebral blood volume (rCBV) changes in normal brain and low-grade astrocytomas: quantification and time and dose-dependent occurrence. Int J Radiat Oncol Biol Phys. 2000;48(1):53–58. doi: 10.1016/s0360-3016(00)00590-3. [DOI] [PubMed] [Google Scholar]


