Abstract
Development of a rapid, cost-effective, label-free biosensor for DNA detection is important for many applications in clinical diagnosis, homeland defense, and environment monitoring. A unique label-free DNA biosensor based on Molecular Sentinel (MS) immobilized on a plasmonic ‘Nanowave’ chip, which is also referred to as a metal film over nanosphere (MFON), is presented. Its sensing mechanism is based upon the decrease of the surface-enhanced Raman scattering (SERS) intensity when Raman label tagged at one end of MS is physically separated from the MFON's surface upon DNA hybridization. This method is label-free as the target does not have to be labeled. The MFON fabrication is relatively simple and low-cost with high reproducibility based on depositing a thin shell of gold over close-packed arrays of nanospheres. The sensing process involves a single hybridization step between the DNA target sequences and the complementary MS probes on the Nanowave chip without requiring secondary hybridization or post-hybridization washing, thus resulting in rapid assay time and low reagent usage. The usefulness and potential application of the biosensor for medical diagnostics is demonstrated by detecting the human radical S-adenosyl methionine domain containing 2 (RSAD2) gene, a common inflammation biomarker.
Keywords: DNA Biosensor, Surface-Enhanced Raman Scattering, Molecular Sentinel, Nanowave, Metal Film over Nanosphere
1 Introduction
Developing a highly efficient DNA biosensor is essential to clinical diagnostics, environmental monitoring, food safety inspection, biowarfare target detection, and forensics.1-4 Recent developments in nanotechnology provide some promising solutions. Ultrasensitive detection of DNA based on nanoparticles,5-6 nanoarrays,7 and nanowires8 have been reported. There has been great interest in the development of surface-enhanced Raman scattering (SERS)-based analytical techniques for chemical and biomedical applications.9 Our group has been involved in the development and application of various SERS plasmonic platforms ranging from nanoparticles to nanopost arrays, nanowires and nanochips.10-14 A unique SERS platform consisting of a metal film over close-packed nanosphere substrate was first developed in our laboratory in 1984.10 With this substrate, we have demonstrated the analytical potential of the SERS effect and its practical use for trace analysis.10 This type of substrate, referred to ‘Nanowave’ due its periodic wave-like structure, was later investigated and used by Van Duyne and coworkers, who employed the term “metal film over nanosphere” (MFON) to describe it.15 The Nanowave or MFON substrate has been shown to be particularly effective for SERS applications.16-17 Due to its relatively low fabrication cost and high enhancement factor, it has been used in a wide variety of chemical and biological sensing applications.18-21
There has been a great interest in the use of SERS for DNA detection.22-33 We have developed a unique SERS-based probe for DNA detection, referred to as the “molecular sentinel” (MS).34 The MS probe consists of a DNA strand having a Raman label molecule at one end and a metal nanoparticle at the other end. The plasmonics nanoprobe uses a hairpin-like stem-loop structure to recognize target DNA sequences. Note that hairpin DNA structures, first developed by Tyagi and Kramer in 1996,35 have been used in “molecular beacons” system that are based on fluorescence and electrochemical detection.36-41 The sensing principle of molecular sentinels, however, is quite different from that of molecular beacons. With MS systems, in the normal configuration (i.e., in the absence of target DNA), the DNA sequence forms a hairpin loop, which maintains the Raman label in close proximity of the metal nanoparticle designed to induce an intense SERS signal of the Raman label upon laser excitation. Upon hybridization of a complementary target DNA sequence to the nanoprobe hairpin loop, the Raman label molecule is physically separated from the metal nanoparticle, thus leads to a decreased SERS signal.
In this work, a label-free DNA biosensor based on MS immobilized on Nanowave/MFON is presented. Gold is chosen over silver for MFON fabrication due to its resistance to oxidation, creating a stable SERS enhancement. By using self-assembly on water-air interface method, we are able to obtain a large area of MFON. Our method is target DNA labeling-free, secondary hybridization-free, and post-hybridization washing-free, making it simple-to-use, with short runtime and low reagent cost. To the best of our knowledge, the use of MS-functionalized MFON SERS substrate for label-free DNA detection has not been reported.
To demonstrate the usefulness of the presented biosensor for disease diagnosis, the RSAD2 (Viperin) gene, a common host biomarker of inflammation, is used as target DNA in this study. This gene is expressed as a response of the host immune system to the infection of various viruses including human influenza virus, hepatitis C virus, retroviruses, cytomegalovirus, etc.42-43 A recent study showed that, by profiling the host gene expression in peripheral blood, individuals with symptomatic acute respiratory infections can be distinguished from uninfected individuals with > 95% accuracy.44 Among 30 predictive genes used in the study, RSAD2 is one of the most highly differentially expressed genes. Thus, the RSAD2 gene is chosen as test model for developing our novel DNA biosensor.
2 Materials and Methods
2.1 Materials
Premium pre-cleaned microscope slides (25 mm × 75 mm × 1 mm) were purchased from VWR (Radnor, PA). Poly(ethylene oxide) (PEO) powder (average molecular weight, Mv, of 100,000), sodium dodecyl sulfate (SDS), mercaptohexanol (MCH), mercaptoethanol (ME), sulfuric acid (H2SO4), ammonium hydroxide (NH4OH), hydrogen peroxide (H2O2), sodium chloride (NaCl), sodium phosphate buffer pH 7.0 (SPB), and ethanol (EtOH) were purchased from Sigma Aldrich (St Louis, MO) and used as received unless noted otherwise. Polystyrene beads (PS) (5000 series, size 520 nm, CV ≤ 3%, 10% solids) were purchased from Fisher Scientific (Pittsburgh, PA). Millipore Synergy ultrapure water (DI) of resistivity = 18.2 MΩ cm was used in all aqueous solutions. Gold pellets were obtained from Kurt Lesker (Clairton, PA). The single strand DNA sequences used in this study were synthesized by Integrated DNA Technologies (IDT, Coralville, IA) and shown in Table 1.
Table 1. The single strand DNA sequences used in this study.
| Name | Sequence |
|---|---|
| RSAD2-MS | 5′-SH-AAAAAGTGTAGAAAGCGACTCTATAATCCCTACAC-Cy3-3′ |
| Complementary target DNA | 5′-GTGTAGGGATTATAGAGTCGCTTTC-3′ |
| Non-complementary DNA | 5′-TAGGTTATCAGACTGATGTTGA-3′ |
The underlined sequences indicate the complementary arms of the MS hairpin, and the bold sequence represents the target sequence complementary to the loop region of the MS hairpin.
2.2 Fabrication of monolayer of polystyrene beads
Microscope glass slides were cleaned by immersion in a freshly prepared piranha solution (3:1 96% H2SO4 : 30% H2O2 ) for 1 hour at 90 °C. The glass slides were then washed with copious amounts of DI before being sonicated in a 5:1:1 DI/NH4OH/H2O2 solution for 1h. The glass slides were stored in DI until use.
PS (10% solids) were mixed with ethanol (1:2 ratio), and a trace amount of PEO was added (2 mg PEO for 1 ml mixture of PS and ethanol). PEO served to bind PS together as PS assemble.45
A self-assembly at the water-air interface technique was modified and used to produce monolayers of PS on glass slides (Fig. 1).46-47 A thin layer of water was created on a cleaned, hydrophilic glass slide by pipetting 1.5 ml DI on the glass slide. A small amount of SDS surfactant (5 μl of 2 mM SDS) was added on the water layer and served as a soft barrier. The PS solution was injected on the edge of the water layer using a syringe pump (KD Scientific KDS200). With the assistance of ethanol, PS quickly spread on the water film and self assemble into a monolayer at the water-air interface. PS were continuously injected until the whole water surface was covered with a monolayer of PS. The water film was then carefully removed, leaving a monolayer of PS on the glass slide. To facilitate water film removal, the glass slide was slowly tilted manually from 0 degree to 30 degrees while the water was pipetted off at one end of the glass slide. The glass slide with a monolayer of PS was kept in a petri dish at room temperature with the lid slightly open so that the rest of the water could evaporate. Upon water evaporation, a large-area monolayer of PS on glass slide was obtained.
Figure 1.
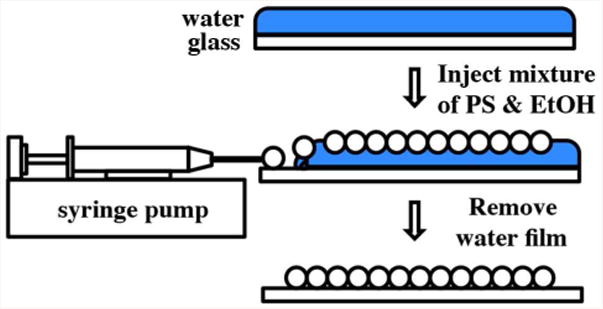
Fabricating monolayer of PS on glass slide based on self-assembly on water-air interface method.
2.3 Metal coating
Before metal coating, the prepared monolayer of PS on glass slide was annealed in an oven at 80 °C for 1 hour to induce area contact (instead of point contact) between PS and the glass surface. This annealing process enhanced the PS and glass slide bonding. The annealed substrate was then coated with 200 nm of Au (5 Å/s) at 5 × 10⁻⁶ mTorr using Kurt Lesker PVD 75 electron beam evaporator. The MFON substrate was obtained after metal deposition. To prevent contamination by contaminant molecules in the air, the obtained MFON were stored in a N2 box before use.
2.4 Scanning Electron Microscope (SEM)
SEM images were taken on FEI XL30 SEM. The accelerating voltage was set at 7 kV, and working distance varied between 11 mm and 12 mm.
2.5 Reflectance Spectroscopy
Reflectance measurements were performed using a Halogen light source (HL-2000-FHSA), a reflection probe (R200-7-UV-VIS), and a USB spectrometer (USB2000+VIS-NIR-ES) from Ocean Optics. Six radial fibers of the reflection probe were used for excitation, and the center fiber was used for collection. From the reflectance spectrum, localized surface plasmon resonance (LSPR) of the MFON substrate was identified.
2.6 Theoretical Calculations
Following our previous works investigating the plasmonic properties of Nanowave structures,48-49 the theoretical calculation of the electromagnetic field for the MFON was performed using the RF module of COMSOL Multiphysics version 4.3a. A model of the MFON was built where the PS diameter was 520 nm, the gap between PS was 52 nm, and the gold thickness was 200 nm. The PS was described by a wavelength-independent refractive index of 1.59. The gold coating was modeled by the Lorentz-Drude dispersion model.50 Based on this model, the theoretical local electromagnetic field (EM) enhancement |E| was calculated using the finite element method (FEM). The maximum mesh size was set to 50 nm. The MFON substrate's model was excited by an incident plane wave at 633 nm, propagating from above along the negative z-direction, and containing only x-polarized components. Direction of the z-axis and x-axis were shown in Fig. 4(a).
Figure 4.
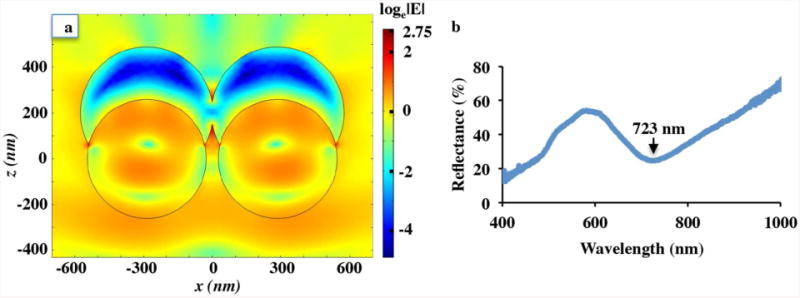
(a) Theoretical EM field enhancement |E| upon 633 nm excitation on the MFON model. The enhancement is normalized by loge|E|. (b) Experimental reflectance spectrum. LSPR is identified at 723 nm.
2.7 Functionalization of MFON with MS
A 20 μl drop of 0.5 μM RSAD2-MS in 0.5 M NaCl and 10 mM SPB aqueous solution were delivered onto the MFON substrate. The substrate with MS was then kept in an airtight container for maintaining a stable humidity. After 2 hours, the substrate was rinsed with DI and soaked in 1 mM MCH aqueous solution to displace non-specifically adsorbed MS probes and to passivate the gold surface.51 Finally, the substrate was rinsed with DI.
Surface coverage of MS probe on MFON substrate was determined using the fluorescence-based method.52 As-prepared MS-functionalized MFON substrates (0.3 cm × 0.5 cm) were soaked in 0.5 M ME solutions. After 15 h at room temperature, the substrates were removed from the solutions, which now contained displaced MS probes. Fluorescence intensities of the solutions were measured using a plate reader (FLUOstar Omega). Fluorescence intensities of 0.5 M ME solutions containing known concentrations of MS probe were also measured and used to establish a standard calibration curve. From this calibration curve, molar concentrations of MS probe displaced from MFON substrates were determined. The average amount of displaced MS probes was calculated by multiplying the measured molar concentration by the solution volume. Finally, the surface coverage of MS probe on MFON substrate was obtained by dividing the number of the displaced MS probes by the estimated MFON surface area.
2.8 Hybridization and SERS detection
Samples (20 μl each) of blank, non-complementary DNA and complementary target DNA (in 0.5 M NaCl and 10 mM SPB aqueous solutions) at different concentrations were delivered onto MS-functionalized MFON substrates and maintained at 37 °C in an airtight container under constant humidity to promote DNA hybridization. After 2 hours incubation, samples were taken out without washing. SERS measurements were performed using a Renishaw InVia confocal Raman microscope. A HeNe laser (Coherent, Model 106-1) emitting a 632.8 nm line was used as the excitation source. The light from the laser was passed through a line filter and focused on a sample via a 10× microscope objective. The focused laser spot size, ∼10 μm diameter, was identified using scanning knife-edge method.53 The Raman scattered light was collected by the same objective, and passed through a holographic notch filter to block the Rayleigh scattered light. An 1800 groove/mm grating was used to disperse the collected light, providing a spectral resolution of 1 cm-1. The Raman scatter was detected using a 1024 × 256 pixel RenCam charge-coupled device (CCD) detector. For each sample, five SERS spectra were acquired from five different spots across the detection area using a motorized XY translational stage internal to the microscope. The exposure time for each spot was 10 seconds. The five acquired SERS spectra were then background subtracted and averaged using Matlab to represent the final SERS spectrum for each sample. Note that only 10% of the laser power, i.e 0.5 mW, was used to avoid damaging the DNA sequences.
3 Results and Discussion
3.1 DNA detection scheme
The detection scheme is shown in Fig. 2. First, the MFON is functionalized with MS. The complementary arms of the MS hairpin hybridize into 6 base-pair stem sequence with melting temperature (Tm) ≈ 46 °C allowing formation of a stable hairpin structure at room temperature in the absence of a complementary DNA target. The 3′-end of MS hairpin probes was modified with Cy3 Raman label. Conjugation of MS probe onto the MFON's gold surface was achieved by using an alkyl thiol substituent at the 5′-end. To effectively separate the Raman labels from the MFON's metallic surface upon hybridization to the complementary target DNA, the length of the DNA hairpins was designed to be 35 nucleotides. In the absence of target sequence, the MS's stem loop is in the closed state. At this state, the Cy3 dye is in close proximity to the gold surface (<1 nm), inducing a strong SERS signal. When the complementary target DNA sequence is added, it hybridizes with the MS, forcing the stem loop to open. At this state, the Cy3 dye is physically separated from the Au surface. The opened stem loop results in a quenched SERS signal.
Figure 2.
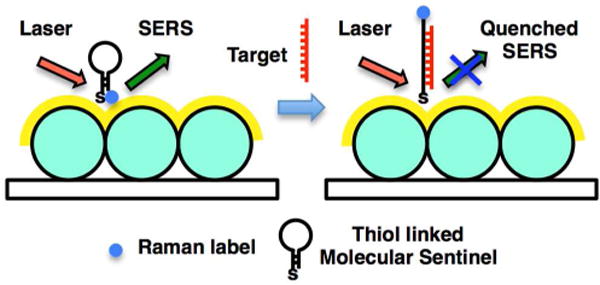
Label-free complementary target DNA detection scheme.
3.2 MFON fabrication and characterization
The monolayer of PS on microscope glass slide is presented in Fig. 3. Due to light diffraction, the structure has different colors under different angles of view as shown in Fig. 3(a) and Fig. 3(b). By using self-assembling on water-air interface method, a large area of PS monolayer (25 mm × 75 mm) is obtained. Although there are some long cracks in the monolayer on the microscope glass slide, by cutting the glass slide into smaller pieces (e.g. 10 mm × 10 mm), long crack-free, centimeter-scale monolayers could be obtained. For DNA detection applications, where the detection site can be as small as the laser spot size (i.e. a few microns), this centimeter-scale substrate can be extended into a microarray format consisting of thousands of detection sites. This substrate, therefore, has potential for high throughput analysis, which is desirable in many DNA detection applications. Fabricating the substrate is relatively simple. By letting the PS self-assemble on the surface of a water film on the glass slide instead of the surface of water in a tank, transferring the PS monolayer from the water surface to the substrate is easily accomplished by simply pipetting the water film from the substrate. The use of syringe pump for injecting mixture of PS and EtOH allows that injection speed can be easily adjusted. SEM image in Fig. 3(c) confirms the effectiveness of the water-air interface method for fabricating PS monolayers. As shown in the SEM image, self-assembled PS form a periodic hexagonal pattern.
Figure 3.
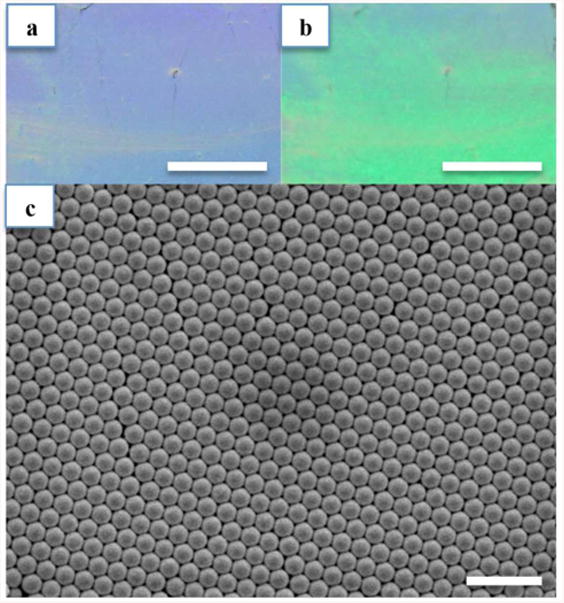
(a, b) Photographs of PS monolayer on microscope glass slide at two different viewing angles. (c) SEM image of a 520 nm PS monolayer covered by a 200 nm thick Au layer. Scale bars in (a, b): 10 mm, (c): 2 μm.
3.3 SERS Enhancement and LSPR of the MFON
Theoretical local EM field enhancement |E| upon 633 nm excitation on the MFON model is shown in Fig. 4(a). The EM field enhancement is most intense at the interparticle crevice between adjacent half-shell gold-coated PS. The largest local EM field enhancement |E| is ∼15.64 which created SERS enhancement |E|4 ∼ 6 × 10⁴. Experimental reflectance spectrum of the MFON substrate is shown in Fig. 4(b). LSPR is identified at 723 nm corresponding to the minimum reflectance.
3.4 Surface coverage of MS probe and DNA detection
Results from surface coverage measurements show that the MS probe coverage is ∼0.5 × 10¹² molecules/cm2. This value is similar to a previous study on molecular beacon probe on Au surface.54 Fig. 5 shows the SERS spectra taken 2 hours after blank, 5 μM non-complementary DNA sequence, and 5 μM complementary target DNA sequence were added on MS-functionalized MFON. The 1197 cm-1 peak was used to compare the SERS intensities of the three samples. On one hand, the intensity difference between the non-complementary DNA sample and the blank sample is very small. On the other hand, the complementary target DNA sample's intensity is considerably smaller than the blank sample's intensity. This result showed that the presented biosensor can distinguish between complementary target DNA from non-complementary DNA. The decrease in SERS intensity after complementary target DNA addition indicates that the complementary target sequences hybridized with the MS probes and opened the MS's stem loops. The Cy3 dyes tagged at the 3′-end of the MS were physically separated from the MFON surface by about 35 nucleotides (approximately 10 nm). Since SERS enhancement exponentially decreases with increase in Raman label-metal surface distance,19 the increase in distance between Raman label Cy3 and MFON surface from <1 nm (prior to hybridization) to 10 nm upon DNA hybridization leads to a strong decrease of SERS enhancement and causes a decrease of SERS intensity. It is noteworthy that the target DNA was detected without being labeled. SERS spectra were acquired after a single hybridization step between the sample and MS pre-immobilized on MFON substrate. Secondary hybridization to form “sandwich” of DNA-capture probe/DNA target/DNA-reporter probe27, 55 is not required. Since DNA reporter probes are not used, post-hybridization washing to remove unhybridized DNA reporter probes is also not required. Our method, therefore, has rapid runtime and low reagent usage.
Figure 5.
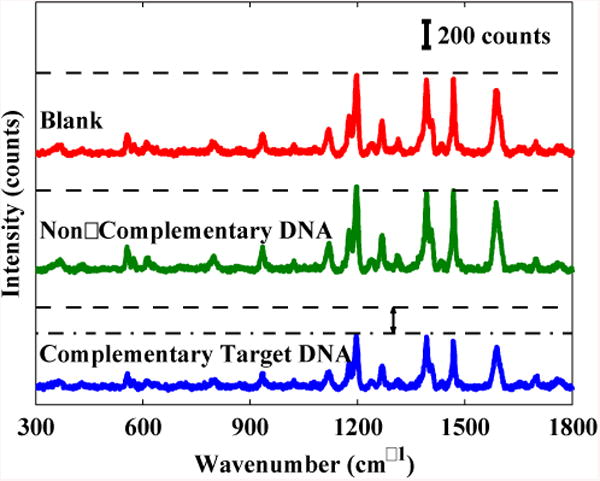
SERS spectra from blank sample, non-complementary DNA sample, or complementary target DNA sample 2 hours after delivery on MS-functionalized MFON substrates. The dashed lines mark the blank sample's SERS intensity. The dash-dot line marks the complementary target DNA sample's SERS intensity.
The possibility for quantitative analysis is shown in Fig. 6. Complementary target DNA samples (20 μl each) at 1 μM, 5 μM, and 10 μM were delivered on RSAD2-MS functionalized MFON. Upon delivery onto the MFON, the 20 μl target sample drops spread out to ∼1 cm diameter spots. The focused laser spot of ∼10 μm diameter excited only a minute fraction (10-6) of the samples (only 20 pl). Thus, the amount of complementary target DNA excited by the focused laser spot is approximately 20 attomoles, 100 attomoles, and 200 attomoles, respectively. As shown in the Fig. 6, the SERS intensity decreases with increasing amount of complementary target DNA. This result suggests that more MS hairpins are opened when higher amount of complementary target DNA delivered to the chip. As a result, more Cy3 Raman labels tagged at 3′-end of the MS are physically separated from MFON's gold surface which results in smaller SERS intensity. Note that in this study, SERS intensity reductions are relatively small although the amounts of complementary target DNA is much higher than the number of MS probes on the same area. This is probably due to low hybridization efficiency. Since hybridization efficiency is highly dependent on probe coverage,56-58 fine-tuning and optimizing the probe coverage can enhance the hybridization efficiency, therefore the sensitivity.
Figure 6.
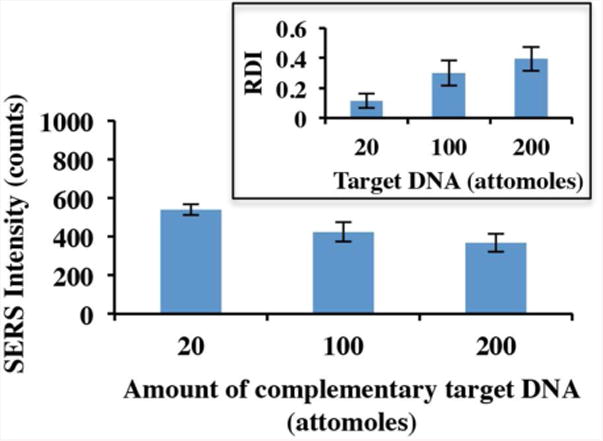
SERS intensity at different amount of complementary target DNA (inset: corresponding RDI). Error bars: standard deviation (n=5).
In this work, the lower SERS intensity of a sample, the more complementary target DNA exists in that sample. This inverse relationship is inconvenient for quantitative analysis. Alternatively, we introduce a new parameter called Relative Diagnostic Index (RDI). RDI of a sample is defined as:
| (1) |
where ISERSsample is SERS intensity of that sample, ISERSblank is SERS intensity of blank sample. Based on the definition, the higher RDI of a sample indicates the higher amount of complementary target DNA exists in that sample since its SERS intensity ISERSsample is smaller. RDI-based DNA quantitative analysis is shown in Fig. 6 inset. From the inset, proportional relationship between the amount of complementary target DNA and RDI is clearly observed.
4 Conclusions
We have demonstrated a novel label-free DNA biosensor based on MS immobilized on Nanowave/MFON substrate. This MS-Nanowave based DNA biosensor is relatively easy to fabricate at low-cost and can specifically detect a complementary target DNA, such as the RSAD2 inflammation biomarker gene. The results indicate the possibility for quantitative analysis. Because the target does not need labeling and secondary hybridization or post-hybridization washing is not required, the DNA biosensor is simple to use, has rapid assay time, low reagent usage, and is cost effective. The use of SERS as the readout technique will allow high selectivity, potentially high level of multiplexing analysis, and avoids photobleaching often encountered in fluorescence detection schemes. Since the sensor is based on a solid substrate, our method could be extended to microarray chip platform, which is suitable for high throughput analysis. With portable and handheld Raman readers now commercially available, this biosensor has potential applications for point-of-care disease diagnosis and chemical and biological detection in the field.
Acknowledgments
This work was sponsored by the National Institutes of Health (Grants R01 EB006201). Hoan Thanh Ngo is supported by a Fellowship from the Vietnam Education Foundation. Andrew M. Fales is supported by a training Grant from the National Institutes of Health (T32 EB001040).
Footnotes
Author Contributions: The manuscript was written through contributions of all authors. All authors have given approval to the final version of the manuscript.
Notes: The authors declare no competing financial interest.
References
- 1.Henry OYF, O'Sullivan CK. TrAC, Trends Anal Chem. 2012;33:9–22. [Google Scholar]
- 2.Palchetti I, Mascini M. Analyst. 2008;133:846–854. doi: 10.1039/b802920m. [DOI] [PubMed] [Google Scholar]
- 3.Lee TMH. Sensors. 2008;8:5535–5559. doi: 10.3390/s8095535. [DOI] [PMC free article] [PubMed] [Google Scholar]
- 4.Taton TA, Mirkin CA, Letsinger RL. Science. 2000;289:1757–1760. doi: 10.1126/science.289.5485.1757. [DOI] [PubMed] [Google Scholar]
- 5.Zanoli LM, D'Agata R, Spoto G. Anal Bioanal Chem. 2012;402:1759–1771. doi: 10.1007/s00216-011-5318-3. [DOI] [PubMed] [Google Scholar]
- 6.Parab HJ, Jung C, Lee JH, Park HG. Biosens Bioelectron. 2010;26:667–673. doi: 10.1016/j.bios.2010.06.067. [DOI] [PubMed] [Google Scholar]
- 7.Shin Ae K, Kyung Min B, Kyujung K, Sung Min J, Kyungjae M, Youngjin O, Donghyun K, Sung Guk K, Michael LS, Sung June K. Nanotechnology. 2010;21:355503. [Google Scholar]
- 8.Hahm J, Lieber CM. Nano Lett. 2004;4:51–54. [Google Scholar]
- 9.Culha M, Cullum B, Lavrik N, Klutse CK. J Nanotechnol. 2012;2012:15. [Google Scholar]
- 10.Vo-Dinh T, Hiromoto MYK, Begun GM, Moody RL. Anal Chem. 1984;56:1667–1670. [Google Scholar]
- 11.Meier M, Wokaun A, Vodinh T. J Phys Chem. 1985;89:1843–1846. [Google Scholar]
- 12.Vo-Dinh T, Meier M, Wokaun A. Anal Chim Acta. 1986;181:139–148. [Google Scholar]
- 13.Vo-Dinh T, Dhawan A, Norton SJ, Khoury CG, Wang HN, Misra V, Gerhold MD. J Phys Chem C. 2010;114:7480–7488. doi: 10.1021/jp911355q. [DOI] [PMC free article] [PubMed] [Google Scholar]
- 14.Yuan H, Liu Y, Fales AM, Li YL, Liu J, Vo-Dinh T. Anal Chem. 2012;85:208–212. doi: 10.1021/ac302510g. [DOI] [PMC free article] [PubMed] [Google Scholar]
- 15.Dick LA, McFarland AD, Haynes CL, Van Duyne RP. J Phys Chem B. 2001;106:853–860. [Google Scholar]
- 16.Willets KA, Van Duyne RP. Annu Rev Phys Chem. 2007;58:267–297. doi: 10.1146/annurev.physchem.58.032806.104607. [DOI] [PubMed] [Google Scholar]
- 17.Rowe AA. Chem Eng News. 2009;87:36–38. [Google Scholar]
- 18.Vo-Dinh T. TrAC, Trends Anal Chem. 1998;17:557–582. [Google Scholar]
- 19.Stiles PL, Dieringer JA, Shah NC, Van Duyne RP. Annu Rev Anal Chem. 2008;1:601–626. doi: 10.1146/annurev.anchem.1.031207.112814. [DOI] [PubMed] [Google Scholar]
- 20.Zhang X, Young MA, Lyandres O, Van Duyne RP. J Am Chem Soc. 2005;127:4484–4489. doi: 10.1021/ja043623b. [DOI] [PubMed] [Google Scholar]
- 21.Ma K, Yuen JM, Shah NC, Walsh JT, Glucksberg MR, Van Duyne RP. Anal Chem. 2011;83:9146–9152. doi: 10.1021/ac202343e. [DOI] [PMC free article] [PubMed] [Google Scholar]
- 22.Vo-Dinh T, Houck K, Stokes DL. Anal Chem. 1994;66:3379–3383. doi: 10.1021/ac00092a014. [DOI] [PubMed] [Google Scholar]
- 23.Culha M, Stokes D, Allain LR, Vo-Dinh T. Anal Chem. 2003;75:6196–6201. doi: 10.1021/ac0346003. [DOI] [PubMed] [Google Scholar]
- 24.Peng HI, Miller BL. Analyst. 2011;136:436–447. doi: 10.1039/c0an00636j. [DOI] [PubMed] [Google Scholar]
- 25.Zhang H, Harpster MH, Wilson WC, Johnson PA. Langmuir. 2012;28:4030–4037. doi: 10.1021/la204890t. [DOI] [PubMed] [Google Scholar]
- 26.Johnson RP, Richardson JA, Brown T, Bartlett PN. J Am Chem Soc. 2012;134:14099–14107. doi: 10.1021/ja304663t. [DOI] [PubMed] [Google Scholar]
- 27.Li M, Cushing SK, Liang H, Suri S, Ma D, Wu N. Anal Chem. 2013;85:2072–2078. doi: 10.1021/ac303387a. [DOI] [PubMed] [Google Scholar]
- 28.Faulds K, Smith WE, Graham D. Anal Chem. 2003;76:412–417. doi: 10.1021/ac035060c. [DOI] [PubMed] [Google Scholar]
- 29.Fabris L, Dante M, Braun G, Lee SJ, Reich NO, Moskovits M, Nguyen TQ, Bazan GC. J Am Chem Soc. 2007;129:6086–6087. doi: 10.1021/ja0705184. [DOI] [PubMed] [Google Scholar]
- 30.Sun L, Yu CX, Irudayaraj J. Anal Chem. 2007;79:3981–3988. doi: 10.1021/ac070078z. [DOI] [PMC free article] [PubMed] [Google Scholar]
- 31.Wei X, Su S, Guo Y, Jiang X, Zhong Y, Su Y, Fan C, Lee ST, He Y. Small. 2013 doi: 10.1002/smll.201202914. [DOI] [PubMed] [Google Scholar]
- 32.Li JM, Ma WF, You LJ, Guo J, Hu J, Wang CC. Langmuir. 2013 [Google Scholar]
- 33.Wang HN, Dhawan A, Du Y, Batchelor D, Leonard DN, Misra V, Vo-Dinh T. Phys Chem Chem Phys. 2013;15:6008–6015. doi: 10.1039/c3cp00076a. [DOI] [PMC free article] [PubMed] [Google Scholar]
- 34.Wabuyele MB, Vo-Dinh T. Anal Chem. 2005;77:7810–7815. doi: 10.1021/ac0514671. [DOI] [PubMed] [Google Scholar]
- 35.Tyagi S, Kramer FR. Nat Biotechnol. 1996;14:303–308. doi: 10.1038/nbt0396-303. [DOI] [PubMed] [Google Scholar]
- 36.Zhang Y, Tang Z, Wang J, Wu H, Maham A, Lin Y. Anal Chem. 2010;82:6440–6446. doi: 10.1021/ac1006238. [DOI] [PubMed] [Google Scholar]
- 37.Peng HI, Strohsahl CM, Leach KE, Krauss TD, Miller BL. ACS Nano. 2009;3:2265–2273. doi: 10.1021/nn900112e. [DOI] [PubMed] [Google Scholar]
- 38.Dolatabadi JEN, Mashinchian O, Ayoubi B, Jamali AA, Mobed A, Losic D, Omidi Y, de la Guardia M. TrAC, Trends Anal Chem. 2011;30:459–472. [Google Scholar]
- 39.Bercovici M, Kaigala GV, Mach KE, Han CM, Liao JC, Santiago JG. Anal Chem. 2011;83:4110–4117. doi: 10.1021/ac200253x. [DOI] [PMC free article] [PubMed] [Google Scholar]
- 40.Algar WR, Massey M, Krull UJ. TrAC, Trends Anal Chem. 2009;28:292–306. [Google Scholar]
- 41.Bonanni A, Pumera M. ACS Nano. 2011;5:2356–2361. doi: 10.1021/nn200091p. [DOI] [PubMed] [Google Scholar]
- 42.Chin KC, Cresswell P. Proc Natl Acad Sci U S A. 2001;98:15125–15130. doi: 10.1073/pnas.011593298. [DOI] [PMC free article] [PubMed] [Google Scholar]
- 43.Fitzgerald KA. J Interferon Cytokine Res. 2011;31:131–135. doi: 10.1089/jir.2010.0127. [DOI] [PMC free article] [PubMed] [Google Scholar]
- 44.Zaas AK, Chen M, Varkey J, Veldman T, Hero AO, Lucas J, Huang Y, Turner R, Gilbert A, Lambkin-Williams R, ⊘ien NC, Nicholson B, Kingsmore S, Carin L, Woods CW, Ginsburg GS. Cell Host Microbe. 2009;6:207–217. doi: 10.1016/j.chom.2009.07.006. [DOI] [PMC free article] [PubMed] [Google Scholar]
- 45.Barcelo SJ, Lam ST, Gibson GA, Sheng X, Henze D. Proc SPIE Alternative Lithographic Technologies IV, 83232L. 2012;8323 [Google Scholar]
- 46.Dai Z, Li Y, Duan G, Jia L, Cai W. ACS Nano. 2012;6:6706–6716. doi: 10.1021/nn3013178. [DOI] [PubMed] [Google Scholar]
- 47.Zhang JT, Wang L, Lamont DN, Velankar SS, Asher SA. Angew Chem Int Ed. 2012;51:6117–6120. doi: 10.1002/anie.201105439. [DOI] [PubMed] [Google Scholar]
- 48.Khoury CG, Norton SJ, Vo-Dinh T. ACS Nano. 2009;3:2776–2788. doi: 10.1021/nn900664j. [DOI] [PMC free article] [PubMed] [Google Scholar]
- 49.Khoury CG, Vo-Dinh T. J Phys Chem C. 2012;116:7534–7545. doi: 10.1021/jp2120669. [DOI] [PMC free article] [PubMed] [Google Scholar]
- 50.Palik ED. Handbook of Optical Constants of Solids. Academic Press; San Diego: 1998. [Google Scholar]
- 51.Herne TM, Tarlov MJ. J Am Chem Soc. 1997;119:8916–8920. [Google Scholar]
- 52.Demers LM, Mirkin CA, Mucic RC, Reynolds RA, Letsinger RL, Elghanian R, Viswanadham G. Anal Chem. 2000;72:5535–5541. doi: 10.1021/ac0006627. [DOI] [PubMed] [Google Scholar]
- 53.Le Ru EC, Blackie E, Meyer M, Etchegoin PG. J Phys Chem C. 2007;111:13794–13803. [Google Scholar]
- 54.Du H, Strohsahl CM, Camera J, Miller BL, Krauss TD. J Am Chem Soc. 2005;127:7932–7940. doi: 10.1021/ja042482a. [DOI] [PubMed] [Google Scholar]
- 55.Cao YWC, Jin RC, Mirkin CA. Science. 2002;297:1536–1540. doi: 10.1126/science.297.5586.1536. [DOI] [PubMed] [Google Scholar]
- 56.Cederquist KB, Keating CD. Langmuir. 2010;26:18273–18280. doi: 10.1021/la1031703. [DOI] [PMC free article] [PubMed] [Google Scholar]
- 57.Peterson AW, Heaton RJ, Georgiadis RM. Nucleic Acids Res. 2001;29:5163–5168. doi: 10.1093/nar/29.24.5163. [DOI] [PMC free article] [PubMed] [Google Scholar]
- 58.Kjallman THM, Peng H, Soeller C, Travas-Sejdic J. Anal Chem. 2008;80:9460–9466. doi: 10.1021/ac801567d. [DOI] [PubMed] [Google Scholar]


