

Abstract
Fluorescent sensors are powerful tools for visualizing and quantifying molecules and ions in living cells. A variety of small molecule and genetically encoded sensors have been developed for studying intracellular Zn2+ homeostasis and signaling, but no direct comparisons exist making it challenging for researchers to identify the appropriate sensor for a given application. Here we directly compare the widely used small molecule probe FluoZin-3 and a genetically encoded sensor, ZapCY2. We demonstrate that, in contrast to FluoZin-3, ZapCY2 exhibits a well defined cytosolic localization, provides estimates of Zn2+ concentration with little variability, does not perturb cytosolic Zn2+ levels, and exhibits rapid Zn2+ response dynamics. ZapCY2 was used to measure Zn2+ concentrations in 5 different cell types, revealing higher cytosolic Zn2+ levels in prostate cancer cells compared to normal prostate cells (although the total zinc is reduced in prostate cancer cells) , suggesting distinct regulatory mechanisms.
Keywords: Zinc, genetically encoded sensor, FluoZin-3, FRET
Fluorescent sensors have become instrumental tools in cell biology, permitting researchers to visualize specific ions, molecules, and biochemical reactions in the complex environment of a cell. There are now over 120 genetically encoded fluorescent sensors for different targets2, and hundreds of small molecule fluorescent indicators. Increasingly, such tools are used to quantify the amount of a particular entity, such as concentration of a metal ion or the kinetics of ion fluxes. A substantial challenge for users is how to rigorously compare sensors and evaluate quantitative estimates obtained using different probes, particularly given the vast array of probes with different molecular designs, biochemical, and photophysical characteristics 2-4. For example, there is considerable disagreement among the measurements of accessible Zn2+ in cells using different tools, with estimates varying by three orders of magnitude and ranging from 5 to 1000 pM 5-14. One possible explanation for this variability could be the use of different cell types. Indeed the above estimates include red blood cells, leukemic cells, splenocytes, thymocytes, cardiomyocytes, rat PC-12 cells, HT-29 cells, HEK 293 cells, insulin secreting INS-1 (832/13) cells, hepatocytes, neurons, and HeLa epithelial cells. Because few studies compare a range of cell types, it is difficult to evaluate whether these differences reflect natural variation in cells with different Zn2+ regulatory mechanisms, or whether estimates vary due to the use of different probes and measurement conditions.
Zn2+ has been documented to influence many cellular processes, including proliferation, differentiation, and apoptosis15-16, as well as inhibit enzymes such as caspases and phosphatases at concentrations ranging from pM to nM 1, 17. Yet the precise concentration of accessible Zn2+, its spatial distribution, and the conditions under which levels are dynamic are poorly understood. One of the major challenges in the field is that there have been no quantitative measurements of the distribution of free Zn2+ in a diversity of cell types and an assessment of how this picture changes with cellular state. Thus, the range of physiological concentrations remains ill-defined.
Here we establish a general framework for comparing and validating fluorescent probes for Zn2+, enabling newly developed tools and probes from different classes (e.g. small molecule versus genetically encoded) to be benchmarked against existing tools. By comparing the widely-used small molecule zinc sensor FluoZin-3 18 with a representative genetically encoded sensor ZapCY2 (Kd: 811 pM, n=0.44) 12, we reveal that indeed different probes can yield substantially different results. Given the dizzying array of new probes and the increasing incidence with which they are used to measure biological processes such a framework will be critically important for the scientific community, both probe developers and the end-users. Lastly, using the validated genetically encoded sensor ZapCY2 we compare the cytosolic Zn2+ levels in five cell types, revealing an increase in accessible cytosolic Zn2+ in a prostate cancer cell line compared to a normal prostate cell line.
Results and Discussion
Establishing subcellular localization
There is growing evidence that the subcellular distribution of Zn2+ is inhomogeneous, with different concentrations in different organelles12-13, 19-20. Therefore, when quantifying cellular Zn2+ levels it is essential to precisely define the identity of the compartment being measured. The location of genetically encoded sensors can be controlled by incorporation of a signal peptide into the sensor and the sensor can be explicitly targeted to the cytosol by incorporation of a nuclear exclusion signal (Figure S1). FluoZin-3 is a widely used small molecule Zn2+ indicator, employed in hundreds of publications. This membrane permeable dye is trapped inside cells upon cleavage of the acetoxymethyl (AM) ester by cellular esterases21. The localization of FluoZin-3 is not precisely defined and the dye is at least partially sequestered into intracellular compartments. Moreover, the localization of the dye varies with cell type. Indeed, FluoZin-3 has been used as a cytosolic Zn2+ sensor22-25. But it has also been used as an indicator for vesicular Zn2+ 26-27, and lysosomal Zn2+ in oxidative neurons28, and vesicles in HeLa cells when the expression of ZIP13 is reduced 29.
In our hands in HeLa cells, FluoZin-3 partially co-localizes with a Golgi marker (Fig 1, Fig S2a-c, Table S1, Pearson's coefficient = 0.60±0.18), but is also present in the cytosol, as evidenced by the increase in cytosolic fluorescence upon treatment with Zn2+ (Fig 1 g). The high fluorescence signal in Golgi compared to other regions didn't decrease upon zinc chelation with 100 μM TPEN (Fig 1e), suggesting that the high signal in Golgi was not due to high Zn2+, but rather to accumulation of the dye. In cultured cortical neurons and insulin-secreting MIN6 cells FluoZin-3 showed poor co-localization with a Golgi marker (FigS2, Table S1, Pearson's coefficient = 0.41±0.32 for neurons, and 0.37±0.40 for MIN6).
Figure 1. Localization of FluoZin-3 in HeLa cells and cultured cortical neurons.

Fluorescence image of mCherry-GalT Golgi marker in HeLa (a) and mCherry-VAMP2 in neurons (f). FluoZin-3 staining at rest in HeLa (b) and neurons (g), after treatment with 100 μM TPEN (c, h), and after incubation with 100 μM ZnCl2 and 5 μM pyithione (d, i). Overlay of Golgi (red) with FluoZin-3 (green) for HeLa (e) and VAMP2 (red) with FluoZin-3 (green) for neurons (j). Threshold of images at low zinc level (b,c and g,h) is adjusted lower than images for zinc saturation (d, i) to enable visualization with naked eyes. Images b and c are thresholded at the same level, and g and h are thresholded at the same level.
Instead, in neurons, FluoZin-3 partially co-localized with the synaptic vesicle marker VAMP2 (Fig 1, Fig S2g-i, Table S1, Pearson's coefficient = 0.66±0.19). However, the dye was also present in the cytosol and nucleus as treatment with 5μM pyrithione and 100 μM ZnCl2 (Fig 1h) yielded bright fluorescent signals in both locations.
Quantifying intracellular Zn2+
. Comparing cytosolic Zn2+ concentration ([Zn2+]) in different cells or in cells of different diseased states is an important step in evaluating how resting Zn2+ levels, and deviations from resting levels, influence cellular function. The most precise estimates of [Zn2+] involve calibration of the sensor in the cellular milieu and determination of the percent saturation of the sensor in each individual cell, followed by conversion to [Zn2+]. Figure 2 presents representative calibrations of ZapCY2 and FluoZin-3. Each trace represents an individual cell and it is evident that even under resting conditions, there is substantial variability in the FRET ratio (ZapCY2) or fluorescence intensity (FluoZin-3) from cell-to-cell. However, when the parameters of the in situ calibration were used to determine the percent saturation of the sensor, ZapCY2 exhibited a narrow distribution (26.7-28.3%, Figure 2a), whereas the variability was much greater for FluoZin-3 in HeLa cells (15.1-41.1%, Fig 2b).
Figure 2. Reduced signal variability and zinc buffering of ZapCY2 compared to FluoZin-3.

a) HeLa cells expressing ZapCY2(a) or loaded with FluoZin-3 (b) and subjected to calibration. Percent saturation of ZapCY2 and estimated [Zn2+] at rest as a function of intracellular [sensor] (c) and for FluoZin-3as a function of the extracellular [FluoZin-3] used to treat cells (fit to an exponential decay) (d). Intracellular [FluoZin-3] is typically ~100x higher than the extracellular concentration. Data are from 6 cells at each concentration. e) Cytosolic [Zn2+] in different cell types. Box represents middle quartiles and whiskers represent upper and lower quartile (full statistics in Table S2).
Another important consideration for accurately comparing cellular [Zn2+] is the extent to which the sensors themselves perturb free ion levels. In particular, if the [sensor] inside cells is comparable to the buffered Zn2+ pool, the sensor could lead to depletion of free Zn2+ 30. To test whether sensors perturb the free Zn2+ pool, the fractional saturation was measured as a function of [sensor]. For ZapCY2, the percent saturation of sensor was maintained from 23% to 32% in different cells and was not greatly affected by [sensor] (Fig 2c). Conversely for FluoZin-3, the percent saturation varied from 45 to 20% and decreased with increasing [FluoZin-3] (Fig 2d), indicating that estimates of free Zn2+ with FluoZin-3 depend on the amount of dye internalized.
Comparison of intracellular Zn2+ in different cells
ZapCY2 was used to compare the free Zn2+ levels in 5 cell types under resting conditions. Full in situ calibrations were carried out for HeLa, RWPE, LNCaP, MIN6 and primary cultured cortical neurons and the resting FRET ratio was converted into a [Zn2+], yielding estimates of mean cytosolic Zn2+ of ~ 60 pM for normal RWPE1 cells, ~ 270 pM for cancerous LNCaP cells, ~110 pM in MIN6 and 80 pM in Neurons (Fig 2e). While there can be substantial variability in [Zn2+] in some cell types (note LNCaP), on average, the cytosolic Zn2+ in cancerous LNCaP is significantly higher than normal RWPE (P < 0.001).
In vivo kinetic response
Lastly, we compared the temporal response of ZapCY2 and FluoZin-3 upon acute manipulation of intracellular Zn2+. MIN6 cells were used to exploit their voltage-gated calcium channels (L-VGCC) that open upon depolarization and are permeable to Zn2+ 31. When MIN6 cells were treated with Zn2+ under depolarization conditions both sensors showed an increased signal and more rapid response compared to cells treated with ZnCl2 alone (Fig 3a and b). In both conditions, ZapCY2 showed a quicker response compared to FluoZin-3. To rule out the possibility that this phenomenon was caused by the affinity difference (ZapCY2 is saturated at lower [Zn2+] than FluoZin-3), MIN6 cells were treated with pyrithione and ZnCl2 to ensure rapid influx of high levels of Zn2+. Under these conditions, saturation of ZapCY2 occurred more rapidly than FluoZin-3 (Fig 3c). One explanation for the kinetic difference could be that the [FluoZin-3] is much higher than [ZapCY2] in cells. To test this, we treated MIN6 cells with different [FluoZin-3] (0.5-10 μM) for 40 minutes, then perfused the cells with 5 μM pyrithione and 100 μM ZnCl2. Cells with a lower amount of FluoZin-3 reached the maximal intensity faster than the cells with higher FluoZin-3 (Fig 3d). However the rate of entry was still slower than for ZapCY2. Computational simulations also provided supporting evidence that cells with higher [dye] display slower kinetics (Fig S3).
Figure 3. Comparison of the temporal response of FluoZin-3 and ZapCY2 in MIN6 cells.

The increase in intracellular Zn2+ was induced by incubation with 100 μM ZnCl2 (a), 50 mM KCl and 100μM ZnCl2 (b), or 5 μM pyrithione and 100 μM ZnCl2 (c). MIN6 cells loaded with 0.5 μM, 2 μM, 5 μM or 10 μM FluoZin-3 were treated with pyrithione/100 μM ZnCl2 (d). Data are reported as saturation percentage [(F-F0)/(Fmax-F0)%]. Each plot represents the average and S.E.M. of at least five cells. (e) Simulation of Zn2+ binding kinetics of FluoZin-3. In this simulation model, higher concentrations of FluoZin-3 would take longer time to reach the saturation.
In summary, ZapCY2 exhibited a number of distinct advantages when compared to FluoZin-3. First, the localization can be explicitly defined to be cytosolic, whereas FluoZin-3 reports on Zn2+ changes within the cytosol as well as membrane enclosed compartments, and that localization varies significantly with cell type (Fig.1 and Fig. S1). Hence interpretation of FluoZin-3 data is confounded by an inability to precisely define where the Zn2+ changes are occurring. This may explain why estimates of cytosolic Zn2+ using FluoZin-36, 32 are typically higher than estimates using genetically encoded sensors12-13, particularly in cells containing vesicular Zn2+. In addition, the accumulation of FluoZin-3 in subcellular compartments such as the Golgi leads to high fluorescence (Fig. 1) which may be incorrectly interpreted as elevated Zn2+ unless an in situ calibration is performed.
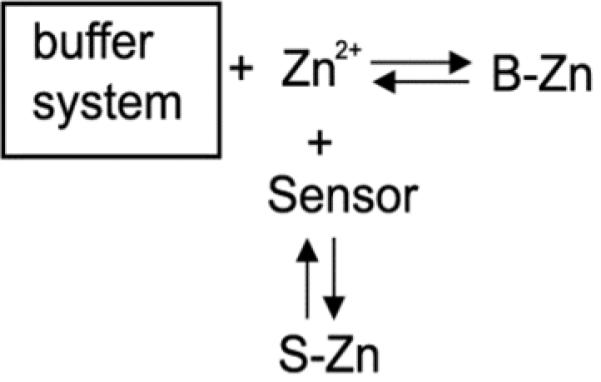
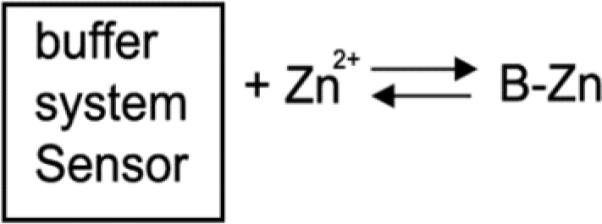
A second advantage is that in distinct contrast to FluoZin-3, ZapCY2 does not appear to perturb the resting free Zn2+ pool. Scheme 1 presents a simplified model of Zn2+ homeostasis and illustrates the potential of an exogenous sensor to perturb steady state Zn2+. This scheme suggests that if the [sensor] approaches that of the buffer system, the sensor may deplete the cellular ion pool. In this work we measured the free Zn2+ as a function of [sensor] for ZapCY2 and FluoZin-3. We found that while free Zn2+ estimates based on ZapCY2 were independent of the intracellular [sensor] (Fig 2c), there was a strong dependence with increasing FluoZin-3, leading to a significant decrease in the measured fractional saturation (Fig 2d), suggesting depletion of the cellular ion pool. This is consistent with previous studies using FluoZin-3 in human colon cancer (HT-29) cells and neurons6, 30, and likely results from the fact that AM ester versions of Zn2+ indicators are typically concentrated at least 100-fold, yielding intracellular concentrations in the hundreds of micromolar6, 30. The total buffered Zn2+ pool in mammalian cells has been estimated in the hundreds of μM6, 33-34, so it's possible that the lower levels of ZapCY2 (1-10 μM) compared to the amount of internalized FluoZin-3 (hundreds of μM) are not sufficient to perturb the equilibrium and deplete the Zn2+ pool. However another difference between the two probes is that measurements with genetically encoded sensors are performed days after introduction of the sensor into cells whereas those with FluoZin-3 are performed within a few hours of loading the dye, due to extrusion of the dye over time. Perhaps long term expression of ZapCY2 allows it to become part of the zinc buffer system, as represented in Scheme 2.
Scheme 1.
Scheme 2.
Lastly, a final advantage of ZapCY2 is the rapid in vivo response compared to FluoZin-3 (Fig 4). We suspect that the relatively rapid response of ZapCY2 results from the fact that there is significantly less sensor within the cell and hence saturation of the sensor occurs more quickly. This was supported by kinetic modeling showing that higher concentrations of sensor lead to slower kinetic responses. These data suggest that ZapCY2 might be a better tool for studying zinc uptake and efflux kinetics compared to FluoZin-3.
Given the wide range of estimates for resting free Zn2+ levels and the scarcity of studies that directly compare Zn2+ in a range of diverse cell types, we used ZapCY2 to compare relative Zn2+ levels in 3 types of epithelial cells: HeLa, normal prostate RWPE1, and cancerous prostate LNCaP, as well as neurons and a model pancreatic beta cell line (MIN6). We found no difference in cytosolic Zn2+ between HeLa, MIN6, and cortical neurons, but a significant decrease in RWPE1, and an increase in the LNCaP. The higher level of free Zn2+ in the cytosol of LNCaP versus RWPE1 is particularly intriguing given that it is well established that total Zn2+ levels in prostate cancer cells are lower than normal cells and that Zn2+ content strongly correlates with metastasis35. Indeed, using inductively coupled mass spectrometry (ICP-MS) we verified that total cellular Zn2+ in LNCaP is 65% lower than in RWPE1 cells (Fig S3). Thus, our study reveals the importance of defining Zn2+ levels in explicit subcellular locations and reveals for the first time that cytosolic Zn2+ is actually higher in the prostate cancer cell line, despite lower levels of total Zn2+. It is interesting to speculate that high cytosolic Zn2+ in cancer cells may contribute to these cells being more refractory toward apoptosis, as Zn2+ can inhibit caspase 3 activity and repress apoptosis 1. If this is the case, addition of a Zn2+ chelator might be used to induce apoptosis in cancer cells, an approach that has been used in the development of new agents for reducing tumor size in animal models36.
In conclusion, direct comparisons between ZapCY2 and FluoZin-3 showed that the genetically encoded sensor can overcome many limitations of this small molecule sensor when the experimental goal is to define Zn2+ in a precise location (such as the cytosol), to minimize perturbation of the cellular ion pool, facilitate Zn2+ quantification, and report the kinetics of cellular Zn2+ dynamics.
Methods
Details of the plasmids, culture, transfection conditions for all cells, method for quantifying sensor concentration in cells and FluoZin3 staining colocalization analysis are provided in Supporting Information.
Cellular Zn2+ Measurements
Imaging experiments were performed on a Zeiss Axiovert 200M inverted fluorescence microscope configured as previously described 12. Images were collected with a 40X 1.3NA oil objective, using a5% light transmission, and 300 msec exposure time. Images of ZapCY2 were background corrected by generating a region of interest (ROI) on a blank area of the coverslip and subtracting the fluorescence intensity of each channel, e.g. IFRET(sample) – IFRET(background), and ICFP(sample) – ICFP(background). The background corrected FRET and CFP images were used to calculate the FRET ratio (R, i.e. FRET/CFP). Images of FluoZin-3 were not background corrected because the resting signal was very low and close to the background.
Cells were imaged in phosphate-free HHBSS, pH = 7.4 to prevent precipitation of zinc. To carry out in situ calibrations, cells were treated with 150 μM cell permeable zinc chelator N,N,N’,N’-tetrakis (1-pyridylmethyl) ethylenediamine (TPEN) to obtain the FRET ratio at minimum Zn2+ (Rmin) and addition of 5 μM pyrithione and 10 or 100 μM ZnCl2 to establish the FRET ratio at maximum Zn2+ (Rmax).
Statistical analysis
Statistical analysis was performed using the t-test in the KaleidaGraph program. The error bars indicate SEM (standard error of the mean).
Supplementary Material
Acknowledgments
Funding Sources
NIH Predoctoral Fellowship (F31 GM093443 (J.G.M), UROP and HHMI Undergraduate Research Fellowship (C.I.S.), NIH Molecular Biophysics Training Grant (T32 GM-065103) and NSF Computational Optical Sensing and Imaging IGERT 0801680 (K.M.D.), and NIH GM084027 and Alfred P. Sloan Foundation (A.E.P.).
ABBREVIATIONS
- FRET
Förster resonance energy transfer
- KD’
dissociation constant
- Zn2+
free Zn2+ concentration
- sensor
sensor concentration
Footnotes
Author Contributions
The manuscript was written through contributions of all authors. All authors have given approval to the final version of the manuscript.
Supporting Information
Other methods and results are listed in Supporting Information. This material is available free of charge via the Internet at http://pubs.acs.org.
REFERENCES
- 1.Perry DK, Smyth MJ, Stennicke HR, Salvesen GS, Duriez P, Poirier GG, Hannun YA. Zinc is a potent inhibitor of the apoptotic protease, caspase-3. A novel target for zinc in the inhibition of apoptosis. J Biol Chem. 1997;272:18530–18533. doi: 10.1074/jbc.272.30.18530. [DOI] [PubMed] [Google Scholar]
- 2.Newman RH, Fosbrink MD, Zhang J. Genetically encodable fluorescent biosensors for tracking signaling dynamics in living cells. Chem Rev. 2011;111:3614–3666. doi: 10.1021/cr100002u. [DOI] [PMC free article] [PubMed] [Google Scholar]
- 3.Dean KM, Qin Y, Palmer AE. Visualizing metal ions in cells: An overview of analytical techniques, approaches, and probes. Biochim Biophys Acta. 2012 doi: 10.1016/j.bbamcr.2012.04.001. [DOI] [PMC free article] [PubMed] [Google Scholar]
- 4.Que EL, Domaille DW, Chang CJ. Metals in neurobiology: probing their chemistry and biology with molecular imaging. Chem Rev. 2008;108:1517–1549. doi: 10.1021/cr078203u. [DOI] [PubMed] [Google Scholar]
- 5.Bozym RA, Thompson RB, Stoddard AK, Fierke CA. Measuring picomolar intracellular exchangeable zinc in PC-12 cells using a ratiometric fluorescence biosensor. ACS Chem Biol. 2006;1:103–111. doi: 10.1021/cb500043a. [DOI] [PubMed] [Google Scholar]
- 6.Krezel A, Maret W. Zinc-buffering capacity of a eukaryotic cell at physiological pZn. J Biol Inorg Chem. 2006;11:1049–1062. doi: 10.1007/s00775-006-0150-5. [DOI] [PubMed] [Google Scholar]
- 7.Simons TJ. Intracellular free zinc and zinc buffering in human red blood cells. J Membr Biol. 1991;123:63–71. doi: 10.1007/BF01993964. [DOI] [PubMed] [Google Scholar]
- 8.Adebodun F, Post JF. Role of intracellular free Ca(II) and Zn(II) in dexamethasone-induced apoptosis and dexamethasone resistance in human leukemic CEM cell lines. J Cell Physiol. 1995;163:80–86. doi: 10.1002/jcp.1041630109. [DOI] [PubMed] [Google Scholar]
- 9.Zalewski PD, Forbes IJ, Betts WH. Correlation of apoptosis with change in intracellular labile Zn(II) using zinquin [(2-methyl-8-p-toluenesulphonamido-6-quinolyloxy)acetic acid], a new specific fluorescent probe for Zn(II). Biochem J. 1993;296(Pt 2):403–408. doi: 10.1042/bj2960403. [DOI] [PMC free article] [PubMed] [Google Scholar]
- 10.Brand IA, Kleineke J. Intracellular zinc movement and its effect on the carbohydrate metabolism of isolated rat hepatocytes. J Biol Chem. 1996;271:1941–1949. doi: 10.1074/jbc.271.4.1941. [DOI] [PubMed] [Google Scholar]
- 11.Sensi SL, Canzoniero LM, Yu SP, Ying HS, Koh JY, Kerchner GA, Choi DW. Measurement of intracellular free zinc in living cortical neurons: routes of entry. J Neurosci. 1997;17:9554–9564. doi: 10.1523/JNEUROSCI.17-24-09554.1997. [DOI] [PMC free article] [PubMed] [Google Scholar]
- 12.Qin Y, Dittmer PJ, Park JG, Jansen KB, Palmer AE. Measuring steady-state and dynamic endoplasmic reticulum and Golgi Zn2+ with genetically encoded sensors. Proc Natl Acad Sci U S A. 2011;108:7351–7356. doi: 10.1073/pnas.1015686108. [DOI] [PMC free article] [PubMed] [Google Scholar]
- 13.Vinkenborg JL, Nicolson TJ, Bellomo EA, Koay MS, Rutter GA, Merkx M. Genetically encoded FRET sensors to monitor intracellular Zn2+ homeostasis. Nat Methods. 2009;6:737–740. doi: 10.1038/nmeth.1368. [DOI] [PMC free article] [PubMed] [Google Scholar]
- 14.Turan B, Fliss H, Desilets M. Oxidants increase intracellular free Zn2+ concentration in rabbit ventricular myocytes. Am J Physiol. 1997;272:H2095–2106. doi: 10.1152/ajpheart.1997.272.5.H2095. [DOI] [PubMed] [Google Scholar]
- 15.Li Y, Maret W. Transient fluctuations of intracellular zinc ions in cell proliferation. Exp Cell Res. 2009;315:2463–2470. doi: 10.1016/j.yexcr.2009.05.016. [DOI] [PubMed] [Google Scholar]
- 16.Fukada T, Yamasaki S, Nishida K, Murakami M, Hirano T. Zinc homeostasis and signaling in health and diseases: Zinc signaling. J Biol Inorg Chem. 2011;16:1123–1134. doi: 10.1007/s00775-011-0797-4. [DOI] [PMC free article] [PubMed] [Google Scholar]
- 17.Wilson M, Hogstrand C, Maret W. Picomolar concentrations of free zinc(II) ions regulate receptor protein-tyrosine phosphatase beta activity. J Biol Chem. 2012;287:9322–9326. doi: 10.1074/jbc.C111.320796. [DOI] [PMC free article] [PubMed] [Google Scholar]
- 18.Gee KR, Zhou ZL, Ton-That D, Sensi SL, Weiss JH. Measuring zinc in living cells. A new generation of sensitive and selective fluorescent probes. Cell Calcium. 2002;31:245–251. doi: 10.1016/S0143-4160(02)00053-2. [DOI] [PubMed] [Google Scholar]
- 19.Sensi SL, Paoletti P, Bush AI, Sekler I. Zinc in the physiology and pathology of the CNS. Nat Rev Neurosci. 2009;10:780–791. doi: 10.1038/nrn2734. [DOI] [PubMed] [Google Scholar]
- 20.Park JG, Qin Y, Galati DF, Palmer AE. New sensors for quantitative measurement of mitochondrial Zn(2+). ACS Chem Biol. 2012;7:1636–1640. doi: 10.1021/cb300171p. [DOI] [PMC free article] [PubMed] [Google Scholar]
- 21.Tsien RY, Pozzan T, Rink TJ. Calcium homeostasis in intact lymphocytes: cytoplasmic free calcium monitored with a new, intracellularly trapped fluorescent indicator. J Cell Biol. 1982;94:325–334. doi: 10.1083/jcb.94.2.325. [DOI] [PMC free article] [PubMed] [Google Scholar]
- 22.Nicolson TJ, Bellomo EA, Wijesekara N, Loder MK, Baldwin JM, Gyulkhandanyan AV, Koshkin V, Tarasov AI, Carzaniga R, Kronenberger K, Taneja TK, da Silva Xavier G, Libert S, Froguel P, Scharfmann R, Stetsyuk V, Ravassard P, Parker H, Gribble FM, Reimann F, Sladek R, Hughes SJ, Johnson PR, Masseboeuf M, Burcelin R, Baldwin SA, Liu M, Lara-Lemus R, Arvan P, Schuit FC, Wheeler MB, Chimienti F, Rutter GA. Insulin storage and glucose homeostasis in mice null for the granule zinc transporter ZnT8 and studies of the type 2 diabetes-associated variants. Diabetes. 2009;58:2070–2083. doi: 10.2337/db09-0551. [DOI] [PMC free article] [PubMed] [Google Scholar]
- 23.Mato S, Sanchez-Gomez MV, Bernal-Chico A, Matute C. Cytosolic zinc accumulation contributes to excitotoxic oligodendroglial death. Glia. 2013 doi: 10.1002/glia.22470. [DOI] [PubMed] [Google Scholar]
- 24.Kiedrowski L. Cytosolic acidification and intracellular zinc release in hippocampal neurons. J Neurochem. 2012;121:438–450. doi: 10.1111/j.1471-4159.2012.07695.x. [DOI] [PMC free article] [PubMed] [Google Scholar]
- 25.Kiedrowski L. Cytosolic zinc release and clearance in hippocampal neurons exposed to glutamate--the role of pH and sodium. J Neurochem. 2011;117:231–243. doi: 10.1111/j.1471-4159.2011.07194.x. [DOI] [PMC free article] [PubMed] [Google Scholar]
- 26.McCormick N, Velasquez V, Finney L, Vogt S, Kelleher SL. X-ray fluorescence microscopy reveals accumulation and secretion of discrete intracellular zinc pools in the lactating mouse mammary gland. PLoS One. 2010;5:e11078. doi: 10.1371/journal.pone.0011078. [DOI] [PMC free article] [PubMed] [Google Scholar]
- 27.Qian J, Noebels JL. Visualization of transmitter release with zinc fluorescence detection at the mouse hippocampal mossy fibre synapse. J Physiol. 2005;566:747–758. doi: 10.1113/jphysiol.2005.089276. [DOI] [PMC free article] [PubMed] [Google Scholar]
- 28.Hwang JJ, Lee SJ, Kim TY, Cho JH, Koh JY. Zinc and 4-hydroxy-2-nonenal mediate lysosomal membrane permeabilization induced by H2O2 in cultured hippocampal neurons. J Neurosci. 2008;28:3114–3122. doi: 10.1523/JNEUROSCI.0199-08.2008. [DOI] [PMC free article] [PubMed] [Google Scholar]
- 29.Jeong J, Walker JM, Wang F, Park JG, Palmer AE, Giunta C, Rohrbach M, Steinmann B, Eide DJ. Promotion of vesicular zinc efflux by ZIP13 and its implications for spondylocheiro dysplastic Ehlers-Danlos syndrome. Proc Natl Acad Sci U S A. 2012;109:E3530–3538. doi: 10.1073/pnas.1211775110. [DOI] [PMC free article] [PubMed] [Google Scholar]
- 30.Dineley KE, Malaiyandi LM, Reynolds IJ. A reevaluation of neuronal zinc measurements: artifacts associated with high intracellular dye concentration. Mol Pharmacol. 2002;62:618–627. doi: 10.1124/mol.62.3.618. [DOI] [PubMed] [Google Scholar]
- 31.Gyulkhandanyan AV, Lee SC, Bikopoulos G, Dai F, Wheeler MB. The Zn2+-transporting pathways in pancreatic beta-cells: a role for the L-type voltage-gated Ca2+ channel. J Biol Chem. 2006;281:9361–9372. doi: 10.1074/jbc.M508542200. [DOI] [PubMed] [Google Scholar]
- 32.Haase H, Hebel S, Engelhardt G, Rink L. Flow cytometric measurement of labile zinc in peripheral blood mononuclear cells. Anal Biochem. 2006;352:222–230. doi: 10.1016/j.ab.2006.02.009. [DOI] [PubMed] [Google Scholar]
- 33.Takeda A. Movement of zinc and its functional significance in the brain. Brain Res Brain Res Rev. 2000;34:137–148. doi: 10.1016/s0165-0173(00)00044-8. [DOI] [PubMed] [Google Scholar]
- 34.Colvin RA, Bush AI, Volitakis I, Fontaine CP, Thomas D, Kikuchi K, Holmes WR. Insights into Zn2+ homeostasis in neurons from experimental and modeling studies. Am J Physiol Cell Physiol. 2008;294:C726–742. doi: 10.1152/ajpcell.00541.2007. [DOI] [PubMed] [Google Scholar]
- 35.Franklin RB, Feng P, Milon B, Desouki MM, Singh KK, Kajdacsy-Balla A, Bagasra O, Costello LC. hZIP1 zinc uptake transporter down regulation and zinc depletion in prostate cancer. Mol Cancer. 2005;4:32. doi: 10.1186/1476-4598-4-32. [DOI] [PMC free article] [PubMed] [Google Scholar]
- 36.West DC, Qin Y, Peterson QP, Thomas DL, Palchaudhuri R, Morrison KC, Lucas PW, Palmer AE, Fan TM, Hergenrother PJ. Differential Effects of Procaspase-3 Activating Compounds in the Induction of Cancer Cell Death. Mol Pharm. 2012 doi: 10.1021/mp200673n. [DOI] [PMC free article] [PubMed] [Google Scholar]
Associated Data
This section collects any data citations, data availability statements, or supplementary materials included in this article.