

Abstract
Background
Fiber-optic nanosensors are fabricated by heating and pulling optical fibers to yield sub-micron diameter tips, and have been used for in vitro analysis of individual living mammalian cells. Immobilization of bioreceptors (e.g., antibodies, peptides, DNA, etc) selective to target analyte molecules of interest provides molecular specificity. Excitation light can be launched into the fiber, and the resulting evanescent field at the tip of the nanofiber can be used to excite target molecules bound to the bioreceptor molecules. The fluorescence or surface-enhanced Raman scattering produced by the analyte molecules is detected using an ultra-sensitive photodetector.
Objective
This article provides an overview of the development and application of fiber-optic nanosensors for drug discovery.
Conclusions
The nanosensors provide minimally invasive tools to probe sub-cellular compartments inside single living cells for health effect studies (e.g., detection of benzopyrene adducts) and medical applications (e.g., monitoring of apoptosis in cells treated with anti-cancer drugs).
Keywords: benzopyrene tetrol, biosensors, fiber-optic nanoprobes, fluorescence nanosensors, intracellular caspase sensing, intracellular pH sensing, SERS nanosensors, single-cell bioanalysis
1. Introduction
Nanosensors provide powerful, versatile tools for monitoring biomolecular targets and signaling processes within single living cells, thus providing information that has the potential to greatly improve our understanding of cellular functions. Understanding of cellular processes on a single-cell level has the potential to revolutionize cell biology. Nanoscale fiber-optic sensors are particularly well-suited to examination of intracellular and intercellular physiological and biological processes. A wide variety of fiber-optic chemical sensors and biosensors have been developed in our laboratory for environmental and biochemical monitoring [1–9]. For example, tapered optical fibers with distal diameters between 20 and 500 nm have been used for near-field scanning optical microscopy (NSOM). [10, 11]. NSOM was also used to achieve sub-wavelength 100-nm spatial resolution in Raman detection [12, 13]. Additionally, chemical nanosensors have been developed for monitoring of calcium, nitric oxide, and other biologically-relevant species in single cells [14, 15]. Vo-Dinh and coworkers have developed a number of fiber-optic nanobiosensors with antibody probes to detect biochemical targets inside single living cells [16–29]. This article presents a brief overview of the development and application of several of these fiber-optic nanosensors.
Fiber-optic nanosensors with nanoscale tips were initially developed as scanning probes for near-field optical microscopy, which uses light sources or detectors that are smaller than the wavelength of light to provide enhanced spatial resolution [11]. One such probe able to make measurements with a spatial resolution of ~12 nm has been described [10]. With this nanoprobe, images of a pattern were reconstructed from a raster scan performed in illumination mode, with the probe acting as a localized light source. Due to its extremely high spatial resolution (sub-wavelength), near-field microscopy has received great interest and has been used in many applications [11]. For example, near-field surface-enhanced Raman spectroscopy (NF-SERS) has been used for measurement of single dye molecules and dye-labeled DNA with a resolution of just 100 nm [12, 13]. In this particular application, DNA strands were labeled with brilliant cresyl blue and spotted onto a SERS-active substrate prepared by evaporative deposition of silver islands onto a nanoparticle-coated substrate. The silver-coated, nanostructured substrates are able to induce the SERS effect, which is able to enhance the average Raman scattering signal of bound and adsorbed molecules up to 108 times [30]. NF-SERS spectra were collected by illuminating the sample through the nanoprobe and detecting the SERS scattering signal using a spectrometer equipped with a charge-coupled device (CCD). Raster scanning the nanoprobe over the sample produced a two-dimensional SERS image of adsorbed DNA, with subwavelength spatial resolution. Near-field optical microscopy holds promise as an area of growing research which may provide an imaging tool for monitoring individual cells and biomolecules. Single-molecule detection and imaging schemes using nanofibers have the potential to open new possibilities for investigation of complex biochemical reactions and pathways in biological systems, leading to important applications in medicine.
A biosensor can be generally defined as a device that consists of two basic components connected in series: (1) a biological recognition system, often called a bioreceptor, and (2) a transducer [8, 19]. The recognition system is aimed at providing the sensor with a high degree of selectivity for some analyte of interest. The interaction of the analyte with the bioreceptor is meant to produce an effect which can be measured by the transducer, such as a change in emission or scattering, a change in absorption, a change in mass, etc. The role of the transducer is to convert this information into some quantifiable signal, such as current or voltage.
Biosensors can use various transduction methods: (1) optical detection, (2) electrochemical detection, and (3) mass-based detection. Other detection approaches include voltaic and magnetic methods. New types of transducers are constantly being developed for use in biosensors. This article places special emphasis on optical transduction. Figure 1 illustrates the principle of the biosensing process.
Figure 1.

Operating principle of biosensor systems.
2. Development of Fiber-Optic Nanosensors
2.1 Fabrication of Nanofiber Probes
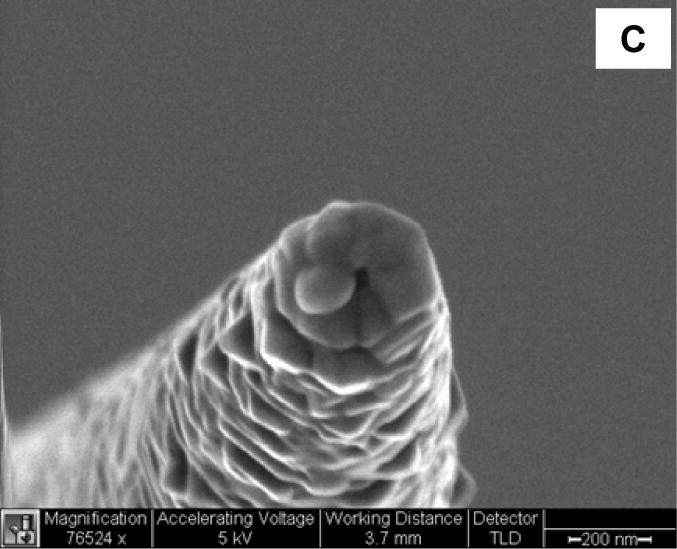
Fabrication of nanosensors requires techniques capable of making reproducible optical fibers with submicron-diameter tips. The laser pulling process is a time-dependent heating effect which takes advantage of the ease with which laser power, timing of pulling, pulling velocity, and pulling force can be adjusted to define the taper shape and tip size. Since transmission efficiency is highly dependent on the taper shape, control of the tip shape and size are absolutely critical for effective fabrication of high-quality nanoprobes. In our lab, nanoprobes are typically pulled from large-core optical fiber using a micropipette puller. Figure 2 shows a scanning election microscopy (SEM) image of a typical fiber probe fabricated in our laboratory using the heat and pull procedure [18]. The distal end of the nanofiber is approximately 40 nm in diameter.
Figure 2.

Nanoprobe fabrication. (A) SEM image of a tapered optical fiber prepared by the heat-and-pull method.
Chemical etching using HF is a second method for fabricating fiber-optic nanoprobes. There are two variations of the HF etching method. The first approach, generally referred to as Turner etching, uses a mixture of hydrofluoric acid (HF) and organic solvent [31]. The second approach uses only HF, and is known as tube etching [32–34]. In the Turner method, a fiber is placed at the meniscus between the HF and the organic overlayer. Over time, the HF dissolves the silica-based optical fiber, yielding a small tip with a smooth, large-angled taper. This large taper angle allows higher light throughput to the tip of the fiber, which in turn greatly improves the sensitivity of the nanosensors. The reproducibility of the Turner method is heavily affected by environmental parameters such as temperature and vibration because of the dual chemical nature of the etching process. To avoid this problem, a modified version of the Turner method was developed. In this variant, an optical fiber with a silica core and an organic cladding material is bathed in an HF solution. The HF slowly dissolves the silica core, again producing a fiber with a large taper angle and a nanoscale tip. The primary advantage of this second approach is that localized convective currents form in the HF solution as the HF begins to dissolve the fiber’s silica core while leaving the organic cladding material unaffected. Over time, enough of the silica core is dissolved that the fiber-HF interface rises above the surface of the HF solution. At this point in time, the HF is drawn up the cladding walls via capillary action, then runs down the silica core to produce a nanometer sized tip. Fiber tip size and taper angle can be varied by controlling the time of HF exposure and the depth to which the fiber is submerged in the HF solution. Once the tip has been formed, the remaining cladding can be removed with a suitable organic solvent or by thermal treatment. Sharp nanotips fabricated using these etching procedures, have been used in NSOM studies to detect SERS-labeled DNA molecules on solid substrates with sub-wavelength spatial resolution [12, 13].
Leakage of excitation light can occur due to the tapered sides of the fiber. To prevent this phenomenon, the sidewall of the tapered nanotips can be coated with a thin layer of metal such as silver, aluminum, or gold (100-nm thickness) using a thermal or electron-beam evaporator. Such a coating system is illustrated in Figure 3a. The fiber probe is attached on a rotating motor inside a thermal evaporation chamber [8, 17, 18]. The fiber points away from the evaporation source at an angle of approximately 25º. The metal is heated and allowed to evaporatively deposit onto the tapered sides of the fiber tip to form a thin coating while leaving the end of the tip bare. With a ~100 nm thick metal coating, the size of the ~40 nm probe tip increases to approximately 250–300 nm (Figure 3b). Since the fiber tip is pointed away from the metal source, it remains free of any metal coating (Figure 3c). The nanoaperture thus formed on the distal end of the fiber tip can then be used for optical excitation and subsequent binding with bioreceptors. The size of the nanoaperture is closely related to the angle between the fiber axis and direction of evaporation. For example, if the angle is less than 20 degrees, most of the fibers are fully covered with metal and no aperture is visible under SEM. Alternatively, fiber angles higher than 30 degrees leave a larger fraction of the distal end of the fiber tip exposed. The optimal inclination angle can be determined through characterization of nanoapertures under SEM.
Figure 3.

Nanoprobe coating with metal. (A) Schematic of a thermal evaporator used to coat tapered optical fibers with aluminum, silver, or gold. (B) SEM image of a tapered optical fiber coated with a ~100 nm thickness of silver. (C) SEM image of a silver-coated tapered optical fiber with a ~40 nm nanoaperture at the tip.
Metallic coating is a crucial step during nanoprobe construction, and various metals have been used in nanoprobe fabrication [18]. Silver has high reflectivity in the visible and IR ranges and is very stable in aqueous solution as long as strong oxidizers or complexing agents are not present. Unfortunately, silver can rapidly tarnish under ordinary atmospheric conditions, and and silver does not have high reflectance below 400 nm. As a result, silver-coated nanoprobes are most useful immediately after evaporative coating. Thin gold films have also been shown to be quite stable under environmental conditions, but reflect poorly in the blue and green regions of the visible spectrum. In addition, an interface layer such as Cr is often needed to improve adhesion between evaporatively-deposited gold and the silica surface of optical fibers. A third option is aluminum, which adheres to silica optical fibers much more strongly than silver or gold, such that no interface layer is required. In addition, aluminum is inert toward most corrosive agents due to the formation of a protective oxide layer upon contact with air. Unfortunately, aluminum is difficult to deposit as a thin, smooth film with small grain size [35]. This becomes a concern because grainy films produce high background during near-field sensing. Higher coating rates help to minimize the grain size, and ensure higher, more reproducible light throughput.
Traditionally, the manufacturing process limits the quality of metal-coated fiber probes. The optical throughput of pulled nanoprobes can be limited by the sharp taper angle. Chemically-etched tips have higher throughput, but they do not have as flat a distal end as laser pulled fibers. As a result, it can be difficult to form well-defined nanoapertures via shadow evaporation. Other concerns during fabrication include the grainy structure of evaporatively-deposited thin metal films and the potential for pin-holes in the metal coating, which then result in light leakage.
A last means of producing fiber-optic nanoprobes is Focused Ion Beam (FIB) milling. This approach has been used to physically etch nanostructures into solid metal films deposited on optical fibers for chemical sensing [36]. FIB milling allows control of nanostructure size and shape with accuracy on the order of tens of nm. We have extended the use of FIB to nanoprobe fabrication by milling an aperture with controllable shape and diameter on the tip of a tapered optical fiber. Angle evaporation can be avoided during the FIB process, thereby reducing the potential for pinhole formation. Although the technique is both time- and instrumentation-intensive, FIB milling holds promise as a means of reproducible nanoprobe fabrication.
2.2 Bioreceptors
Bioreceptors are required to provide biochemical specificity to the sensor during measurement. Bioreceptors may take many forms, but generally fall into one of five major categories: (1) antibody/antigen, (2) enzymes; (3) nucleic acids/DNA, (4) cellular structures/cells, and (5) biomimetics. The following section specifically examines antibody probes. Antigen-antibody (Ag-Ab) binding reactions, which are a key mechanism by which the immune system detects and eliminates foreign matter, provide specificity in immunoassays. Antibodies are complex biomolecules, made of hundreds of individual amino acids arranged in a highly ordered sequence. Antibodies are generated by the immune system when such cells are exposed to substances or molecules called antigens. The antibodies produced following antigen exposure have recognition/binding sites for specific molecular structures (or substructures) of the antigen. The way in which antigen and antigen-specific antibody interact is analogous to a lock-and-key fit, in which specific configurations of a unique key enable it to open a lock. In the same way, an antigen-specific antibody fits its unique antigen in a highly specific manner, such that the three-dimensional structures of antigen and antibody molecules are complementary. Due to this three-dimensional shape-fitting and the diversity inherent in individual antibody make-up, it is possible to find an antibody that can recognize and bind to any one of a large variety of molecular shapes. This unique property of antibodies is the key to their usefulness in immunosensors; this ability to recognize molecular structures allows the development of antibodies that bind specific chemicals, biomolecules, microorganism components, etc. These antibodies can then be used as specific probes to recognize and bind an analyte of interest, even at very small concentrations, within a complex mixture of other chemical substances.
Advances in spectrochemical instrumentation, laser miniaturization, biotechnology, and fiber-optic research have further provided opportunities for novel approaches to the development of sensors for the chemical and biochemical detection in the environmental and biomedical arenas. Since the first development of a remote fiber-optic immunosensor for in situ detection of the chemical carcinogen benzo[a]pyrene [1], antibodies have become common bioreceptors used in biosensors today.
2.3 Bioreceptor Immobilization
Following nanotip fabrication, the next step in the preparation of nanobiosensors involves covalent immobilization of bioreceptor molecules onto the fiber tip. For antibody binding, several strategies can be used to anchor the antibody on the sensing probe. Conceptually, one of the simplest approaches would be to enclose the antibody in a solution contained in microcavities within a semi-permeable membrane cap which fits over the end of the sensor [7]. This design is technically complicated, however, and would increase the tip size of the fiber-optic nanosensors. An alternate approach is to covalently immobilize receptors directly onto the distal end of the nanoprobe. Antibodies can be anchored onto the nanofiber probes using various chemical immobilization protocols. Whatever procedure is involved, one requirement is that the antibody must retain its antigen-binding activity to the greatest extent possible.
Silane modification techniques eliminate the nonspecific binding potential of silica for biomolecules. Modification of the silica surface provides sites for coupling affinity ligands through covalent derivatization with a silane containing some functional group. For example, reaction of silica with 3-aminopropyltriethoxysilane (APTES) under the appropriate conditions coats the surface with primary amine groups for conjugation with electrophilic groups. Selection of other silane functional groups for surface modification provides a broad range of properties for subsequent coupling of biomolecules. In our study, the fiber is derivatized in 10% (glycidyloxypropyl)trimethoxysilane (GOPS) in H2O (v/v) at 90 °C for 3 hrs. Using concentrated HCl (1M), the pH of the mixture is kept below 3. After derivatization, the fiber is washed in ethanol and dried overnight in a vacuum oven at 105°C. Because concentrated HCl will quickly turn metallic silver to silver chloride, the fiber is evaporatively coated with silver after chemical functionalization. Following silver coating, the derivatized fiber is activated in a solution of 100 mg/mL 1,1′ carbonyldiimidazole (CDI) in acetonitrile for 20 min, followed by rinsing with acetonitrile and phosphate buffered saline (PBS). Afterward, the fiber tip is incubated in a 1.2 mg/mL antibody solution (PBS solvent) for 4 days at 4°C and stored overnight in PBS to hydrolyze any unreacted sites. Long-term storage is at 4°C with the antibody immobilized tips immersed in PBS. This procedure maintains over 95% of the antibody activity [18].
3. Experimental Method and Instrumentation
3.1 Experimental Procedures
A uniquely powerful strength of fiber-optic nanosensors is their ability to study single living cells in vitro [17–19, 21–29]. Following cell culture by normal techniques, measurement with fiber-optic nanosensors typically proceeds using protocols similar to the following: a culture dish of cells is placed on a pre-warmed microscope stage or a temperature-controlled sample holder, and the nanoprobe is aligned with the cells of interest along the z axis (i.e., in the same plane of the cells) using bright field microscopic illumination. At this point, the tip is still outside the cell to be probed. Control spectra are acquired with the nanoprobe outside the cell of interest to ensure tip integrity. Usually, if the silver coating on the nanoprobe is adequate, little or no light leaks through the sidewall of the tapered fiber and only a faint glow from laser excitation at the tip can be observed. Following acquisition of control spectra, the nanoprobe is carefully inserted through the cell membrane and extended into the cellular compartment of interest. The laser shutter is opened, and data is recorded over time while the nanoprobe is inside the cell.
3.2 Instrumentation
We have used a slightly modified optical measurement system for interrogating single cells using fluorescence-based nanobioprobes [17–19, 21]. The instrumentation for SERS-based nanobiosensing is similar. Laser excitation light, either with the 325-nm line of a HeCd laser or the 488-nm line of an argon ion laser, is focused onto a 600-μm delivery fiber which is connected to the nanofiber via a SMA connector. The nanofiber is secured to a micromanipulator mounted to the microscope using optical rails. The experimental setup used to probe single cells has been adapted to this purpose from a standard micromanipulation/microinjection apparatus. When performing extended experiments in which temperature and environmental control become critical concerns, we use an incubator to keep the cell cultures at ~ 37 °C on the microscope stage. Our micromanipulation equipment is a MN-2 (Narishige Co., LTD) Narishige three-dimensional manipulator for coarse adjustment, and a Narishige MMW-23 three-dimensional hydraulic micromanipulator for fine movement, but similar instrumentation is likely available from other suppliers. The fiber-optic nanoprobes are mounted on a micropipette holder, and the fluorescence or SERS signal from the cells is collected by the microscope objective and passed through an appropriate longpass filter to eliminate residual laser light. The signal is then focused onto a photomultiplier tube (PMT) or a charge-coupled device (CCD) for detection. A second CCD or digital camera mounted onto another port of the microscope allows collection of white-light images showing nanosensor positioning when interrogating single living cells.
4. Applications
4.1 Monitoring the Effect of Photodynamic Therapy Drugs in Single Mammalian Cells
During the last few years there has been increasing interest in developing nanotools to evaluate the effects of anticancer drugs, such as the onset of apoptosis caused by these drugs in living cells. The cell death process known as apoptosis is executed in a highly organized fashion, indicating the presence of well-defined molecular pathways. Caspase activation is a hallmark of apoptosis, and probably one of the earlier markers that signals the apoptotic cascade [37–39]. Caspases are cysteine proteases which are activated during apoptosis in a self-amplifying cascade. A variety of experimental evidence suggests that caspase activation is essential for the apoptotic process to take place, although not all cell death is dependent upon caspase activation. Caspases have an essential role in the initial signaling events of apoptosis, as well as in the downstream processes which produce the various hallmark signs of apoptosis. Activation of caspases such as caspases 2, 8, 9, and 10 leads to proteolytic activation of “downstream” caspases such as 3, 6, and 7.
Nanobiosensors have been used to monitor the onset of the mitochondrial pathway of apoptosis in a single living cell by detecting enzymatic activity by caspase-9 [24]. Minimally invasive analysis of single live MCF-7 cells for caspase-9 activity was demonstrated using the optical nanobiosensor, which employed a modification of an immunochemical assay format for the immobilization of a non-fluorescent enzyme substrate, Leucine-Glutamic Acid-Histidine-Aspartic Acid-7-amino-4-methyl coumarin (LEHD-AMC). LEHD-AMC covalently attached on the tip of an optical nanobiosensor was cleaved during apoptosis by caspase-9, generating free AMC. An evanescent field excited the cleaved AMC, and the resulting fluorescence signal was detected. By quantitatively monitoring the changes in fluorescence signals, caspase-9 activity within single living MCF-7 cells was detected. Photodynamic therapy (PDT) protocols employing δ-aminolevulinic acid (5-ALA) were used to induce apoptosis in MCF-7 cells. The substrate LEHD-AMC was cleaved by caspase-9, and the released AMC molecules were excited and emitted a fluorescence signal. By comparing the fluorescence from an apoptotic cell and an uninduced control, we detected and identified caspase-9 activity. By comparison of the fluorescence signals from apoptotic cells induced by photodynamic treatment vs. native activity with non-apoptotic cells, we successfully detected caspase-9 activity. Detection of caspase-9 indicates the onset of apoptosis in the cells.
The results show that the fluorescence signals obtained from the cells that were both incubated with ALA and photoactivated by laser excitation were much higher than the signal obtained from control groups, i.e., without laser activation of 5-ALA. The presence and detection of cleaved AMC in single live MCF-7 cells as a result of these experiments reflects the presence of caspase-9 activity and the occurrence of apoptosis. These results indicate that apoptosis can be monitored in vitro using optical nanobiosensors in a single living cell. Further, these results additionally demonstrate the potential to examine the efficacy of potential chemotherapeutic agents on single living cells.
We have further explored events in the mitochondrial pathway of apoptosis and demonstrated the utility of optical nanobiosensors to successfully measure a second apoptosis effector protein, caspase-7. Like caspase-9, caspase-7 is another cysteine protease which is important for the initiation of apoptosis. It is involved in the activation cascade of caspases and in the proteolytic cleavage of Parp protein. Caspase-7 was detected and identified intracellularly using optical nanobiosensors bearing a substrate-molecular probe conjugate. It has substrate specificity for the amino acid sequence Asp-Glu-Val-Asp (DEVD) and cleaves the substrate DEVD–Rhodamine 110 (R110) specifically after the Asp residue. This substrate is nonfluorescent in its intact state, but once cleaved after the Asp residue, it is converted to highly fluorescent R110 (excitation/emission maxima ~496/520 nm). Once cleaved, R110 is excited using 488 nm laser light at the tip of the optical nanobiosensor. The fluorescence signal thus generated is detected and quantified. Caspase-7 is measured by comparing the fluorescence signals generated from an experimental group of cells with activated enzymes, and the control group with inactivated enzymes.
Figure 4 shows the fluorescence of R110 generated via the in vitro cleavage of DEVD-R110 by caspase-7. For this measurement, cells were exposed to the PDT drug and photoactivation (Group I), to the PDT drug without photoactivation (Group II), photoactivation alone (Group III), and to neither the PDT drug nor photoactivation (Group IV). The fluorescence intensity of cleaved R110 was measured as a function of time and plotted. The fluorescence intensity of R110 reveals that the cleaved product, R110, was generated in the cells exposed to both the PDT drug and photoactivation, and not in the treated control or untreated control groups. R110 fluorescence was not detected for cells that received either the PDT drug without photoactivation, photoactivation alone, or neither the PDT drug nor photoactivation. These results show a significant difference in the fluorescence signal detected between the treated and untreated control group of cells and the experimental group. By comparing the fluorescence signals from cells with activated caspase-7 and those without activated caspase-7, we were able to determine in vitro within an individual living cell that ALA activates the mitochondrial apoptotic pathway and that caspase-7 is a protease involved in this cellular pathway. We attribute the detection of R110 molecules to their momentary residence time during the sampling period in the evanescent field at the nanoprobe tip [40]. These averaged results also illustrate the high degree of reproducibility of the optical nanobiosensors.
Figure 4.
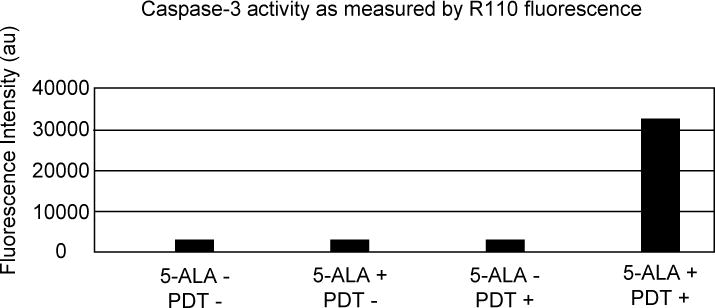
Fluorescence intensity measurements of R110 for the in vivo detection of caspase-7 activity. The experimental group (Group I) of MCF-7 cells received both ALA and photoactivation, the control group received neither ALA nor photoactivation (Group IV); the treated control received photoactivation without ALA (Group II), while the treated control received ALA without photoactivation (Group III). Figure adapted from Reference 40.
The ability to study mammalian cells without disrupting their physiological state circumvents the need for sampling and mechanical manipulation. Mechanical manipulation such as cell lysis can lead to cell disruption prior to the time of sampling and may interfere with measurements of cellular biochemistry. With the optical nanobiosensors, the lack of cell manipulation prior to measurement limits unforeseen effects on the cell at the time of sampling. From our intracellular study results, nanobiosensors proved extremely sensitive for specific biomedically-relevant activities (apoptosis). This high sensitivity is in large part because a single enzyme molecule can catalyze the cleavage of many biomolecules, thereby producing a great quantity of highly-fluorescent R110. This feature, together with excitation and detection in the near-field of the optical nanobiosensor, is important because the two factors facilitate the sensitivity conferred by the operating principle of the nanobiosensor in the sense that only the R110 produced will be excited at the nanotip of the sensor. Another beneficial feature of the nanobiosensor is its selectivity—which is dependent upon the high fidelity by which enzymes function. Just as caspase-9 specifically cleaves the LEHD sequence to produce free AMC for detection in the previous example, the active site of caspase-7 specifically interacts with DEVD-R110 to generate highly-fluorescent R110. Together, these two fluorescent probes illustrate that fluorescence-based fiber-optic nanoprobes can effectively provide biomedically-relevant information from single living mammalian cells.
This work demonstrates the practical application of optical nanobiosensors for molecular recognition at the single cell level using the R110-derived substrate containing caspase-7 recognition site, DEVD-R110. Optical nanobiosensors for investigating intact living cells hold promise not only for minimally invasive dynamic analyses in single living cells, but also for providing a new concept in cell-based assays by offering highly miniaturized, hands-on, nano-scale devices that make cell-based analysis accessible at the single cell level. Future work will involve studies that will attempt to diversify the application of the optical nanobiosensor for multiplexed analysis of protein-protein interactions.
4.2 Monitoring pH in Single Human Cells
Several laboratories have recently demonstrated the potential of surface-enhanced Raman spectroscopy (SERS) for chemically-specific biosensing.[41–58] When applied to cell studies, these techniques are generally applied following cell lysis or rely upon endocytotic / phagocytotic uptake of noble metal nanoparticles functionalized with biochemically-responsive ligands such as the sequence-specific DNA- and RNA-sensing molecular sentinel technology developed in our laboratory.[59] Unfortunately, endocytosis and phagocytosis can shuttle the SERS-active colloids directly into the lysosomal pathway,[60–63] thereby limiting the amount and nature of in vivo biochemical information that can be obtained before the nanoparticles are ejected from the cell. Furthermore, basic cellular uptake and diffusional limitations similar to those which can cause inhomogeneous intracellular distributions of more traditional fluorescent dyes may restrict the regions of the cell for which nanoparticle- or quantum-dot-based methods yield biochemically-useful data. In particular, inhomogeneous intracellular nanoparticle distributions (like inhomogeneous fluorophore distributions) may produce spurious results related to the nanoparticle concentration or nanoparticle aggregation rather than the analyte concentration.
As an alternative to the dye- and nanoparticle-based approaches described above, our laboratory has developed sub-micron SERS-active fiber-optic nanoprobes for real-time intracellular biosensing (Fig. 1).[64] As discussed above, we and others have previously demonstrated the utility of fluorescence-based fiber-optic sensors for intracellular chemical sensing. To the best of our knowledge, however, we have performed the first ever use of a SERS-based fiber-optic nanoprobe for any chemical measurement within a single living mammalian cell.
As in the case of the fluorescence-based nanoprobes discussed above, these SERS-active fiber optic pH nanosensors are fabricated by tapering commercially-available multimode silica optical fibers using a pipette puller, yielding sub-micron fiber tips which are typically ~50 nm in diameter (Fig. 2a). Whereas the fluorescence-based nanoprobes receive a thick, complete metallic coating, the tips of the SERS-active nanoprobes are coated with a 6-nm mass thickness of silver using an electron-beam evaporator, producing a film of nanoscopic silver islands (AgIFs) which greatly enhance the Raman scattering intensity of bound or adsorbed molecules. Functionalization of the AgIF-coated nanoprobes in 10 mM para-mercaptobenzoic acid (pMBA) dissolved in ethanol couples pMBA to the AgIF by a silver-thiol linkage, making the probes pH-sensitive across the physiological pH range. The SERS spectrum of pMBA between 1350 and 1450 cm−1 changes with pH due to the protonation state of the carboxylic acid group (Fig. 5b). Below pH 6, the SERS intensity of the vibrational band centered at ~1405 cm−1 is weak and the band profile is quite broad. Deprotonation above pH 6 increases the SERS intensity in this spectral region (Fig. 5c) and shifts the peak maximum to ~1425 cm−1. As a result, both the location of the SERS band at ~1415 cm−1 and its intensity relative to the vibrational band at ~1587 cm−1 can be used as indicators of intracellular pH. For brevity, we focus on in vitro pH determination using the normalized intensity of the ~1415 cm−1 SERS band of pMBA.
Figure 5.
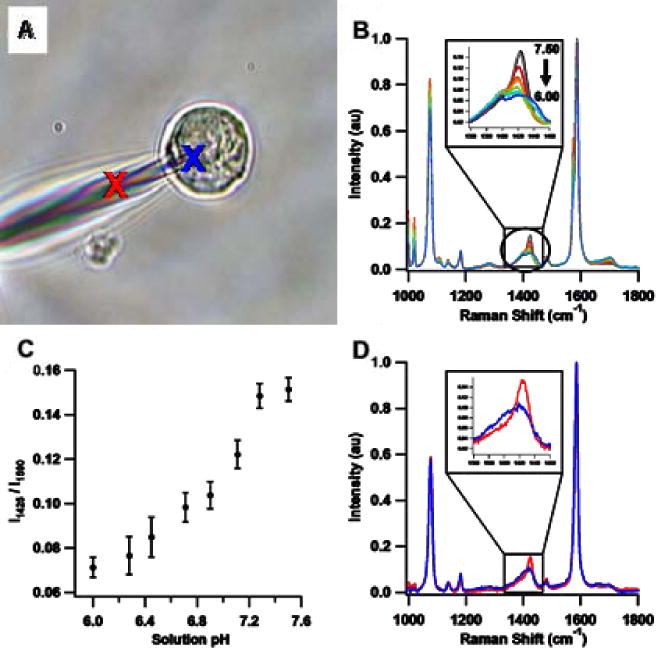
Intracellular pH determination using pMBA-functionalized SERS-active nanoprobes. (A) White-light microscopy image of a SERS-active nanoprobe measuring the intracellular and extracellular pH of a single live MCF-7 human breast cancer cell. (B) Normalized SERS spectra of a pMBA-functionalized SERS nanoprobe in PBS ranging from pH 6.00 to pH 7.50 at ~0.2 pH unit intervals. Each spectrum is the average of ten SERS spectra normalized to the intensity of the ~1590 cm−1 combination band. The inset highlights the pH-dependent changes in the 1350 cm−1 to 1450 cm−1 region of the normalized SERS spectra. (C) pH calibration curve generated using the ratio of normalized SERS intensity at ~1425 cm−1 versus that at ~1590 cm−1. Error bars represent two standard deviations, with 10 spectra per data point. (D) Normalized SERS spectra of the pMBA-functionalized nanoprobe inside (blue spectrum and blue “X” in (A)) and outside (red spectrum and red “X” in (A)) a MCF-7 human breast cancer cell. The signal-to-noise ratio is worse in (D) than in (B) because the SERS spectra shown in (D) are single spectra rather than averaged spectra.
Immediately after functionalization with pMBA, micromanipulators like those used with the fluorescence-based nanoprobes are used to insert the SERS-active, pH-sensitive nanoprobes into cells adhered to fibronectin-coated fused silica microscope slides or embedded in Matrigel™. The interrogation procedure is typically rapid enough that the cells show no major indications of stress (ejection of cytoplasm / loss of membrane integrity, detachment from the microscope slide, etc.), even in the absence of a temperature-controlled sample stage.
Figure 5d shows SERS spectra from the functionalized nanoprobe when inside (blue) and outside (red) a MCF-7 human breast cancer cell in pH 7.3 phosphate buffered saline (PBS). Both spectra are quite similar with the exception of the pH-sensitive region between 1350 and 1450 cm−1, illustrating the overall consistency of the SERS-active pMBA layer and the underlying AgIF. The intensity of the band at ~1415 cm−1 versus that of the peak at ~1587 cm−1 indicates that the pH of the MCF-7 cell shown in Figure 5a is 6.8 +/− 0.1 based on the calibration curve in Figure 5c, which agrees well with literature reports of the average cytoplasmic and nuclear pH of MCF-7 cells.[II]20 The intensity ratio for these same peaks outside the MCF-7 cell indicates that the extracellular pH is 7.3 +/− 0.1, which coincides with the pH of the PBS medium as measured using a digital pH meter and electrode. We have extensively investigated the consistency of the SERS nanoprobe technique by repeating this measurement with more than thirty individual MCF-7 cells and nanoprobes, and have consistently detected more acidic conditions within the intracellular environment than in the extracellular pH 7.3 PBS buffer. Experiments with PC-3 human prostate cancer cells and HMEC-15 “normal” immortalized cells indicate that their pH is somewhat more basic than that of MCF-7 cells, falling near 7.2 – 7.3. Since these SERS-active nanoprobes do not currently use through-fiber excitation, the spatial resolution of the measurement is defined by the diffraction limit of the confocal microscope.
As with existing fluorescence-based nanoprobes, the SERS-based nanoprobe can be used to monitor intracellular conditions during environmental stress, biochemical / biomedical treatment, apoptosis and many other important biological processes—all without directly impacting cellular viability. Unlike existing dye-based and nanoparticle-based techniques, however, the fiber-optic SERS nanoprobe allows simultaneous determination of intracellular and extracellular pH without the fundamental physical limitations imposed by cellular uptake, intracellular diffusion and the lysosomal pathway. In addition, the sub-nanometer spectral width of Raman and SERS peaks has the potential to allow highly multiplexed in vivo, single-cell nanobioanalysis.
5. Conclusions
Fluorescence- and SERS-based fiber-optic nanoprobes have demonstrated potential as means of rapid, minimally-invasive biosensing. In particular, intracellular measurement of carcinogens such as benzo[a]pyrene clearly highlights the utility of fluorescence-based nanoprobe technology for quantitative detection of biochemically-relevant small molecules. Sensing of apoptotic pathway biomarkers including caspase-3 and caspase-7 following PDT treatment of cancer cells explicitly illustrates the potential of fiber-based probes for qualitative and quantitative examination of biochemical processes and pathways in single living cells. While the technology is not yet as mature as that used in the fluorescence-based nanoprobes, SERS-based fiber-optic nanoprobes show similar potential for single-cell biosensing, having already demonstrated the ability to measure pH in a variety of human cell lines in vitro.
6. Expert Opinion
Many laboratories around the world have applied optical spectroscopy in biochemically-specific sensing. Traditionally, these techniques have been applied after lysing hundreds, thousands or millions of cells to acquire enough homogenate to allow sensitive biodetection of intracellular concentrations of DNA, RNA, gene expression products, small molecules, etc. Sadly, such approaches are intrinsically unable to provide any information regarding cell-to-cell variability. Lysing of smaller numbers of cells followed by PCR amplification of DNA or RNA can partially ameliorate this limitation, but few-cell and single-cell PCR is technically very challenging.
Alternatively, cells can be incubated with biochemically-responsive dyes, quantum dots, or nanoparticles. In those cases where endocytosis and phagocytosis do not immediately route nanomaterials directly into the lysosomal pathway, fundamental cellular uptake and transport limitations can cause inhomogeneous intracellular distributions of both traditional fluorescent dyes and nanomaterials. Nanoparticles larger than ~50 nm, for example, have great difficulty entering the nucleus without addition of biochemical functionality, and hydrophobic dyes have a tendency to self-concentrate in hydrophobic microenvironments within the cell. These fundamental physical limitations can further restrict the regions of the cell for which dye-, nanoparticle- or quantum-dot-based methods yield biochemically-useful data. In particular, inhomogeneous intracellular nanoparticle distributions and inhomogeneous fluorophore distributions may produce spurious results related to the dye or nanoparticle concentration (or nanoparticle aggregation, in the case of SERS-based analyses) rather than the analyte concentration.
As an alternative to the dye- and nanoparticle-based approaches described above, our laboratory has developed sub-micron fiber-optic nanoprobes for real-time intracellular biosensing in vitro. As discussed above, we and others have produced fluorescence-based fiber-optic sensors for intracellular chemical sensing, and our laboratory has also produced a number of caspase-specific sensors which have shown great potential when examining the effects of anti-cancer agents. In addition, we have also demonstrated the first ever use of a SERS-based fiber-optic nanoprobe for any chemical measurement within a single living mammalian cell.
These fiber-optic nanoprobes are physically inserted into cells using micromanipulators, so concerns regarding rates of nanoparticle uptake and ejection are entirely avoided. The short time required for nanoprobe insertion, interrogation and subsequent removal from a cell (often less than 30 seconds) also decreases the potential for intracellular digestion of the biochemically-responsive functionality anchored to the fiber tip. The techniques and technology we have utilized during development of these nanoprobes are eminently suitable for integration with additional biochemical sensors. Further, the various proof-of-concept applications during the past two decades highlight the potential to use fiber-optic nanoprobes when performing minimally-invasive bioanalytical measurements in single living human cells.
While fiber-optic nanoprobe technology is not currently well-suited to clinical settings, the next several years will undoubtedly see increased use of fiber-optic nanoprobes in the research arena. Continual increases in the range of biomolecular analytes which can be measured on the single-cell level using both fluorescence- and SERS-based fiber optic nanoprobes will allow quantitative examination of biomolecular pathways, intracellular and intercellular communication, and the fundamental biochemical effects of cell stress. The multiplexing potential of fluorescence-based nanoprobes is somewhat limited by the spectral breadth of fluorescence peaks, but development of SERS-based fiber-optic nanoprobes has already begun to highlight their potential for multiplexed biochemical analysis in single living cells. It is entirely likely that research during the next decade will yield fiber-optic nanoprobes with the ability to simultaneously measure pH, the concentration of multiple small biomolecules, levels of disease biomarkers, and the concentration or presence of specific DNA or RNA sequences. Such tools have the potential to provide an unprecedented level of detail regarding cellular and organismal growth, metabolism, life and death.
Acknowledgments
The authors acknowledge the contributions of G.D. Griffin, J.P. Alarie, B.M. Cullum, and P. Kasili.
Declaration of interest
This research is sponsored by the National Institutes of Health (R01 ES014474-01A1, R01 EB006201).
References
- 1.Vo-Dinh T, Tromberg BJ, Griffin GD, et al. Antibody-based fiberoptics biosensor for the carcinogen Benzo(a)Pyrene. Appl Spectrosc. 1987;41:735–738. [Google Scholar]
- 2.Tromberg BJ, Sepaniak MJ, Alarie JP, et al. Development of antibody-based fiber-optic sensors for detection of a Benzo[a]Pyrene metabolite. Anal Chem. 1988;60:1901–1908. doi: 10.1021/ac00169a012. [DOI] [PubMed] [Google Scholar]
- 3.Alarie JP, Bowyer JR, Sepaniak MJ, et al. Fluorescence monitoring of a Benzo[a]Pyrene metabolite using a regenerable immunochemical-based fiberoptic sensor. Anal Chim Acta. 1990;236:237–244. [Google Scholar]
- 4.Alarie JP, Sepaniak MJ, Vo-Dinh T. Evaluation of antibody immobilization techniques for fiber optic-based fluoroimmunosensing. Anal Chim Acta. 1990;229:169–176. [Google Scholar]
- 5.Alarie JP, Vo-Dinh T. A fiberoptic cyclodextrin-based sensor. Talanta. 1991;38:529–534. doi: 10.1016/0039-9140(91)80176-z. [DOI] [PubMed] [Google Scholar]
- 6.Bowyer JR, Alarie JP, Sepaniak MJ, et al. Construction and evaluation of a regenerable fluoroimmunochemical-based fiber optic biosensor. Analyst. 1991;116:117–122. [Google Scholar]
- 7.Vo-Dinh T, Griffin GD, Sepaniak MJ. In: Fiber optic chemical sensors and biosensors. Wolfbeis OS, editor. Boca Raton: CRC Press; 1991. [Google Scholar]
- 8.Vo-Dinh T, Sepaniak MJ, Griffin GD, et al. Immunosensors: principles and applications. Immunomethods. 1993;3:85–92. [Google Scholar]
- 9.Alarie JP, VoDinh T. Antibody-based submicron biosensor for benzo[a]pyrene DNA adduct. Polycyclic Aromat Compd. 1996;8:45–52. [Google Scholar]
- 10.Betzig E, Chichester RJ. Single molecules observed by near-field scanning optical microscopy. Science. 1993;262:1422–1425. doi: 10.1126/science.262.5138.1422. [DOI] [PubMed] [Google Scholar]
- 11.Pohl DW. In: Advances in Optical and Electron Microscopy. Sheppard CJR, Mulevy T, editors. London: Academic; 1991. [Google Scholar]
- 12.Deckert V, Zeisel D, Zenobi R, et al. Near-field surface enhanced Raman imaging of dye-labeled DNA with 100-nm resolution. Anal Chem. 1998;70:2646–2650. doi: 10.1021/ac971304f. [DOI] [PubMed] [Google Scholar]
- 13.Zeisel D, Deckert V, Zenobi R, et al. Near-field surface-enhanced Raman spectroscopy of dye molecules adsorbed on silver island films. Chem Phys Lett. 1998;283:381–385. [Google Scholar]
- 14.Tan WH, Shi ZY, Kopelman R. Development of submicron chemical fiber optic sensors. Anal Chem. 1992;64:2985–2990. [Google Scholar]
- 15.Tan WH, Shi ZY, Smith S, et al. Submicrometer intracellular chemical optical fiber sensors. Science. 1992;258:778–781. doi: 10.1126/science.1439785. [DOI] [PubMed] [Google Scholar]
- 16.Cullum BM, Griffin GD, Miller GH, et al. Intracellular measurements in mammary carcinoma cells using fiber-optic nanosensors. Anal Biochem. 2000;277:25–32. doi: 10.1006/abio.1999.4341. [DOI] [PubMed] [Google Scholar]
- 17.Cullum BM, Vo-Dinh T. The development of optical nanosensors for biological measurements. Trends Biotechnol. 2000;18:388–393. doi: 10.1016/s0167-7799(00)01477-3. [DOI] [PubMed] [Google Scholar]
- 18.Vo-Dinh T, Alarie JP, Cullum BM, et al. Antibody-based nanoprobe for measurement of a fluorescent analyte in a single cell. Nat Biotechnol. 2000;18:764–767. doi: 10.1038/77337. [DOI] [PubMed] [Google Scholar]
- 19.Vo-Dinh T, Cullum B. Biosensors and biochips: advances in biological and medical diagnostics. Fresenius’ J Anal Chem. 2000;366:540–551. doi: 10.1007/s002160051549. [DOI] [PubMed] [Google Scholar]
- 20.Vo-Dinh T, Griffin GD, Alarie JP, et al. Development of nanosensors and bioprobes. J Nanoparticle Research. 2000;2:17–27. [Google Scholar]
- 21.Vo-Dinh T, Cullum BM, Stokes DL. Nanosensors and biochips: frontiers in biomolecular diagnostics. Sens Actuators, B. 2001;74:2–11. [Google Scholar]
- 22.Kasili PM, Cullum BM, Griffin GD, Vo-Dinh T. Nanosensor for in-vivo measurement of the carcinogen Benzo [a] Pyrene in a single cell. J Nanoscience and Nanotechnology. 2002;6:653–658. doi: 10.1166/153348802321105941. [DOI] [PubMed] [Google Scholar]
- 23.Kasili P, Vo-Dinh T. Detection of polycyclic aromatic compounds in single living cells using optical nanoprobes. Polycyclic Aromatic Compounds. 2004;24:221–235. [Google Scholar]
- 24.Kasili PM, Song JM, Vo-Dinh T. Optical sensor for the detection of caspase-9 activity in a single cell. J Am Chem Soc. 2004;126:2799–2806. doi: 10.1021/ja037388t. [DOI] [PubMed] [Google Scholar]
- 25.Song JM, Kasili PM, Griffin GD, Vo-Dinh T. Detection of cytochrome c in a single cell using an optical nanobiosensor. Analytical Chemistry. 2004;76:2591–2594. doi: 10.1021/ac0352878. [DOI] [PubMed] [Google Scholar]
- 26.Kasili PM, Vo-Dinh T. Optical nanobiosensor for monitoring an apoptotic signaling process in a single living cell following photodynamic therapy. J Nanoscience and Nanotechnology. 2006;5:2057–2062. doi: 10.1166/jnn.2005.426. [DOI] [PubMed] [Google Scholar]
- 27.Vo-Dinh T, Kasili PM. Nanobiosensors for single-cell monitoring. Anal Biochem Chem. 2005;382:918–925. doi: 10.1007/s00216-005-3256-7. [DOI] [PubMed] [Google Scholar]
- 28.Vo-Dinh T, Kasili PM, Wabuyele MB. Nanoprobes and nanobiosensors for monitoring and imaging individual living cells. Nanomedicine. 2006;2:22–30. doi: 10.1016/j.nano.2005.10.012. [DOI] [PubMed] [Google Scholar]
- 29.Vo-Dinh T. Fiberoptics nanosensing at the single cell level. Spectrochimia Acta B. 2008;63:95–103. doi: 10.1016/j.sab.2007.11.027. [DOI] [PMC free article] [PubMed] [Google Scholar]
- 30.Vo-Dinh T. Surface-enhanced Raman spectroscopy using metallic nanostructures. TrAC, Trends Anal Chem. 1998;17:557–582. [Google Scholar]
- 31.Turner DR. 4,469,554. Etch procedure for optical fibers. 1984
- 32.Hoffmann P, Dutoit B, Salathe RP. Comparison of mechanically drawn and protection layer chemically etched optical fiber tips. Ultramicroscopy. 1995;61:165–170. [Google Scholar]
- 33.Lambelet P, Sayah A, Pfeffer M, et al. Chemically etched fiber tips for near-field optical microscopy: a process for smoother tips. Appl Opt. 1998;37:7289–7292. doi: 10.1364/ao.37.007289. [DOI] [PubMed] [Google Scholar]
- 34.Stockle R, Fokas C, Deckert V, et al. High-quality near-field optical probes by tube etching. Appl Phys Lett. 1999;75:160–162. [Google Scholar]
- 35.Holland L. Vacuum deposition of thin films. New York: Wiley; 1956. [Google Scholar]
- 36.Dhawan A, Muth JF, Leonard DN, et al. Focused in beam fabrication of metallic nanostructures on end faces of optical fibers for chemical sensing applications. J Vac Sci Technol, B: Microelectron Nanometer Struct. 2008;26:2168–2173. doi: 10.1116/1.3013329. [DOI] [PMC free article] [PubMed] [Google Scholar]
- 37.Wolf B, Green DR. Suicidal tendencies: apoptotic cell death by caspase family proteinases. J Biol Chem. 1999;274:20049–20052. doi: 10.1074/jbc.274.29.20049. [DOI] [PubMed] [Google Scholar]
- 38.Hengartner MO. Apoptosis: DNA destroyers. Nature. 2001;412:27–29. doi: 10.1038/35083663. [DOI] [PubMed] [Google Scholar]
- 39.Ricci JE, Gottlieb RA, Green DR. Caspase-mediated loss of mitochondrial function and generation of reactive oxygen species during apoptosis. J Cell Biol. 2003;160:65–75. doi: 10.1083/jcb.200208089. [DOI] [PMC free article] [PubMed] [Google Scholar]
- 40.Kasili PM, Vo-Dinh T. Optical nanobiosensor for monitoring an apoptotic signaling process in a single living cell following photodynamic therapy. J Nanoscience Nanotech. 2005;5:2057–2062. doi: 10.1166/jnn.2005.426. [DOI] [PubMed] [Google Scholar]
- 41.Ni J, Lipert RJ, Dawson GB, Porter MD. Immunoassay readout method using extrinsic raman labels adsorbed on immunogold colloids. Anal Chem. 1999;71:4903–4908. doi: 10.1021/ac990616a. [DOI] [PubMed] [Google Scholar]
- 42.Mulvaney SP, Musick MD, Keating CD, Natan MJ. Glass-coated, analyte-tagged nanoparticles: A new tagging system based on detection with surface-enhanced Raman scattering. Langmuir. 2003;19:4784–4790. [Google Scholar]
- 43.Cao YC, Jin R, Mirkin CA. Nanoparticles with Raman Spectroscopic Fingerprints for DNA and RNA Detection. Science. 2002;197:1536–1540. doi: 10.1126/science.297.5586.1536. [DOI] [PubMed] [Google Scholar]
- 44.Cao YC, Jin R, Nam J, Thaxton CS, Mirkin CA. Raman Dye-Labeled Nanoparticle Probes for Proteins. J Am Chem Soc. 2003;125:14676–14677. doi: 10.1021/ja0366235. [DOI] [PubMed] [Google Scholar]
- 45.Isola N, Stokes DL, Vo-Dinh T. Surface-enhanced Raman gene probes for HIV detection Anal Chem. 1998;70:1352–1356. doi: 10.1021/ac970901z. [DOI] [PubMed] [Google Scholar]
- 46.Wabuyele MB, Vo-Dinh T. Detection of HIV type 1 DNA sequence using plasmonics nanoprobes. Anal Chem. 2005;77:7810–7815. doi: 10.1021/ac0514671. [DOI] [PubMed] [Google Scholar]
- 47.Vo-Dinh T, Allain LR, Stokes DL. Cancer gene detection using surface-enhanced Raman scattering (SERS) J Raman Spectrosc. 2002;33:511–516. [Google Scholar]
- 48.Michota A, Bukowska J. Surface-enhanced Raman scattering (SERS) of 4-mercaptobenzoic acid on silver and gold substrates. J Raman Spectrosc. 2003;34:21–25. [Google Scholar]
- 49.Grubisha DS, Lipert RJ, Park HY, Driskell J, Porter MD. Femtomolar detection of prostate-specific antigen: an immunoassay based on surface-enhanced Raman scattering and immunogold labels. Anal Chem. 2003;75:5936–5943. doi: 10.1021/ac034356f. [DOI] [PubMed] [Google Scholar]
- 50.Xu S, Ji X, Xu W, Li X, Wang L, Bai Y, Zhao B, Ozaki Y. Immunoassay using probe-labelling immunogold nanoparticles with silver staining enhancement via surface-enhanced Raman scattering. Analyst. 2004;129:63–68. doi: 10.1039/b313094k. [DOI] [PubMed] [Google Scholar]
- 51.Talley CE, Jusinski L, Hollars CW, Lane SM, Huser T. Intracellular pH Sensors Based on Surface-Enhanced Raman Scattering. Anal Chem. 2004;76:7064–7068. doi: 10.1021/ac049093j. [DOI] [PubMed] [Google Scholar]
- 52.Ji XH, Xu SP, Wang LY, Liu M, Pan K, Yuan H, Ma L, Xu WQ, Li JH, Bai YB, Li TJ. Immunoassay using the probe-labeled Au/Ag core-shell nanoparticles based on surface-enhanced Raman scattering. Colloids Surface A. 2005;257–258:171–175. [Google Scholar]
- 53.Schwartzberg AM, Oshiro TY, Zhang JZ, Huser T, Talley CE. Improving Nanoprobes Using Surface-Enhanced Raman Scattering from 30-nm Hollow Gold Particles. Anal Chem. 2006;78:4732–4736. doi: 10.1021/ac060220g. [DOI] [PubMed] [Google Scholar]
- 54.Niidome T, Yamagata M, Okamoto Y, Akiyama Y, Takahashi H, Kawano T, Katayama Y, Niidome Y. PEG-modified gold nanorods with a stealth character for in vivo applications. J Controlled Release. 2006;114:343–347. doi: 10.1016/j.jconrel.2006.06.017. [DOI] [PubMed] [Google Scholar]
- 55.Kneipp J, Kneipp H, Wittig B, Kneipp K. One- and two-photon excited optical pH probing for cells using surface-enhanced Raman and hyper-Raman nanosensors. Nano Lett. 2007;7:2819–2823. doi: 10.1021/nl071418z. [DOI] [PubMed] [Google Scholar]
- 56.Sun L, Yu C, Irudayaraj J. Surface enhanced raman scattering based nonfluorescent probes for multiplex DNA detection. Anal Chem. 2007;79:3981–3988. doi: 10.1021/ac070078z. [DOI] [PMC free article] [PubMed] [Google Scholar]
- 57.Lee S, Kim S, Choo J, Shin SY, Lee YH, Choi HY, Ha S, Kang K, Oh CH. Biological Imaging of HEK293 Cells Expressing PLCγ1 Using Surface-Enhanced Raman Microscopy. Anal Chem. 2007;79:916–922. doi: 10.1021/ac061246a. [DOI] [PubMed] [Google Scholar]
- 58.Qian X, Peng XH, Ansari DO, Yin-Goen Q, Chen GZ, Shin DM, Yang L, Young AN, Wang MD, Nie S. In vivo tumor targeting and spectroscopic detection with surface-enhanced Raman nanoparticle tags. Nat Biotechnol. 2008;26:83–90. doi: 10.1038/nbt1377. [DOI] [PubMed] [Google Scholar]
- 59.Wang H-S, Vo-Dinh T. Multiplex detection of breast cancer biomarkers using plasmonic molecular sentinel nanoprobes. Nanotechnology. 2009;20:065101. doi: 10.1088/0957-4484/20/6/065101. [DOI] [PMC free article] [PubMed] [Google Scholar]
- 60.Chawla JS, Amiji MM. Cellular Uptake and Concentrations of Tamoxifen Upon Administration in Poly(_-caprolactone) Nanoparticles. AAPS PharmSci. 2003;5 doi: 10.1208/ps050103. Article 3. [DOI] [PMC free article] [PubMed] [Google Scholar]
- 61.Chithrani BD, Ghazani AA, Chan WCW. Determining the size and shape dependence of gold nanoparticle uptake into mammalian cells. Nano Lett. 2006;6:662–668. doi: 10.1021/nl052396o. [DOI] [PubMed] [Google Scholar]
- 62.Becker C, Hodenius M, Blendinger G, Sechi A, Hieronymus T, Muller-Schulte D, Schmitz-Rode T, Zenke M. Uptake of magnetic nanoparticles into cells for cell tracking. J Magnetism and Magnetic Materials. 2007;311:234–237. [Google Scholar]
- 63.Shamsaie A, Jonczyk M, Sturgis J, Robinson JP, Irudayaraj J. Intracellularly grown gold nanoparticles as potential surface-enhanced Raman scattering probes. J Biomed Optics. 2007;12:020502. doi: 10.1117/1.2717549. [DOI] [PubMed] [Google Scholar]
- 64.Scaffidi J, Gregas MK, Seewaldt V, Vo-Dinh T. SERS-based plasmonic nanobiosensing in single living cells. Analytical and Bioanalytical Chemistry. 2009;393:1135–1141. doi: 10.1007/s00216-008-2521-y. [DOI] [PMC free article] [PubMed] [Google Scholar]
- 65.Altan N, Chen Y, Schindler M, Simon SM. Tamoxifen inhibits acidification in cells independent of the estrogen receptor. Proc Natl Acad Sci. 1999;96:4432–4437. doi: 10.1073/pnas.96.8.4432. [DOI] [PMC free article] [PubMed] [Google Scholar]