Abstract
This article provides an overview of the development and application of plasmonic nanoprobes developed in our laboratory for biosensing and bioimaging. We describe the use of plasmonics surface-enhanced Raman scattering (SERS) gene probes for the detection of diseases using DNA hybridization to target biospecies (HIV gene, breast cancer genes etc.). For molecular imaging, we describe a hyperspectral surface-enhanced Raman imaging (HSERI) system that combines imaging capabilities with SERS detection to identify cellular components using Raman dye-labeled silver nanoparticles in cellular systems The detection of specific target DNA sequences associated with breast cancer using “molecular sentinel” nanoprobes and the use of a plasmonic nanosensor to monitor pH in single cells are presented and discussed.
Plasmonic nanosensors and nanoprobes have been developed as sensitive and selective tolls for environmental monitoring, cellular biosensing, medical diagnostics and high throughput screnning.
Keywords: Raman, SERS, plasmonics, hyperspectral surface-enhanced Raman imaging, gene diagnostics, metallic nanoprobes, molecular sentinel, pH nanosensor
1. Introduction
There has recently been great interest in the development and fabrication of plasmonics-active metallic nanostructures for a wide variety of applications. Plasmonics refers to the study of enhanced electromagnetic properties of metallic nanostructures. The term is derived from plasmons, the quanta associated with longitudinal waves propagating in matter through the collective motion of large numbers of electrons. When a metallic nanostructured surface is irradiated by an incident electromagnetic field (e.g., a laser beam), conduction electrons are displaced into frequency oscillations equal to those of the incident light. These oscillating electrons, called “surface plasmons,” produce a secondary electric field, which adds to the incident field. The origin of plasmon resonances of metallic nanoparticles are referred to as localized surface plasmons (LSPs). LSPs can be excited when light is incident on metallic nanoparticles whose size is much smaller than the wavelength of the incident light. At a suitable wavelength, resonant dipolar and multipolar modes can be excited in the nanoparticles, which lead to a significant enhancement in absorbed and scattered light and enhancement of electromagnetic fields inside and near the particles. Hence, the LSPs can be detected as resonance peaks in the absorption or scattering spectra of the metallic nanoparticles. This condition yields intense localized fields which can interact with molecules in contact with or near the metal surface. In an effect analogous to a “lightning rod”, secondary fields can become concentrated at points of high curvature on the nanostructured metal surface. Nanoparticles of noble metals such as gold and silver resonantly scatter and absorb light in the visible and near-infrared spectral region upon excitation of their plasmon oscillations, and are therefore materials of choice for plasmon-related devices. Surface plasmons have been associated with important practical applications in surface plasmon resonance (SPR), surface-enhanced Raman scattering (SERS) and surface-enhanced luminescence (also referred to as metal-enhanced luminescence).
Surface-enhanced Raman scattering (SERS) applications of plasmonic systems developed in our laboratory are discussed in this review. Raman spectroscopy, which yields very narrow spectral vibrational features characteristic of the investigated samples, has long been considered to be a powerful tool for the identification of chemical and biological samples as well as the elucidation of molecular structure, surface processes, and interfacial reactions. Despite these strengths, use of Raman spectroscopy for trace detection is generally limited by the extremely low efficiency of the scattering process. Discovery of the SERS effect in the 1970s [1, 2] indicated that Raman scattering efficiency can be enhanced by factors of up to 106 when the sample is located on or near nano-textured surfaces of plasmonics-active metals such as silver, gold, and transition metals. These discoveries spurred great interest in the research and development of plasmonics-active SERS substrates through the following decade [3–8]. However, this early enthusiasm for SERS decreased from the mid-1970s to the early 1980s due to the irreproducibility of preparing metal nanoparticles in colloidal solution. As a result, the SERS effect found very few practical applications prior to the mid-1980s.
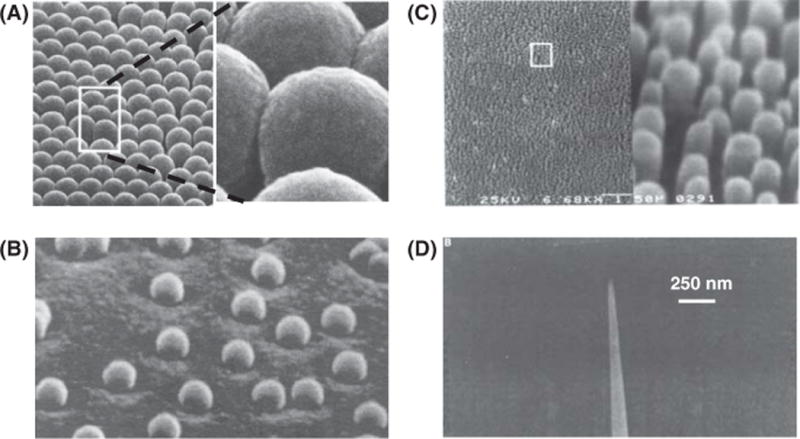
An additional early limitation on development of SERS-based analytical methods is that SERS enhancement of Raman scattering had been observed for only a few highly polarizable small molecules, such as pyridine, benzoic acid and their derivatives. Most studies had involved samples at concentrations between 10−1 and 10−3 M, which are well above the useful concentration ranges for trace analysis. In 1984, we first reported the general applicability of SERS as an analytical technique. This work also demonstrated that the SERS phenomenon is in fact a general effect, and that it can be applied to a wide variety of chemicals including homocyclic and heterocyclic polyaromatic compounds [9]. We developed and proposed the use of solid substrates covered with metal-coated nanostructures as efficient and reproducible SERS-active media. During the following two decades our laboratory has extensively investigated SERS technology in the development of a wide variety of plasmonics-active SERS platforms for chemical sensing [10–16] and for bioanalysis and biosensing [17–26]. These substrates consist of microplates, waveguides or optical fibers having silver-coated dielectric nanoparticles (30 nm diameter) (producing nanocaps or half-nanoshells) [12, 18], and nanorods [10]. The fabrication process involves depositing nanoparticles including polystyrene nanospheres [9, 11–14], titanium dioxide [15], alumina [16], and silica [18] on a solid substrate and then coating the nanoparticle base with a 50–100 nm layer of silver via vacuum thermal deposition. More recently, unique structures such as gold nanostars have been developed as plasmonics-active probes for SERS detection [21]. Figure 1 shows some examples of SERS-active plasmonic platforms that have been developed for SERS applications: Substrates based on nanosphere arrays coated with silver [12]; (B) Nanocaps consisting of isolated nanospheres coated with silver; (C) Nanorod arrays fabricated using submicron lithography and plasma etching [10]; and (D) SERS-inducing fiber optic nanoprobe coated with silver nano-islands [22]. These plasmonics substrate platforms have led to a wide variety of analytical applications including sensitive detection of chemicals with both environmental, toxicological and biochemical significance – including polycyclic aromatic compounds [9,14], organophosphorus compounds [13], and DNA-adduct biomarkers [11]. We reported the first application of SERS in DNA probe technology in 1994 [17], and this early research has led to further development of the SERS method for medical diagnostics [18, 19, 23, 24]. Certain mechanisms related to the SERS effect, such as the contribution of electromagnetic interactions, have been extensively investigated and are reasonably well understood. Moreover, it has been reported that SERS enhancement from the interstitial space (“hot spots”) between two or more nanoparticles can approach 1014 to 1015, and allow single-molecule detection [27–29]. Theoretical calculations indicate that the maximum enhancement factor contributed by electromagnetics from “hot spots” is of the order 1011. Other enhancement processes such as the contribution of chemical effects are likely to induce further enhancement effects [30]. The chain structure consisting of nanoparticles aligned closely with small gaps between them has also been investigated [31, 32]. A semi-analytical method for computing the electric field surrounding a finite linear chain of metal nanospheres and nanospheroids is described [33]. SERS technology is now receiving increased interest and contribution from many research groups [3–8, 34–40].
Figure 1.
Various plasmonics-active platforms
(A) Plasmonics-active substrates based on nanosphere arrays coated with silver (adapted from Ref. [12]).
(B) Nanocaps consisting of isolated nanospheres coated with silver.
(C) Nanorod arrays fabricated using submicron lithography and plasma etching (adapted from Ref. [10]).
(D) SERS-inducing fiber optic nanoprobe coated with silver nano-islands (adapted from Ref. [22]).
This article provides an overview of the development and applications of plasmonics-active nanoprobes and nanostructures in our laboratory. Since there have been a number of comprehensive reviews which have previously discussed a wide variety of SERS methods, no attempt will be made here to present an exhaustive list of all applications of SERS with every possible SERS-active media (e.g., metal colloidal solutions, roughened electrodes). Focus will be given to practical applications in the chemical, environmental and biomedical arenas. Examples of detection techniques and instruments developed in the author’s laboratory are presented to illustrate the usefulness and potential of the plasmonic nanoprobes for gene diagnostics and nanobiosensing. The detection of specific target DNA sequences using SERS gene probes and a novel “molecular sentinel” (MS) nanoprobe are described in detail. Due to the ability to perform simple in vitro bioassays, the SERS-active molecular sentinels are useful diagnostic probes for multiple biological targets. The potential for combining the spectral selectivity and high sensitivity of the SERS process with the inherent molecular specificity of molecular sentinel nanoprobes is discussed in the context of detecting specific DNA or RNA target sequences.
2. Plasmonic substrate development and instrumentation
2.1. Silver-coated “nanocaps”
One early technical difficulty limiting widespread practical application of the SERS technique was the production of surfaces or media that had an easily controlled and reproducible nanostructure size (roughness). An early approach developed in our laboratory involved the use of nanospheres spin-coated on a solid support to produce a controllable substrate with defined roughness on the nanoscale [9, 12, 18]. The spin-coated, nanostructured support is subsequently covered with a layer of silver that covers the top part of the nanospheres, producing a metallic “nanocap” structure which provides the conduction electrons required for the surface plasmon mechanism. Among the techniques based on solid substrates, the methods using simple nanomaterials such as Teflon or latex nanospheres appear to be the simplest to prepare. Teflon and latex nanospheres are commercially available in a wide variety of sizes. The shapes of these materials are very regular and their size can be selected for optimal enhancement. These substrates consist of a plate covered with silver-coated dielectric nanoparticles (Figure 1A) or isolated dielectric nanospheres (30-nm diameter), producing arrays of half-nanoshells or “nanocaps” (Figure 1B).
The effect of the sphere size and metal layer thickness upon the SERS effect can be easily investigated. The results have indicated that for each sphere size, there is an optimum silver layer thickness at which the maximum SERS signal is observed [12]. Silver coated nanospheres/nanocaps were found to be among the most strongly enhancing substrates investigated, with enhancement factors comparable to or greater than those found for electrochemically roughened surfaces.
Preparation of the nanocap substrates involves delivery of a 50 μL volume of a suspension of latex or Teflon nanospheres onto the surface of the planar support. The different types of supports investigated have included filter paper, cellulosic membranes, glass plates, or quartz materials. The support is then placed on a high-speed spinning device and spun at 800 to 2000 rpm for about 20 s. The nanospheres adhere to the support, providing uniform coverage. The silver is then deposited on the nanosphere-coated plate in a vacuum evaporator at a deposition rate of 0.15–0.2 nm/s. The thickness of the silver layer deposited is generally 50 to 100 nm. Figure 1A shows a scanning electron micrograph of a silver-coated substrate having 182 nm radius nanospheres. The expanded window of Figure 1A on the right shows that the sphere surfaces exhibit substructures (i.e., surface protrusions), which might further contribute to the SERS effect. The presence of a random substructure roughness for thick evaporated Ag films over a monolayer of polymer nanospheres was later confirmed in a study using atomic force microscopy. Similarly rough substructures were also observed for thick evaporated Ag films on smooth, insulating substrates.
The morphology of the surface (e.g., density of the nanostructures) can be influenced by varying the concentration of nanospheres in the aqueous suspension solutions prior to spin coating. Figure 2 shows SEM photographs of substrates obtained by spin-coating suspensions with different nanosphere concentrations. Use of low nanoparticle concentration yields an array of isolated nanospheres deposited on the planar substrates.
Figure 2.
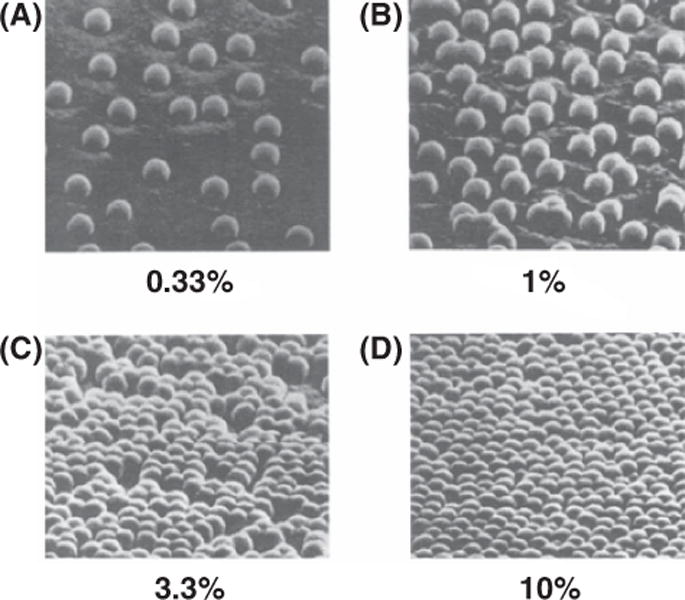
Scanning electron micrographs of substrates obtained by spin-coating suspensions having different nanosphere concentrations: (A) 0.33%, (B) 1%, (C) 3.3%, (D) and 10% (w/w) (adapted from Ref. [18]).
2.2. Silver nanoparticle island films for biomedical diagnostics
Our research has mainly focused on SERS studies using silver substrates, as silver produces stronger SERS enhancement than other materials. The main challenge with any SERS-active substrate is the attainment of reproducible spectra, without which quantitative analysis is difficult. One of the most successful substrates first developed in our group is a glass slide coated with silver-island films. One simple method of fabricating metallic nanostructures over a fairly large area (6–12 inch diameter) is evaporation of a thin metallic film (< 10 nm) on a planar substrate. These thin metallic films form isolated islands on these substrates, and then start to coalesce into a continuous film with increasing thickness of the deposited metal. SERS measurements using silver nanoparticle island films have been described previously [10, 18]. Typically, a 9 nm mass thickness of silver is deposited on a cleaned glass surface prepared by physical vapor deposition (PVD). Prior to deposition, glass slides are soaked in saturated KOH solution in 2-propanol (i-PrOH) overnight. The slides are then rinsed with distilled water several times and air-dried. An electron beam evaporation system (CVE 301 EB, Cooke Vacuum Products, Norwalk, CT) is used for the PVD process. A 1 nm chromium layer is deposited on the glass surface before silver deposition to stabilize the silver layer on the glass surface. The deposition rate and PVD chamber pressure were 0.01 nm s−1 and 10−6 Torr, respectively. Freshly coated silver island surfaces are kept under vacuum prior to further treatment.
For medical diagnostics, especially for DNA hybridization in gene detection, a multiple-step procedure was involved in substrate pretreatment. Typically, Ag surfaces are first immersed in 100 ml of an ethanolic solution containing a mixture of 0.4 μM 1-mercaptoundecanoic acid and 4.0 μM 1-mercapto-undecanol for 30 min. This is followed by extensive washing with degassed EtOH and air-drying. A solution containing O-(N-succinimidyl)-N, N, N′,N′-tetramethyl-uronium tetrafluoroborate (50.8 (μmol), 50 μl of diisopropylethylamine (287 μmol) and 1 ml of acetonitrile (MeCN) is distributed over the clean surfaces prior to overnight storage in an air-tight container. The chemically treated silver surfaces are subsequently washed with MeCN and air-dried. These substrates are then transferred to a petri dish which is vapor-saturated with 8% H2O in methanol (MeOH). A stock solution of the 5′-amino-labeled capture-probe sequence is prepared by dissolving 3.27 mg in 90 μl of H2O and 950 μl of MeOH. Aliquots (15 μl) of this stock solution are applied to the substrates (except for the blank), and immediately exposed to broadband UV radiation for 60 s. The silver substrates are re-hydrated with 8% H2O–MeOH, covered with a microscope cover slide and kept in an airtight container for 6 h. The silver-coated slides are washed with H2O, covered with hybridization solution and placed in an incubator at 37.5 °C for 60 min. The slides are then washed with H2O, air-dried and covered with 185 μl of hybridization buffer and 15 μl of DNA–SERS probe solution. Microscope cover-slips are used to prevent evaporation of the oligonucleotide solution. The silver surfaces are placed in an H2O-MeOH-saturated airtight container, which is placed in a 37.5 °C hybridization oven for 15 h. They are later repeatedly washed with H2O and air-dried. A control for non-specific binding, consisting of modified silver surfaces with self-assembled monolayers (SAMs) of alkanethiols without bound capture oligonucleotides is also used in the experiments. The control is exposed to the DNA-SERS probe solution during hybridization in the same manner as the silver surfaces with immobilized capture oligonucleotides.
2.3. Silver nanoparticles for cellular imaging
The use of nanoparticles for in situ detection of specific reactions as well as intracellular molecular imaging has significant potential for living cells and tissues. SERS appears to be superior to fluorescence in terms of dye labeling of nanoparticles made of gold or silver metals. Recently, we had considerable success in utilizing a novel type of SERS-active silver colloids which can be easily prepared according to a method reported by Leopold and Lendl [41]. Briefly, 10 μL of AgNO3 aqueous solution (10 mM) are added to 90 mL of a hydroxylamine hydrochloride solution (1.67 mM) containing 3.33 mM sodium hydroxide. The procedure yields rather monodisperse silver particles with an average diameter in the range of 23 nm (as examined by the TEM measurements). Other advantages of this approach include ease of substrate preparation at room temperature, and the immediate availability of SERS-active nanoparticles without any subsequent treatment.
The next step involves binding a Raman label to the nanoparticle. Before Raman dye labeling, an aliquot of the above-prepared silver colloids is incubated with mercaptoacetic acid (MAA, ~1.0 mM) for 3 h. Thiol (−SH) groups strongly bind to Ag (and Au) surfaces, thus leaving the carboxylic groups hanging around the silver colloids and allowing the covalent binding of a variety of amine-containing Raman-active dye compounds, as well as many protein-like biomolecules. The MAA-labeled silver colloids can then be separated from solution by centrifugation at 10,000 rpm for ~10 min. The clear supernatant is discarded and the loosely packed nanoparticle pellet is resuspended in 100 μl of 0.1-M 4-morpholinoethane sulfonic acid (MES) buffer, pH 5.0. The colloids are washed four times with MES buffer to remove the excess MAA. Cresyl violet acetate (CV) is chosen as the Raman reporter due to its large SERS enhancement [27]. Typically, the labeling is carried out as follows, 2 μl of 1-mM CV and 100 μl of 1-ethyl-3-(3 dimethylaminopropyl)-carbodiimide (EDC) solution (10 mg dissolved in 1 mL of ultrapure H2O) are added to 100 μl of MAA-labeled silver colloids in MES buffer and allowed to react for 24 h. The reporter-labeled silver colloids are separated from the solution by centrifugation. After four rinses, the nanoparticle pellet is resuspended in 100 μl of sterile ultra-pure water and stored at 4 °C.
Imaging experiments used chinese hamster ovary (CHO) cells, which are a model system in our SERS studies. Cells obtained from the American Type Culture Collection (ATCC, Manassas, VA) are grown in T-25 flasks (Corning, NY) using Ham’s F-12 medium (Invitrogen, Carlsbad, CA) containing 1.5 g/L sodium bicarbonate and 2 mM L-glutamine, and supplemented with 10%, fetal bovine serum (Gibco, Grand Island, NY). The stock cultures are kept in a 5% CO2 cell culture incubator at 37 °C with 95% relative humidity. When cells reach 70–80% confluence, they are sub-cultured at a 1:20 ratio. For experiments, cells are seeded onto glass slides from Nalge Nunc International (Naperville, IL), allowed to anchor, and incubated with 10 μl of CV-labeled silver colloids for 24 h in Ham’s F-12 medium in the CO2 incubator. The cells are washed three times with phosphate-buffered saline (PBS) buffer prior to fixation. The Cl− ions present in the PBS buffer induce aggregation of the silver colloids, which results in clustering. The larger clusters formed by aggregated colloids are believed to be the most efficient sites for Raman enhancement. The cells were fixed with 4% paraformaldehyde for 5 min followed by multiple rinses with 100% cold methanol.
2.4. Molecular sentinels and DNA targets
The Molecular Sentinel (MS) probes and target DNA were synthesized by IDT (Integrated DNA technologies, Coralville, IA) using phosphoramidite chemistry on a commercial nucleic acid synthesizer (model ABI394), then purified by reversed-phase HPLC. All the MS probes were modified with 5-carboxytetra-methylrhodamine, succinimidyl ester (TMR) on the 30 end and a thiol (−SH) group on the 50′ terminus. The MS probes were designed and evaluated with the help of the DNA folding software from the Zucker laboratory. We designed a 42-bp, DNA hairpin incorporating a portion of the Homo sapiens breast cancer 1, early onset (BRCA1) gene (supplementary material). The MS nanoprobe was developed using silver nanoparticles and thiol modified DNA tagged with a Raman label at one end. The nanoparticles were derivatized with DNA probes in glass tubes by incubating 0.5 μM silver colloids with 5 μM thiolated MS in phosphate buffer (NaH2PO4/Na2HPO4, 10 mM, pH 7.0) overnight. The SERS-MS nanoprobes were purified three times by centrifugation at 8,000 rpm for 15 min, resuspended in 10 mM phosphate buffer at pH 7.0, and stored at 4 °C. Hybridization studies were carried out by adding a 5 μl aliquot of 100 μM DNA targets to 40 μl of 0.5 μM SERS-MS nanoprobe suspension in 10 mM phosphate buffer containing 2 mM MgCl2. The hybridization assay was allowed to react for 2–3 hrs at room temperature.
2.5. SERS instrumentation
A variety of Raman instrumentation is used for SERS studies. The detection system we use for medical diagnostics is designed to allow spectral recording of individual spots at the hybridization sites. This detection system is illustrated in Figure 3. In most of our studies, a 632.8 nm helium-neon laser with ~5 mW excitation power is used. Signal collection is performed at 180° with respect to the incident laser beam, which is focused through the backside of the translucent substrate. A Raman holographic filter rejects the Rayleigh scattered radiation. The transmitted Raman signal is focused onto the entrance slit of a spectrograph equipped with a red-enhanced intensified charge-coupled device (ICCD) detector. The accumulation time is typically 60 s per spectrum.
Figure 3.
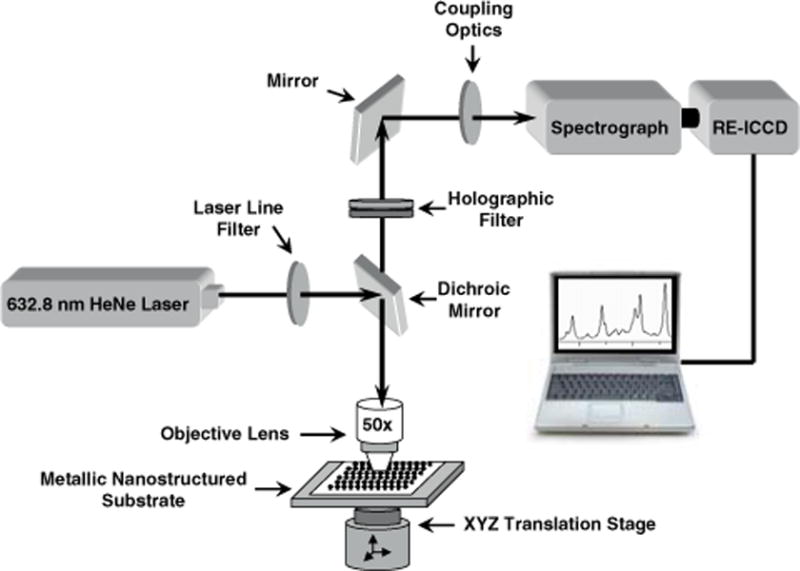
(online color at: www.biophotonics-journal.org) Raman instrumentation system for SERS detection.
The layout of a hyperspectral Raman imaging system is schematically illustrated in Figure 4. The system consists of an inverted microscope coupled with a 632.8 nm helium-neon laser. The light from the laser passes through a set of diverging and collimating lenses (L1), an iris, and a microscope objective (60X, 0.85NA) using a dichroic filter, then focused on a sample mounted onto a translation stage. Back-scattered SERS signals are collected by the same objective, pass through the dichroic mirror and a holographic notch filter (HNF), and are then transmitted into an acousto-optic tunable filter (AOTF). The AOTF projects the diffracted (first-order) light at a different angle than undiffracted (zero-order) light. The AOTF has a spectral operating range from 600–900 nm, covering the relative wavenumber range (from 0 to 4691.7 cm−1 with respect to a 632.8 nm excitation. The spectral resolution of the AOTF is 7.5 cm−1 at 633 nm. The first order beam exiting the AOTF passes through a beamsplitter (BS) (70/30 ratio), then through a second iris before being imaged onto a thermoelectrically cooled intensified charged-coupled device (ICCD) containing a front-illuminated chip with 512 × 512 two-dimensional array of pixels (19 × 19 μm2). The ICCD was computer controlled with WinView software. The refracted beam was focused down onto the active area of an avalanche photodiode (APD). An APD is an ideal detector due to its small size, high quantum efficiency (QE) and large amplification capabilities. The APD used has a QE of ~70% and very low dark count (< 100 c/s) thus reducing noise arising from the use of amplifiers. A TTL pulse of 2.5 volts from the APD is sent to a universal counter where the pulses are counted for a specified acquisition time. The APD detector is controlled by an integrated LabVIEW program developed in-house. The AOTF-based HSERI system also includes an incandescent tungsten light for bright field imaging and a mercury lamp for fluorescence imaging. SERS spectra and images were acquired after focusing the laser beam to an area of interest on cells adhered to glass slides. The images were acquired upon excitation with 15 mW laser power and an accumulation time of 6 s (0.6 s/frame). The SERS spectra were recorded with accumulation times of 25–50 s.
Figure 4.
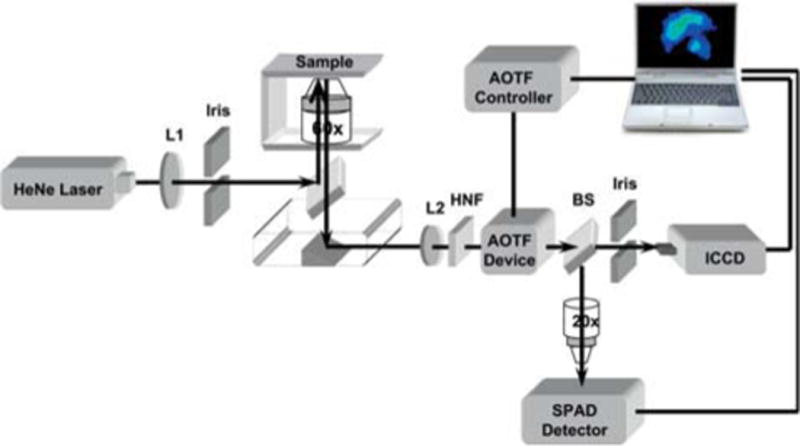
(online color at: www.biophotonics-journal.org) Hyperspectral Raman imaging system.
3. Applications and discussion
3.1. SERS gene probes
There is a strong need for sensitive and selective optical techniques for use in biosensing, biomedical diagnostics, pathogen detection, gene identification, gene mapping, and DNA sequencing. One of the most specific biorecognition processes is the hybridization of a nucleic acid to its complementary target. We have combined this biorecognition process with plasmonics to develop a new generation of DNA-based SERS probes for medical diagnosis. We first reported the development and use of the SERS gene probe technology for DNA detection [17]. The feasibility of using surface-enhanced Raman gene probes which exhibit an extremely narrow spectral band width has been demonstrated. Our laboratory has also pioneered the use of SERS-active labels for primers used in polymerase chain reaction (PCR) amplification of specific target DNA sequences. This method has the potential for combining the spectral selectivity and high sensitivity of the SERS technique with the inherent molecular specificity offered by DNA sequence hybridization. Our laboratory has reported the development of SERS-based gene probes and has reported the selective detection of HIV DNA [19] and the breast cancer gene BRCA1 using SERS-active substrates [23, 42]. We used precoated SERS-active solid substrates functionalized with DNA probes which were directly used for hybridization. The effectiveness of this scheme for DNA hybridization and SERS gene detection involves several considerations. First, it is important that the unlabeled DNA fragment does not exhibit any significant SERS signal that might interfere with the label signal. Second, the label must be SERS-active and compatible with the hybridization platform. An efficient label should exhibit a strong SERS signal when used with the SERS-active substrate of interest. Third, the label should retain its strong SERS signal after being attached to a DNA probe. Finally, the SERS signal from the labeled probe must be visible following hybridization.
The usefulness of the SERS detection scheme has been evaluated in the detection of the gag gene sequence of the human immunodeficiency virus (HIV) [19]. Infection with Type 1 human immunodeficiency virus (HIV1) results in a uniformly fatal disease. Unfortunately, standard HIV serologic tests, including the enzyme-linked immunosorbent assay and the Western blot assay, are not useful in the diagnosis of HIV infection during early infancy because of the confounding presence of transplacentally derived maternal antibody in the infants’ blood. There is, therefore, a need for a direct nucleic acid based test which detects the presence of HIV viral sequences. This can be achieved by PCR amplification of target DNA sequences. Figure 5 illustrates the results of the HIV hybridization experiments [19]. Figure 5A shows the SERS detection of the CFV-labeled target DNA strand that has been hybridized with the surface-bound capture probe. Detection of a single-strand DNA labeled by CFV is shown in Figure 5B. In this case, the sample was simply spotted on an immobilization support that was coated with silver. Figure 5C corresponds to detection of free CFV. There does not appear to be any major alteration in the CFV spectrum as a result of being bound to single-or double-stranded DNA. As a further demonstration of selectivity (Figure 5D), no CFV signals were observed following the hybridization and rinsing steps when no complementarity existed between the capture probe sequence and the single-stranded, CFV-labeled DNA. In this example, the CFV-labeled DNA was the single-stranded forward primer, which lacked any complementarity with the capture probe and was hence removed during the rinsing step. In summary, these results demonstrate the effectiveness of our SERS gene probe technique for biomedical diagnostics. Our results demonstrate the potential of SERS as a practical tool for the identification and differentiation of multiple genes related to medical diseases and infectious pathogens.
Figure 5.
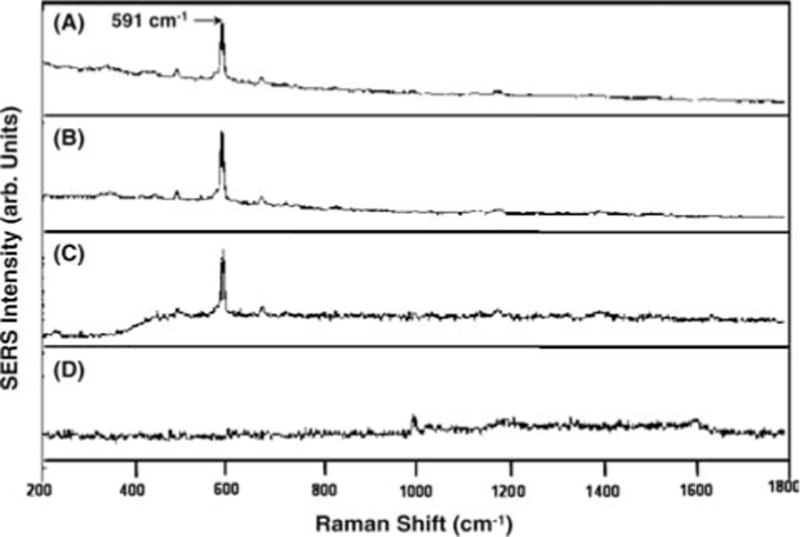
SERS detection of the HIV-1 gene: (A) CV-labeled ssDNA target hybridized to the capture probes on a silver-coated substrate, (B) CV-labeled ssDNA target spotted directly on a silver-coated substrate, (C) Free CV dye, (D) Negative control in the presence of CV-labeled non-complementary ssDNA followed by a rinsing step (adapted from Ref. [19]).
3.2. Hyperspectral imaging of Raman dye-labeled silver nanoparticles in single cells
Plasmonic nanoprobes can be used for biological imaging of cellular systems. Our labeling approach, which is different from other approaches reported in the literature, involves developing labeled nanoparticles that can be covalently coupled to a larger number of label molecules with amine moieties. These labels include Raman-active dyes such as crystal violet (CV), Rhodamine 123 etc, as well as targeting biomolecules such as antibodies and amine-functionalized DNA. We detect intense images due to the SERS signal from the CV-labeled silver nanoparticles at CV’s characteristic peaks (596 cm−1, 1196 cm−1 and 1644 cm−1). The narrow spectral bandpass (< 1 nm) of the CV label is advantageous to high throughput analysis where multiple Raman probes are required (spectral multiplexing). Figure 6 shows an example illustrating the use of hyperspectral imaging of a fixed Chinese hamster ovary (CHO) cell following passive uptake of CV-labeled silver nanoparticles: A bright field image (left), a SERS image (center), and a composite image (right) [25]. Two types of control cells were used in this study: Control-1 cells were not incubated with the CV-labeled particles and Control-2 cells were incubated with the CV-labeled particles for less that 1 hr and rinsed four times with PBS buffer. Neither type of control cells showed any SERS signal under the measuring conditions used. CHO cells were incubated with 10 μl of CV-labeled silver colloids for 24 h in Ham’s F-12 medium in the CO2 incubator. Prior to fixing and imaging, the cells were rinsed three times with PBS buffer to ensure the removal of silver nanoparticles adsorbed to the cells. The images indicate that the SERS signal is inhomogeneously distributed over the cell (Figure 6). This feature is likely because some regions within the cell do not contain the CV-labeled silver clusters. Variation in the SERS signal intensities within the cell may be attributed to two things: 1) differing enhancement due to the clustering of SERS-active nanoparticles; and 2) the heterogeneous distribution of the laser within the field of view. The image in Figure 6 was obtained with an acquisition time of 25 s with the AOTF set to 596 cm−1, which corresponds to CV’s most intense peak.
Figure 6.

(online color at: www.biophotonics-journal.org) Hyperspectral Raman imaging of a CHO cell following passive uptake of CV-labeled silver nanoparticles (adapted from Ref. [25]).
3.3. Plasmonic molecular sentinels
We have developed a novel detection approach that incorporates the “SERS effect modulation” scheme associated with metallic nanoparticles and the DNA hairpin structure [26]. The plasmonics-based “molecular sentinel” (MS) nanoprobe, is composed of a SERS-active metal nanoparticle and a stem-loop DNA molecule tagged with a Raman label (Figure 7A). The nanoprobe utilizes the specificity and selectivity of the DNA hairpin probe sequence to detect a specific target DNA sequence of interest. In the normal configuration and in the absence of target DNA, the stem-loop configuration keeps the Raman label close to the metal nanoparticle, inducing an intense SERS effect that produces a strong Raman signal upon laser excitation. Upon hybridization of a complementary target DNA sequence to the nanoprobe, the stem-loop configuration is disrupted, causing the Raman label to physically separate from the metal nanoparticle, thus quenching the SERS signal.
Figure 7.
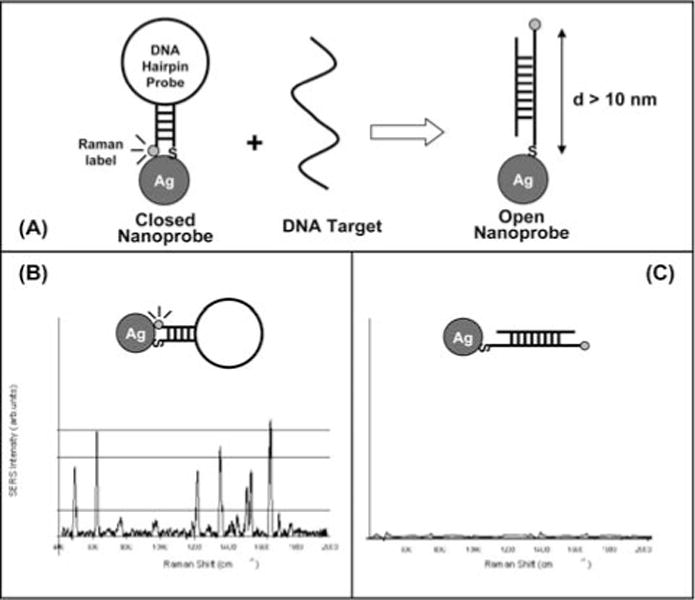
(A) Operating Principe of a SERS Molecular Sentinel nanoprobe; (B) A strong SERS signal is observed when the MS probe is in the hairpin conformation, (closed state); (C) Upon hybridization with the target (open state) the SERS signal is diminished (adapted from Ref. [26]).
The change (or modulation) of the plasmonic effect with the distance between the metallic nanoparticle and the Raman label is the basis of the detection strategy for the MS probes. The plasmonic enhancement is due to electromagnetic effects and chemical effects at the metal surface. Studies of electromagnetic effects have shown that the SERS enhancement, G factor, decreases as G = [r/(r + d)]12 for a single analyte molecule located a distance d from the surface of a metal particle of radius r [27, 28]. The electromagnetic SERS enhancement falls off drastically with increasing distance between the label and the metallic nanoparticle due to the decay in the dipole over the distance (1 / d)3 to the fourth power, thus resulting in a total intensity decay of (1 / d)12. Because the Raman enhancement field decreases significantly away from the surface, a molecule must be located very close (0–10 nm) to the nanoparticle surface in order to experience the enhanced local field. In the absence of target genes, the stem-loop configuration keeps the Raman label in contact or close proximity (<1 nm) to the nanoparticle, thus inducing strong plasmonic enhancement and a strong SERS signal from the label (Figure 7B). However, when complementary target DNA is recognized and captured (i.e., hybridized) by the MS nanoprobes, the SERS signal of the labels is drastically decreased, indicating target recognition and binding (Figure 7C). In other terms, the MS nanoprobes play the role of molecular sentinels patrolling the sample solution with their warning light “switched on” when no significant event occurs. When a target species (e.g., defect genes, specific RNA) is detected, the molecular sentinels will lock to them and extinguish their light.
The SERS MS concept is essentially a label-free technique in the sense that the target molecules do not have to be labeled. The technique is also appropriate for detecting the presence of specific DNA sequences in a homogenous solution at room temperature. The SERS MS nanoprobe has been used to detect the presence of the HIV gene in a homogeneous assay [26]. The HIV molecular sentinel nano-probes that incorporated a partial sequence for a human immunodeficiency, HIV-1 isolate Fbr020 from Thailand reverse transcriptase (pol) gene, were designed with a stem sequence that allowed the formation of stable hairpin structure at room temperature. The HIV-1 MS nanoprobe 5′-HS-(CH2)6)-CCTATCACAACAAAGAGCATACATAGG GATAGGR6G) consisted of a 42-basepair (bp) DNA hairpin probe with a 6-bp stem that was modified with rhodamine 6G on the 3′ end and a thiol substituent at the 5′ end which could then be used for covalent coupling to the surface of silver nanoparticles. The underlined sequence represents the complementary arms of the MS. The silver colloidal nanoparticles were prepared according to the citrate reduction method yielding homogenously sized colloids [43]. The GeneAmplimer HIV-1 control reagents and the GeneAmp® Gold PCR Reagent Kit were used to amplify a 115-bp sequence in the gag region of the HIV-1 genome. The reagent included both positive and negative HIV-1 DNA control templates. The positive control was a plasmid DNA that contains the entire genome of the HIV isolate, while the negative control was a human placenta DNA template that is free from HIV-1 sequence. The forward primer SK 38 (5′-ATAATCCACCTATCCCAGTAGGAGAAAT-3′) and the reverse primer SK 39 (5′-TTTGGTCCTTGTCTTATGTCCAGAATGC-3′) of the gag region (GeneAmplimer HIV-1, Applied Biosystems) were used. PCR amplification was carried out in 50 μL of 100 mM Tris-HCl buffer (pH 8.3) containing 50 mM KCl, 2.5 mM MgCl2, 200 μM dNTPs, 10 ng of purified human genomic DNA, 1.25 units of AmpliTag Gold DNA polymerase, and 0.5 μM each of the forward and reverse primers. Amplification was achieved with an initial denaturation step at 95 °C, for 2 min followed by a 30 cycle process that includes a denaturation step for 15 sec at 95 °C, an annealing and extension step at 60 °C for 60 sec, and a final extension at 72 °C for 2 min. PCR products were stored at −20 °C until required for the hybridization assays. PCR products were analyzed using pre-cast gels stained with ethidium bromide. The hybridization assay using SERS MS nanoprobes was carried out in a 40 μL reaction volume containing 30 μL of 0.5 μM SERS SK 19 MS nanoprobes, and 10 μL of the PCR amplicon. The PCR amplicon and nanoprobe mixture were denatured for 15 sec at 95 °C allowed to hybridize at 55 °C for 1 min. SERS measurements were performed using a Renishaw InVia Raman system equipped with a 50 mW, HeNe laser (Coherent, Model 106-1) emitting a 632.8 nm line used as the excitation source. The light from the laser was passed through a line filter, and focused on a sample mounted to a X-Y-Z translation stage with a 20 X microscope objective. The Raman scattered light was collected by the same objective, through a holographic notch filter to block out Rayleigh scattering. An 1800-groove/mm grating was used to provide a spectral resolution of 1 cm−1. Raman Scatter was detected by a 1024 × 256-pixel RenCam CCD detector. The SERS spectra were acquired with a 10 s integration time and processed with software from Renishaw (WiRE 2.0).
Figure 8 illustrates the detection of a partial sequence of the HIV-1 gene in a homogenous solution using the MS nanoprobes. In the absence of the target DNA (Figure 8, top curve), the hairpin conformation of the SERS MS nanoprobes remains stable, keeping the rhodamine 6G label close to the surface of the silver nanoparticles (nano-enhancers). With this stable stem-loop configuration, a strong SERS signal from rhodamine 6G is detected. On the other hand, in the presence of a complementary HIV-1 target sequence (Figure 8, middle curve) the SERS HIV-1 MS nanoprobes recognize and hybridize the target DNA thus opening the stem loop, causing physical separation of the rhodamine 6G label from the surface of the silver nanoparticles. As a result, the SERS signal is greatly diminished. It is noteworthy that the presence of non-complementary target DNA template (Figure 8, bottom curve) did not significantly affect the SERS signal indicating that the hairpin configuration of the SERS HIV-1 MS nanoprobes was not disrupted. The results of this study demonstrated that the molecular sentinel technology can reliably detect specific biologically-relevant nucleic acid sequences in a homogenous solution. Using the most intense SERS intensity band at 1521 cm−1 as the marker band for rhodamine 6G, we estimated the SERS quenching efficiency to be ~75% upon hybridization of the SER HIV-1 MS nanoprobe to the HIV-1 DNA target. This result demonstrates the specificity and selectivity of SERS MS nanoprobes and their potential application in selective diagnostics.
Figure 8.
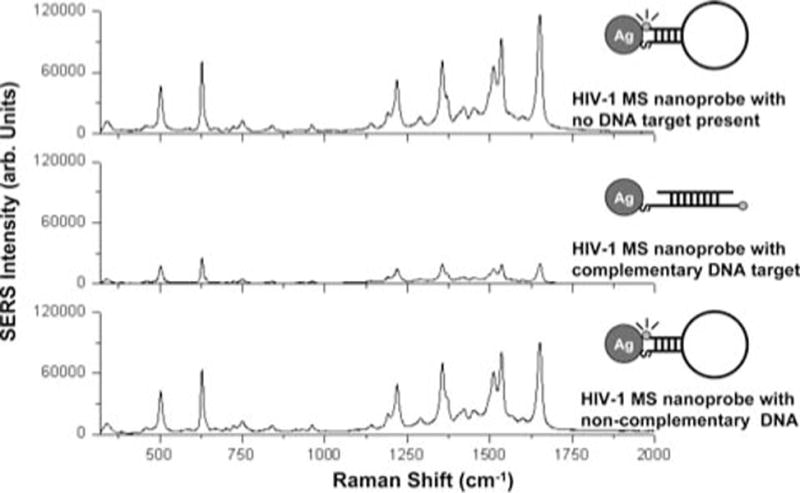
SERS spectra of HIV-1 plasmonic MS nanoprobe with no target DNA sequence (Top curve) and in presence of a non-complementary DNA target sequence (Negative diagnostic: bottom curve) and a complementary HIV-1 DNA target (Positive diagnostic: middle curve) (adapted from Ref. [26]).
We have also demonstrated the feasibility of multiplex DNA detection using the SERS-MS technique in a homogenous solution [44]. The ability to detect multiple genes is critical for many medical applications such as early diagnosis and high-throughput screening. In this study two MS nanoprobes, ERBB2-MS and KI-67-MS, were designed and separately prepared to target breast cancer biomarkers, erbB-2 and ki-67 genes, respectively. The ERBB2-MS (5′-SH-CGCCATCCACCCCCAAGACCACGAC CAGCAGAATATGGCG-Cy3-3′) and KI-67-MS (5′-SHGCGTATTCTGCACACCTCTTGACACTCC GATACGC-TAMRA-3′) nanoprobes were tagged with different Raman labels, Cy3 and 5-carboxytetramethylrhodamine (TAMRA), respectively. The silver nanoparticles with an average diameter of 35 ± 6.3 nm were prepared according to the hydroxylamine hydrochloride reduction method [41]. To demonstrate the multiplexing capability of the MS technique, the ERBB2-MS and KI-67-MS nanoprobes were mixed in 20 mM Tris-HCl buffer (pH 8.0) containing 5 mM MgCl2. The mixture was then allowed to react at room temperature for at least 30 min. Figure 9A shows the resulted SERS spectrum of the MS nanoprobe mixture. Note that all major Raman peaks of the two Raman labels tagged on the ERBB2-MS and KI-67-MS nanoprobes are clearly distinguishable from one another due to the narrow SERS peaks even though the fluorescence spectra of Cy3 and TAMRA strongly overlap. This feature underlines the advantage of the SERS-based MS nanoprobes over fluorescence-based assays for multiplex detection.
Figure 9.
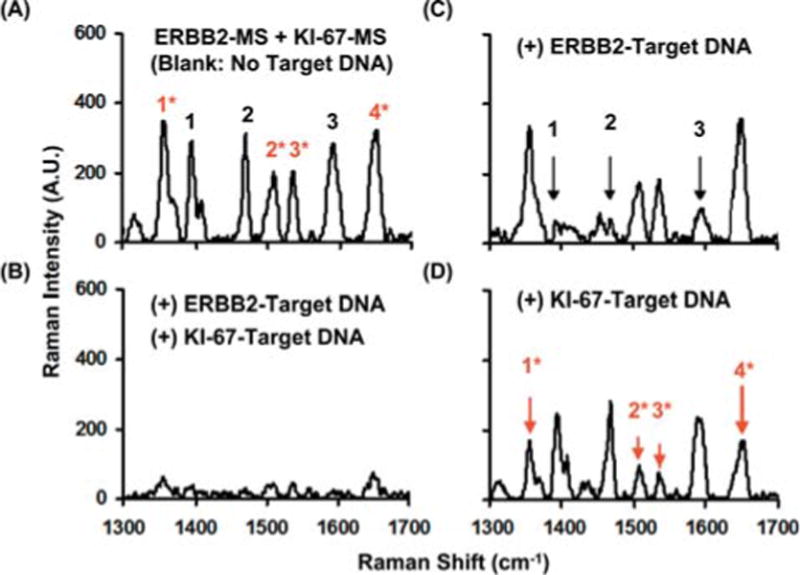
(online color at: www.biophotonics-journal.org) SERS spectra of the MS nanoprobe mixture (ERBB2-MS + KI-67-MS) in the presence or absence of target DNA. The major Raman bands from ERBB2-MS are marked with black numbers, and the major Raman bands from KI-67-MS are marked with red numbers and an asterisk. (A) blank (in the absence of any target DNA). (B) in the presence of two target DNA complementary to both MS nanoprobes. (C) in the presence of target DNA complementary to the ERBB2-MS nanoprobes. (D) in the presence of target DNA complementary to the KI-67-MS nanoprobes. The arrows illustrate the decreased SERS intensity of the major Raman bands in the presence of corresponding target DNA (adapted from Ref. [44]).
Figure 9B shows that all SERS signals of the MS nanoprobe mixture were significantly quenched in the presence of both targets (0.5 mM for each target). The decreased SERS intensity indicates that both MS nanoprobes hybridized with their complementary DNA targets. The specificity and selectivity of the MS nanoprobe mixture were then evaluated in the presence of individual complementary DNA target (i.e. only one of the two complementary targets). The results shown in Figures 9C and 9D indicate that only the SERS signal associated with the MS nanoprobes complementary to the present target was significantly quenched (indicated by arrows). These results demonstrate that the MS nanoprobe technique can provide a useful tool for multiplex DNA detection in a homogeneous solution for medical diagnostics and high-throughput bioassays. In addition, SERS measurements are performed immediately following the hybridization reactions without washing steps, which greatly simplifies the assay procedures. Studies are currently being performed to investigate the quantitative aspects of the MS technique for multiplex DNA detection. Different implementation methods for quantitative DNA detection have been reported by other research groups. For example, Graham and co-workers reported a surface-enhanced resonance Raman scattering (SERRS)-based method to detect dye-labeled DNA absorbed on silver nanoparticles. This approach allows the detection of DNA concentration as low as 0.5 fmol [45, 46]. Mirkin and co-workers reported a sandwich assay that gold nanoparticle probes labeled with oligonucleotides and Raman-active dyes were captured on a chip by targeting to a specific sequence. The captured gold nanoparticles were then coated with silver metals to induce SERS effect. The detection limit of this method was reported as 20 fmol [35].
3.4. Plasmonics-based pH nanosensor for single-cell biosensing
We have developed a plasmonics-active nanoprobe suitable for intracellular measurement of pH in single living human cells using SERS detection [47]. Knowledge of intracellular pH values is essential in cellular studies of protein structure, enzymatic catalaysis, drug delivery and effects of cellular transport and exposure to environmental toxicants. As in previous nanoparticle-based studies of intracellular pH [48, 49], the fiber optic nanoprobe is functionalized with thiolated ligands or labels, thereby imparting the molecular specificity required for intracellular biodetection and bioanalysis. Whereas approaches which rely upon pH-sensitive nanoparticles are frequently subject to concerns regarding the efficacy of nanoparticle uptake, intracellular localization and ejection, fiber-optic nanoprobes entirely avoid these issues because the nanoprobe is physically inserted into cells. The speed of SERS-active nanoprobe insertion, interrogation and subsequent removal from a cell (often less than 30 seconds) also decreases the potential for intracellular digestion of the biochemically-responsive functionality anchored to the nanoparticles used as delivery agents. In addition, the relatively short duration of the nanoprobe insertion/interrogation/removal process greatly reduces the danger of silver nanoprobe degradation within the intracellular environment.
The pH nanosensors were fabricated by tapering 400 μm core-diameter optical fibers (CeramOptec Industries Inc.) using a commercially available pipette puller (P-2000, Sutter Instrument Company), producing nanoprobes smaller than 100 nm in diameter. These tapered optical fibers were then coated with a 6-nm mass thickness of silver at ~10−7 torr atmospheric pressure using an electron beam evaporator (CVE301EB, Cooke Vacuum Products). Following Ag island film (AgIF) deposition, the nanoprobes were functionalized for 15 seconds in 10 mM paramercaptobenzoic acid (pMBA; Sigma) dissolved in ethanol, which anchored pMBA to the AgIF via a silver-thiol covalent bond. The carboxyl group of pMBA is pH sensitive across the physically-relevant range, thereby rendering the nanoprobe pH sensitive across that range as well.
The effectiveness and usefulness of the SERS nanoprobes are illustrated by measurements of pH values in HMEC-15/hTERT immortalized “normal” human mammary epithelial cells and PC-3 human prostate cancer cells. The results indicate that nanoprobe insertion and interrogation provide a sensitive and selective means to monitor cellular microenvironments at the single cell level. Cells were harvested by trypsinization, and trypsinization was halted using 5% MEBM in PBS (for HMEC-15/hTERT cells) or F-12/Kaighn’s medium (for PC-3 cells). The cells were then separated from the trypsinizing solution by centrifugation, resuspended in media, and mixed with growth factor reduced Matrigel™ (BD Biosciences) at a 1:1 ratio. Between 150 and 200 μL of cell suspension were deposited on a fused silica microscope slide (Chemglass) and incubated at 37 °C for 90 seconds to partially gel the suspension. The pH-sensitive nanoprobes were inserted into the cells using micromanipulators, the confocal Raman microscope was focused on the portion of the nanoprobe inserted into the cell, and single ten-second SERS spectra were acquired. SERS-active, pH-sensitive fiber optic nanoprobes can be quickly and easily inserted into single living cells suspended in a supporting matrix or grown on microscope slides.
Insertion of nanoprobes into single cells for SERS interrogation is performed using micromanipulators (Figure 10A). A pH calibration curve can be established using the intensity of the ~1425 cm−1 pMBA carboxylate band relative to the intensity of the ~1587 cm−1 combination band. Error bars represent two standard deviations in the y dimension, and the resolution of the pH meter in the x dimension (Figure 10B). We have used SERS-active fiber optic nanoprobes to measure the intracellular pH of HMEC-15/hTERT immortalized human mammary epithelial cells and PC-3 human prostate cancer cells. The results indicated the pH value of both cell lines is similar to that expected for healthy cells in the absence of significant environmental stress. In addition, we have demonstrated that insertion of the pH-sensitive, SERS-active fiber optic nanoprobe induces neither apoptosis nor an aggressive lysosomal response from either of these cell lines. These results illustrate the utility of the SERS-active pH nanoprobe for intracellular pH measurements, and further demonstrate the potential of biochemically-specific fiberoptic nanoprobes for cellular studies.
Figure 10.
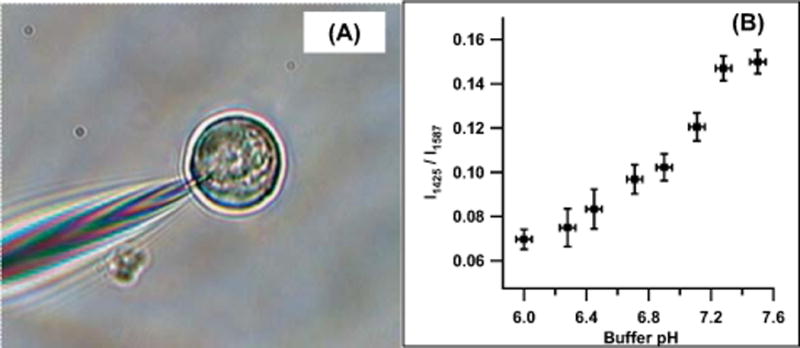
(online color at: www.biophotonics-journal.org) (A) Nanoprobe interrogation and analysis of a single living cell. (B) pH Calibration curve for the pH-sensitive nanoprobe (adapted from Ref. [47]).
4. Conclusion
Plasmonics techniques using SERS detection offer a number of important advantages in biochemical sensing and medical diagnostics. The development of practical and sensitive devices for screening multiple targets associated with medical diseases and infectious pathogens is critical for early diagnosis and improved treatments of many illnesses. To achieve the required level of sensitivity and specificity, it is often necessary to use a detection method that is capable of simultaneously identifying and differentiating a large number of biological constituents in complex samples. This multiplexing capability, which allows the monitoring of a large number of molecular processes and assays simultaneously, is an important feature in systems biology research, medical diagnostics and high throughput screening applications. Due to the well-established strengths of SERS including a lack of photobleaching/photodegradation, the ability to perform multiplexed bioanalysis using a single laser wavelength, and narrow spectral width of Raman bands, the multiplexing capability of Raman and SERS techniques is excellent in comparison to the other spectroscopic alternatives, thus opening new horizons to many applications in medical diagnostics, environmental exposure assessment, drug development and high throughput screening. Improved knowledge of the plasmonics effect and advances in theoretical calculation and simulation studies of the electromagnetic enhancements [33, 50–53] will lead to the design and fabrication of plasmonics-active nanostructures with optimal enhancement properties.
Acknowledgments
The authors acknowledge the contribution of D. L. Stokes, M. Wabuyele, G. D. Griffin, N. Isola, F. Yan, C. Khoury, and M. Gregas. This work was sponsored by the National Institutes of Health (Grants R01 EB006201 and R01 ES014774-01A1).
Biographies

Tuan Vo-Dinh is currently Director of the Fitzpatrick Institute for Photonics (FIP), R. Eugene and Susie E. Goodson Distinguished Professor of Biomedical Engineering, and Professor of Chemistry at Duke University. He received his Ph.D. in Biophysical Chemistry in 1975 from ETH (Swiss Federal Institute of Technology) in Zurich, Switzerland. His research interests focus on the development of advanced technologies for human health protection and environmental sensing. His research activities involve nanobiotechnology, laser spectroscopy, biophotonics, nanophotonics, biosensors, nanosensors, and biochips for medical diagnostics and therapy; molecular imaging and environmental sensing. Dr. Vo-Dinh has authored over 300 publications in peer-reviewed scientific journals and is the author and editor of 7 books, editor-in-Chief of the international journal NanoBiotechnology.

Hsin-Neng Wang received his M.S. degree in bioinformatics at the University of Tennessee and the Oak Ridge National Laboratory in 2003. His MS research focused on the development of Laboratory Information Management System (LIMS). Meanwhile, the progress in biomedical research promoted by advanced techniques greatly inspired him to continue his study in biotechnology and nanotechnology. He is now pursuing his Ph.D. in biomedical engineering at Duke University. Wang’s research focuses mainly on applying biophotonics, molecular spectroscopy and nanotechnology to biosensor development for disease diagnosis and therapeutics.

Jonathan Scaffidi graduated from the University of South Carolina in 2005 with a Ph.D. in analytical chemistry. His primary research interests include development of spectroscopic, electrochemical and mass spectrometric methods, techniques and instrumentation for rapid remote, on-site, in situ and in vivo analysis. He has published 16 papers in the areas of atomic and molecular spectroscopy, stand-off detection and intracellular bioanalysis.
References
- 1.Jeanmaire DL, Van Duyne RP. Surface Raman spectroelectrochemistry. 1. Heterocyclic, aromatic, and aliphatic-amines adsorbed on anodized silver electrode. J Electroanal Chem. 1977;84:1–20. [Google Scholar]
- 2.Albrecht MG, Creighton JA. Anomalously intense Raman-spectra of pyridine at a silver. J Am Chem Soc. 1977;99:5215–5217. [Google Scholar]
- 3.Moskovits M. Surface-enhanced spectroscopy. Rev Mod Phys. 1985;57:783–826. [Google Scholar]
- 4.Wokaun A, Gordon JP, Liao PF. Radiation damping in surface-enhanced Raman-scattering. Phys Rev Lett. 1982;48:957–960. [Google Scholar]
- 5.Schatz GC. Theoretical-studies of surface enhanced Raman-scattering. Acc Chem Res. 1984;17:370–376. [Google Scholar]
- 6.Kerker M. Electromagnetic model for surface-enhanced Raman-scattering (SERS) on metal colloids. Acc Chem Res. 1984;17:271–277. [Google Scholar]
- 7.Chang RK, Furtak TE, editors. Surface-Enhanced Raman Scattering. Plenum Press; New York: 1982. [Google Scholar]
- 8.Pockrand I. Surface-Enhanced Raman Vibrational Studies at Solid/Gas Interfaces. Springer; Berlin: 1984. [Google Scholar]
- 9.Vo-Dinh T, Hiromoto MYK, Begun GM, Moody RL. Surface-enhanced Raman spectrometry for trace organic-analysis. Anal Chem. 1984;56:1667–1670. [Google Scholar]
- 10.Enlow PD, Buncick M, Warmack RJ, Vo-Dinh T. Detection of Nitro-polynuclear Aromatic Compounds by Surface-Enhanced Raman Spectrometry. Anal Chem. 1986;58:1119–1123. [Google Scholar]
- 11.Vo-Dinh T, Uziel M, Morrison A. Surface-enhanced Raman analysis of benzo[a]pyrene-DNA ad-ducts on silver-coated cellulose substrates. Appl Spectrosc. 1987;41:605–610. [Google Scholar]
- 12.Moody RL, Vo-Dinh T, Fletcher WH. Investigation of experimental parameters for surface-enhanced Raman-scattering (SERS) using silver-coated microsphere substrates. Appl Spectrosc. 1987;41:966–970. [Google Scholar]
- 13.Alak AM, Vo-Dinh T. Surface-enhanced Raman spectrometry of organo phosphorus chemical agents. Anal Chem. 1987;59:2149–2153. doi: 10.1021/ac00144a030. [DOI] [PubMed] [Google Scholar]
- 14.Vo-Dinh T, Alak A, Moody RL. Recent advances in surface-enhanced Raman spectrometry for chemical-analysis. Spectrochim Acta B. 1988;415:605–615. [Google Scholar]
- 15.Bello JM, Stokes DL, Vo-Dinh T. Titanium-dioxide based substrate for optical monitors in surface-enhanced Raman-scattering analysis. Anal Chem. 1989;61:1779–1783. [Google Scholar]
- 16.Bello JM, Stokes DL, Vo-Dinh T. Silver-coated alumina as a new medium for surfaced-enhanced Raman-scattering analysis. Appl Spectrosc. 1989;43:1325–1330. [Google Scholar]
- 17.Vo-Dinh T, Houck K, Stokes DL. Surface-enhanced Raman gene probes. Anal Chem. 1994;66:3379–3383. doi: 10.1021/ac00092a014. [DOI] [PubMed] [Google Scholar]
- 18.Vo-Dinh T. Surface-Enhanced Raman Spectroscopy Using Metallic Nanostructures Trends. Anal Chem. 1998;17:557–570. [Google Scholar]
- 19.Isola NR, Stokes DL, Vo-Dinh T. Surface enhanced Raman gene probe for HIV detection. Anal Chem. 1998;70:1352–1356. doi: 10.1021/ac970901z. [DOI] [PubMed] [Google Scholar]
- 20.Zeisel D, Deckert V, Zenobi R, Vo-Dinh T. Near-field surface-enhanced Raman spectroscopy of dye molecules adsorbed on silver island films. Chem Phys Lett. 1998;283:381–385. [Google Scholar]
- 21.Khoury C, Vo-Dinh T. Gold Nanostars for Surface-Enhanced Raman Scattering: Synthesis, Characterization and Applications. J Phys Chem C. 2008;112:18849–18859. doi: 10.1021/jp8054747. [DOI] [PMC free article] [PubMed] [Google Scholar]
- 22.Stokes DL, Chi Z, Vo-Dinh T. SERS-Inducing Nanoprobe for Spectrochemical Analysis. Appl Spectrosc. 2004;58:292–298. doi: 10.1366/000370204322886636. [DOI] [PubMed] [Google Scholar]
- 23.Vo-Dinh T, Allain LR, Stokes DL. Cancer gene detection using surface-enhanced Raman scat-tering (SERS) J Raman Spectrosc. 2002;33:511–516. [Google Scholar]
- 24.Vo-Dinh T, Yan F, Wabuyele M. Surface-enhanced Raman scattering for medical diagnostics and biological imaging. J Raman Spectrosc. 2005;36:640–647. [Google Scholar]
- 25.Wabuyele M, Yan F, Griffin G, Vo-Dinh T. Hy-perspectral surface-enhanced Raman imaging (HSERI) of labeled silver nanoparticles in single cells. Rev Scientif Instrum. 2005;76:063710, 1–7. [Google Scholar]
- 26.Wabuyele M, Vo-Dinh T. Detection of HIV Type 1 DNA sequence Using Plasmonics Nanoprobes. Anal Chem. 2005;77:7810–7815. doi: 10.1021/ac0514671. [DOI] [PubMed] [Google Scholar]
- 27.Kneipp K, Wang Y, Kneipp H, Perelman LT, Itzkan I, Dasari R, Feld MS. Single Molecule Detection Using Surface-Enhanced Raman Scattering (SERS) Phys Rev Lett. 1997;78:1667–1670. [Google Scholar]
- 28.Nie S, Emory SR. Probing single molecules and single nanoparticles by surface-enhanced Raman scattering. Science. 1997;275:1102–1106. doi: 10.1126/science.275.5303.1102. [DOI] [PubMed] [Google Scholar]
- 29.Michaels AM, Jiang J, Brus L. Ag nanocrystal junctions as the site for surface-enhanced Raman scattering of single rhodamine 6G molecules. J Phys Chem B. 2000;104:11965–11971. [Google Scholar]
- 30.Xu H, Aizpurua J, Kaell M, Apell P. Electromagnetic contributions to single-molecule sensitivity in surface-enhanced Raman scattering. Physical Review E. 2000;62:4318–4324. doi: 10.1103/physreve.62.4318. [DOI] [PubMed] [Google Scholar]
- 31.Li K, Stockman MI, Bergman DJ. Self-similar chain of metal nanospheres as an efficient nanolens. Phys Rev Let. 2003;91:227402-1–4. doi: 10.1103/PhysRevLett.91.227402. [DOI] [PubMed] [Google Scholar]
- 32.Stockman MI, Li K, Li X, Bergman DJ. An efficient nanolens: Self-similar chain of metal nanospheres. Proc SPIE. 2004;5512:87–99. doi: 10.1103/PhysRevLett.91.227402. [DOI] [PubMed] [Google Scholar]
- 33.Norton SJ, Vo-Dinh T. Optical response of linear chains of metal nanospheres and nanospheroids. J Opt Soc Amer. 2008;25:2767–2775. doi: 10.1364/josaa.25.002767. [DOI] [PMC free article] [PubMed] [Google Scholar]
- 34.Liu G, Lee LP. Nanowell surface enhanced Raman scattering arrays fabricated by soft-lithography for label-free biomolecular detections in integrated microfluidics. Appl, Phys Lett. 2005;87:074101–074104. [Google Scholar]
- 35.Cao YC, Jin R, Mirkin CA. Nanoparticles with Raman Spectroscopic Fingerprints for DNA and RNA Detection. Science. 2002;297:1536–1541. doi: 10.1126/science.297.5586.1536. [DOI] [PubMed] [Google Scholar]
- 36.Doering WE, Nie SM. Single-molecule and single-nanoparticle SERS: Examining the roles of surface active sites and chemical enhancement. J Phys Chem B. 2002;106:311–317. [Google Scholar]
- 37.Jackson JB, Westcott SL, Hirsch LR, West JL, Halas NJ. Controlling the surface enhanced Raman effect via the nanoshell geometry. Appl Phys Lett. 2003;82:257–259. [Google Scholar]
- 38.Faulds K, Smith WE, Graham D. DNA detection by surface enhanced resonance Raman scattering (SERRS) Analyst. 2005;130:1125–1131. doi: 10.1039/b500248f. [DOI] [PubMed] [Google Scholar]
- 39.Otto A, Mrozek I, Grabhorn H, Akermann W. Surface-enhanced Raman-scattering. J Phys Condens Matter. 1992;4:1143–1212. [Google Scholar]
- 40.Kneipp K, Moskovits M, Kneipp H, editors. Surface-enhanced Raman Scattering: Physics and Applications. Springer; NY: 2006. [Google Scholar]
- 41.Leopold N, Lendl B. A new method for fast preparation of highly surface-enhanced Raman scattering (SERS) active silver colloids at room temperature by reduction of silver nitrate with hydroxylamine hydrochloride. J Phys Chem B. 2003;107:5723–5727. [Google Scholar]
- 42.Allain LR, Vo-Dinh T. Surface-enhanced Raman scattering detection of the breast cancer susceptibility gene BRCA1 using a silver-coated microarray platform. Anal Chim Acta. 2002;469:149–154. [Google Scholar]
- 43.Lee PC, Meisel D. Adsorption and Surface-enhanced Raman of Dyes on Silver and Gold Sols. J Phys Chem. 1982;86:3391–3395. [Google Scholar]
- 44.Wang HN, Vo-Dinh T. Multiplex detection of breast cancer biomarkers using plasmonic molecular sentinel nanoprobes. Nanotechnology. 2009;20:065101. doi: 10.1088/0957-4484/20/6/065101. [DOI] [PMC free article] [PubMed] [Google Scholar]
- 45.Graham D, Smith WE, Linacre AMT, Munro CH, Watson ND, White PC. Selective detection of deoxyribonucleic acid at ultralow concentrations by SERRS. Analytical Chemistry. 1997;69:4703–4707. [Google Scholar]
- 46.Faulds K, Smith WE, Graham D. Evaluation of surface-enhanced resonance Raman scattering for quantitative DNA analysis. Analytical Chemistry. 2004;76:412–417. doi: 10.1021/ac035060c. [DOI] [PubMed] [Google Scholar]
- 47.Scaffidi JP, Gregas MK, Seewaldt V, Vo-Dinh T. SERS-based plasmonic nanobiosensing in single living cells. Anal and Bioanal Chemistry. 2009;393:1135–1141. doi: 10.1007/s00216-008-2521-y. [DOI] [PMC free article] [PubMed] [Google Scholar]
- 48.Talley CE, Jusinski L, Hollars CW, Lane SM, Huser T. Intracellular pH Sensors Based on Surface-Enhanced Raman Scattering. Analytical Chemistry. 2004;76:7064–7068. doi: 10.1021/ac049093j. [DOI] [PubMed] [Google Scholar]
- 49.Kneipp J, Kneipp H, Wittig B, Kneipp K. One and two photon excited optical pH probing in single cells using surface enhanced Raman and hyper Raman nanosensors. Nano Letters. 2007;7:2819–2823. doi: 10.1021/nl071418z. [DOI] [PubMed] [Google Scholar]
- 50.Moskovits M. Surface-enhanced spectroscopy: a brief retrospective. J Raman Spectrosc. 2005;36:485–496. [Google Scholar]
- 51.Norton SJ, Vo-Dinh T. Plasmonic Resonances of Nanoshells of Spheroidal Shape. IEEE Trans Nanotechnology. 2007;6:627–638. doi: 10.1109/TNANO.2007.909074. [DOI] [PMC free article] [PubMed] [Google Scholar]
- 52.Norton SJ, Vo-Dinh T. Spectral bounds on plasmon resonances for Ag and Au prolate and oblate nanospheroids. J Nanophotonics. 2008;2:029501. doi: 10.1117/1.3001731. [DOI] [PMC free article] [PubMed] [Google Scholar]
- 53.Dhawan A, Gerhold MD, Vo-Dinh T. Theoretical Simulation and Focused Ion Beam Fabrication of Gold Nanostructures for Surface-Enhanced Raman Scattering (SERS) NanoBiotechnology. doi: 10.1007/s12030-008-9017-x. in press. [DOI] [PMC free article] [PubMed] [Google Scholar]


