Abstract
This article presents an overview of the development, operation, and applications of optical nanobiosensors for use in in vivo detection of biotargets in individual living cells. The nanobiosensors are equipped with immobilized bioreceptor probes (e.g., antibodies, enzyme substrate) selective to specific molecular targets. Laser excitation is transmitted into the fiber producing an evanescent field at the tip of the fiber in order to excite target molecules bound to the bioreceptors immobilized at the fiber tips. A photometric system detects the optical signal (e.g., fluorescence) originated from the analyte molecules or from the analyte–bioreceptor reaction. Examples of detection of biospecies and molecular signaling pathways of apoptosis in a living cell are discussed to illustrate the potential of the nanobiosensor technology for single cell analysis.
Keywords: Nanobiosensor, Biosensor, Single cell, Benzopyrene tetrol, Apoptosis
1. Introduction
Direct detection of biotargets and cellular signaling pathways inside a single living cell is important since it provides new information that is not available from population-averaged cellular measurements. The study of individual living cells leads also to the understanding of the exact pathways by which signaling pathways move through the architecture of the cell. Advances in nanotechnology and photonics have recently led to a new generation of nanotool sets capable of probing the cell machinery, elucidating intimate life processes occurring at the molecular level, which were heretofore invisible to human inquiry [1]. These nanotools could provide new information that could greatly improve our understanding of cellular function, thereby revolutionizing cell biology. A unique class of devices involves fiber-optic sensors that can be fabricated to have extremely small sizes, making them suitable for monitoring intracellular physiological and biological parameters in microenvironments. Since we first report the development of fluoroimmunosensor (FIS) for the carcinogen benzo[a]pyrene [2], antibodies have become one of the more common classes of bioreceptor molecules used for fiber-optic biosensors in our laboratory [3–9]. The development of submicron fibers used in near-field optics [10,11] has led to the application of tapered fibers with submicron tip diameters between 20 and 500 nm for near-field scanning optical microscopy (NSOM). NSOM was used to achieve sub-wavelength 100-nm spatial resolution in Raman detection [12,13]. Over the years, new techniques in biosensing have set the stage for great advances in the field of biological research. One of the most recent advances in the field of biosensors has been the development of optical nanobiosensors. Recent advances in nanotechnology leading to the development of optical fibers with submicron-sized dimensions have opened new horizons for intracellular measurements. The application of submicron fiber-optic chemical probes has been developed by Kopelman and coworkers, who have developed chemical nanoprobes for monitoring pH and nitric oxide [14,15]. Our laboratory has developed nanobiosensors, which have antibody probes [16–20] and enzyme substrate-based probes [21,22] to detect biochemical targets and proteins inside living single cells. This article describes the development, operating principle of optical nanobiosensors and their biomedical applications.
2. Principle of nanobiosensors
2.1. Near-field optical sensing
Optical fibers having nanosized tips were originally developed for use in near-field optical microscopy, a technique involving light sources or detectors that are smaller than the wavelength of light [10]. Near-field microscopy has received great interest due to its extremely high spatial resolution. The development of one such probe capable of optical measurements with a sub-wavelength spatial resolution of 12 nm was reported [11]. The probe was constructed by using a micropipette puller to pull a single-mode optical fiber to a tip diameter of 20 nm and then coating the walls of the fiber with 100 nm of aluminum to confine the excitation radiation to the tip. With this nanoprobe, images of a pattern were reconstructed from a raster scan performed in the illumination mode, with the probe acting as a localized light source. The combination of near-field excitation and surface-enhanced Raman spectroscopy (SERS) has been used for the measurement of single dye and dye-labeled DNA molecules with a resolution of 100 nm [12,13]. In this work, DNA strands labeled with the dye brilliant cresyl blue (BCB) were spotted onto a SERS-active substrate that was prepared by evaporation of silver on a nanoparticle-coated substrate. The silver-coated nanostructured substrates are capable of inducing the plasmonic effect, which can enhance the Raman signal of the adsorbate molecules up to 108 times [23].
2.2. Biosensor system
The two basic operating elements of a biosensor are: (1) “biological recognition” and (2) “sensing”. Therefore, a biosensor can be generally defined as a device that consists of two fundamental components connected in series: (1) a biological recognition system, often called a bioreceptor, and (2) a transducer. The operating principle of a biosensor is to detect this molecular recognition and to transform it into another type of signal using a transducer (detector). The interaction of the analyte with the bioreceptor is designed to produce an effect measured by the transducer, which converts the information into a measurable effect, such as an electrical signal. A bioreceptor is a biological molecular species (e.g., an antibody, an enzyme, a protein, or a nucleic acid) or a living biological system (e.g., cells, tissue, or whole organisms) that utilizes a biochemical mechanism for recognition. The main purpose of the recognition system is to provide the sensor with a high degree of selectivity for the analyte to be measured.
Signal transduction can be accomplished through a large variety of methods. Most forms of transduction can be categorized in one of three main classes: (1) optical detection methods, (2) electrochemical detection methods and (3) mass-based detection methods. Other detection methods include amperometric, voltaic and magnetic methods. New types of transducers are constantly being developed for use in biosensors. Each of these three main classes contains many different subclasses, creating a large number of possible transduction methods or combinations of methods. Optical transduction in nanobiosensors is the focus of this article. Recent advances in nanotechnology leading to the development of optical fibers with submicron-sized dimensions have opened new horizons for intracellular measurements. The nanosensors function on the same basic principles as more conventional optical biosensors, except for the excitation process. Because the diameter of the fiber's nanotip (30–50 nm) is ten fold smaller than the wavelength of excitation light (300–500 nm), the photons cannot escape from the tip of the fiber to be absorbed by the species of interest, as is the case of conventional optics in larger fiber-optic sensors. Instead, in a fiber-optic nanosensor, after the photons have traveled as far down the fiber as possible, only evanescent fields continue to travel a very short distance through the remainder of the tip (the evanescent field), providing excitation for only the fluorescent species of interest adjacent to the biosensing layer. Therefore, only species that are in extremely close proximity to the fiber's nanoprobe (i.e., target species bound to the bioreceptors immobilized at the fiber tips) can be excited, thereby precluding the excitation of interfering fluorescent species within other locations of the sample. Thus any signal collected originates from molecular species extremely close to the fiber (within the 100-nm near-field environment). This feature unique to nanosensors significantly minimizes interfering background and allows for an unprecedented level of sensitivity and localization.
2.3. Bioreceptors
Bioreceptors are used to bind target analytes to the sensor probe. Therefore, the type of bioreceptor molecules used is a key element determining the specificity of biosensors. Bioreceptors can be generally classified into five different major categories: (1) antibodies, (2) enzymes, (3) nucleic acids/DNA, (4) cellular structures/cells, and (5) biomimetic. Antigen–antibody (Ag–Ab) binding reaction, which is a key mechanism by which the immune system detects and eliminates foreign matter, provides the basis for specificity of immunoassays. The wide variety of potential applications of immunosensors is due, at least in part, to the diversity of antibody molecules. Antibodies, which are complex biomolecules consisting of hundreds of individual amino acids arranged in a highly ordered sequence, are produced by immune system cells when such cells are exposed to substances or molecules, which are called antigens. The way in which an antigen and an antigen-specific antibody interact is analogous to a lock and key fit, in which specific configurations of a unique key enable it to open a lock. In the same way, an antigen-specific antibody fits its unique antigen in a highly specific manner, so that the three-dimensional structures of antigen and antibody molecules are complementary. Due to this three-dimensional shape fitting, and the diversity inherent in individual antibody make-up, it is possible to find an antibody that can recognize and bind to any one of a large variety of molecular shapes. This unique property of antibodies is the key to their usefulness in immunosensors; this ability to recognize molecular structures allows one to develop antibodies that bind specifically to chemicals, biomolecules, microorganism components, etc. One can then use such antibodies as specific probes to recognize and bind to an analyte of interest that is present, even in extremely small amounts, within a large number of other chemical substances. Since the first development of a remote fiber-optic immunosensor for in situ detection of the chemical carcinogen benzo[a]pyrene [2], antibodies have become common bioreceptors used in biosensors today.
3. Experimental methods and instrumentation
3.1. Fabrication of fiber-optic nanoprobes
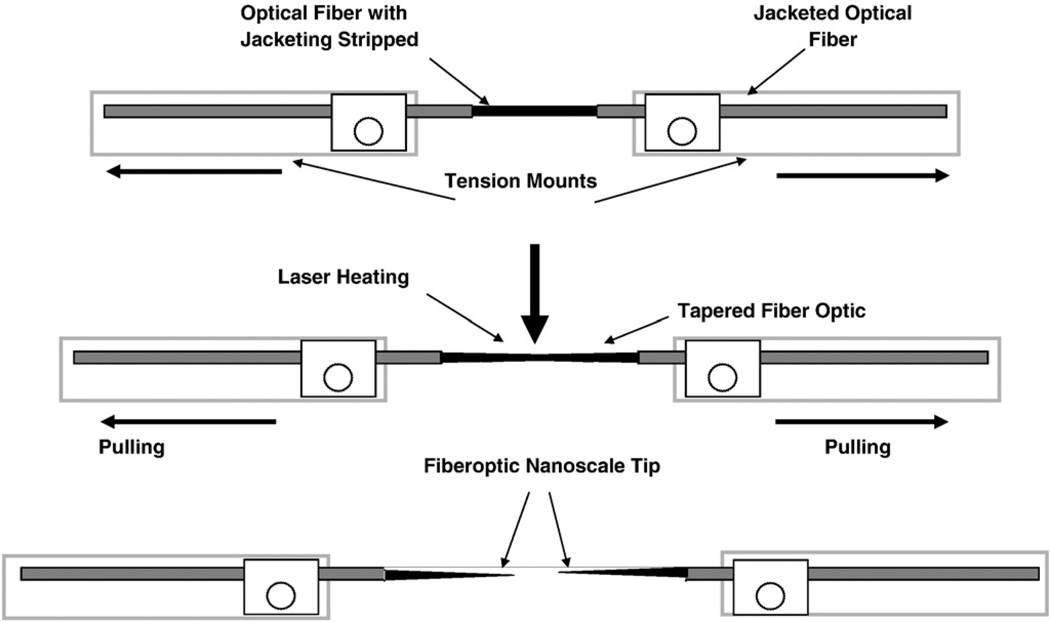
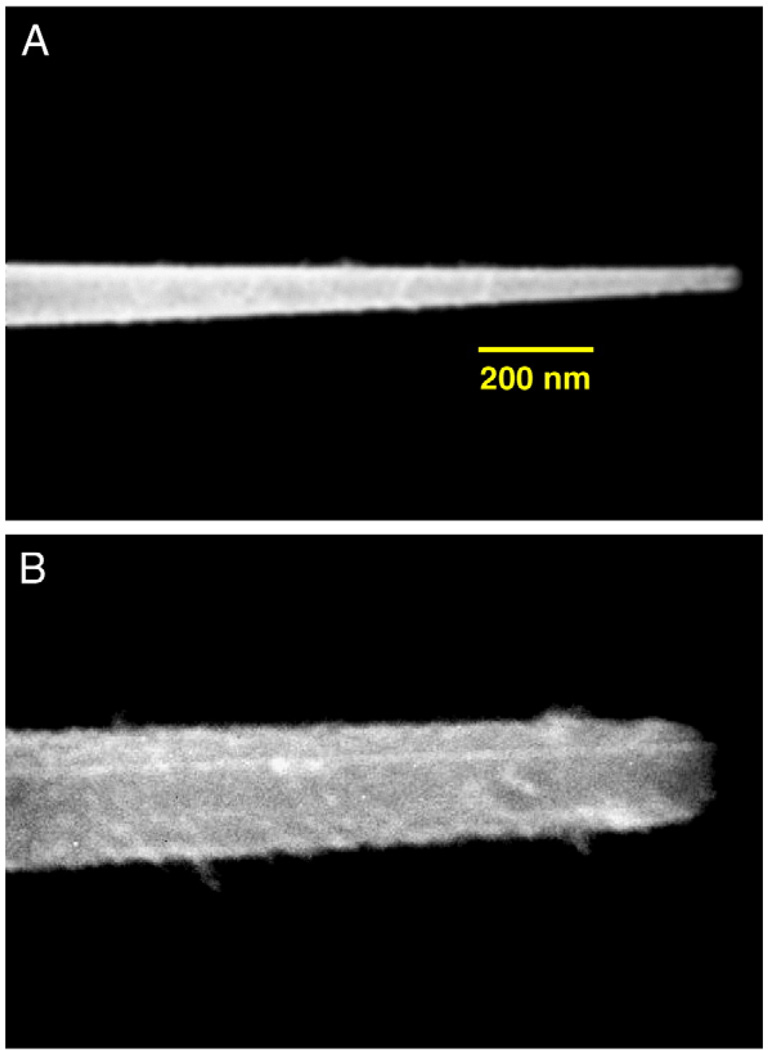
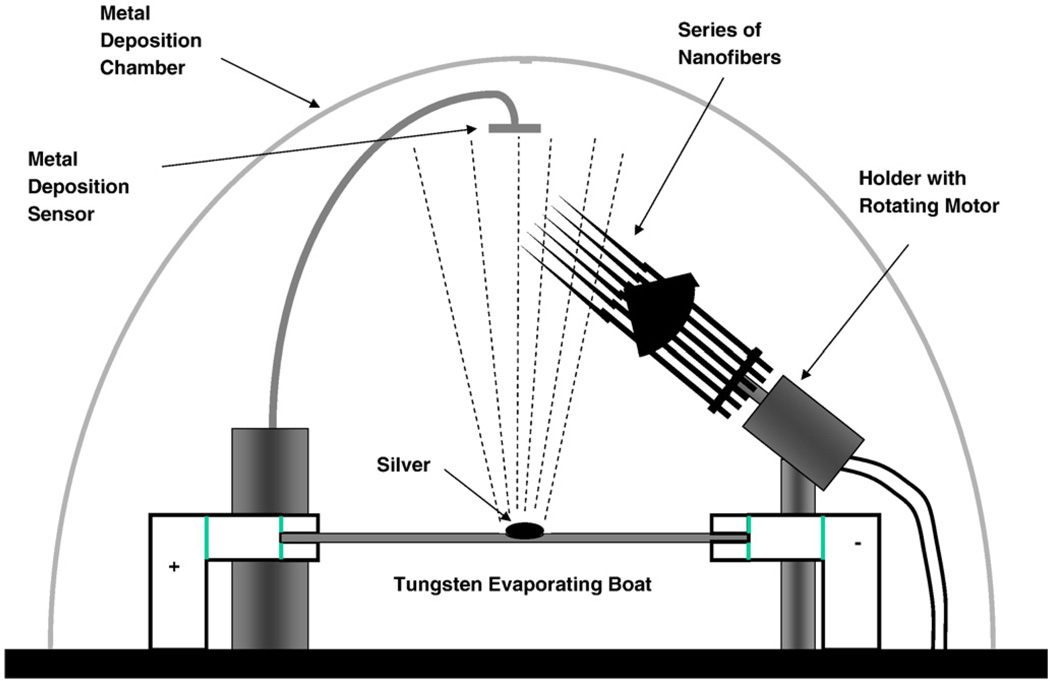
The experimental procedures for the fabrication of nanofibers using the heat and pull procedure is schematically shown in Fig. 1. Another method for fabricating optical nanofibers involves chemical etching using HF. Nanotips fabricated using etching procedures, which can be designed to have sharp tips, have been used in previous NSOM studies to detect SERS-labeled DNA molecules on solid substrates at the sub-wavelength spatial resolution [12,13]. In this nanosensor study we used the heat and pull procedure, which consists of pulling a larger silica optical fiber to produce the tapered nanotip fiber using a special fiberpulling device (Sutter Instruments P-2000). Thismethod involves local heating of a glass fiber using a laser or a filament and subsequently pulling the fiber apart. The shape of the nanofiber tips obtained depends on experimental parameters such as the temperature and the timing of the procedure. Under precisely controlled experimental conditions, thismethod yields fibers with well-defined submicron diameters. One end of a 600-µm silica/silica fiber is polished to a 0.3-µm finish with an Ultratec fiber polisher. The other end of the optical fiber is then pulled to a submicron length using a fiber puller. A scanning election microscopy (SEM) photograph of one of the fiber probes fabricated for studies is shown in Fig. 2A. The distal end of the nanofiber is approximately 30 nm. To prevent light leakage of the excitation light on the tapered side of the fiber, the sidewall of the tapered end is then coated with a thin layer of metal, such as silver, aluminum or gold (100-nm thickness) using a thermal evaporation metal coating device. The coating procedure is schematically illustrated in Fig. 3. The metal coating is only for the sidewall and leaves the distal end of the fiber free for subsequent binding with bioreceptors. The fiber probe is attached on a rotating plate inside a thermal evaporation chamber [16]. The fiber axis and the evaporation direction formed an angle of approximately 45°. During the probe rotation, the metal is allowed to evaporate onto the tapered side of the fiber tip to form a thin coating. The tapered end is coated with 50–100 nm of silver in a Cooke Vacuum Evaporator system using a thermal source at 10−6 Torr. Since the fiber tip is pointed away from the metal source, it remains free from any metal coating and is ready for subsequent binding with bioreceptor molecules. With the metal coating, the size of the probe tip is approximately 150–250 nm (Fig. 2B).
Fig. 1.
Fabrication of nanofibers using the “heat and pull” technique.
Fig. 2.
(A) Scanning electron micrograph (SEM) of an uncoated nanoprobe. The size of the fiber tip diameter is approximately 40 nm. (B) Scanning electron micrograph (SEM) of a fiber-optic nanosensor having the sidewall coated with silver.
Fig. 3.
Metal coating system over rotating fiber tips.
3.2. Immobilization of bioreceptors onto fiber-optic nanoprobes
The next step in the preparation of the nanobiosensor probes involves covalent immobilization of bioreceptor molecules onto the fiber tip. For antibody binding, several strategies can be used to retain the antibody at the sensing probe. Care should be taken in selection of the binding procedures such that the antibody molecules retain their antigen binding activity as much as possible. Perhaps the simplest procedure involves enclosure of the antibody in a solution contained in a microcavity, within a semi-permeable membrane cap, which fits over the end of the sensor. However, this design is relatively complicated and would increase the size of the tip of nanosensors. In this work preparation of the nanobiosensor probes involves covalent immobilization of receptors directly onto the distal end of the fiber tip. Antibodies can be immobilized onto the nanofiber probes by using a chemical immobilization method. The fiber is derivatized in 10% GOPS in H2O (v/v) at 90 °C for 3 h. The pH of the mixture is maintained below 3 with concentrated HCl (1M). After derivatization, the fiber is washed in ethanol and dried overnight in a vacuum oven at 105 °C. The fiber is then coated with silver as described previously. The derivatized fiber is activated in a solution of 100 mg/mL 1,1′ carbonyldiimidazole (CDI) in acetonitrile for 20 min followed by rinsing with acetonitrile and then phosphate buffered saline (PBS). The fiber tip is then incubated in a 1.2-mg/mL antibody solution (PBS solvent) for 4 days at 4 °C and then stored overnight in PBS to hydrolyze any unreacted sites. The fibers are then stored at 4 °C with the antibody immobilized tips stored in PBS.
3.3. Experimental procedures
An application of nanobiosensor involves monitoring single cells in vivo. This section provides a description of the protocols used for growing cell cultures for analysis using the nanobiosensors. Cell cultures are grown in a water-jacketed cell culture incubator at 37 °C in an atmosphere of 5% CO2 in air. Clone 9 cells, a rat liver epithelial cell line, are grown in Ham's F-12 medium (Gibco) supplemented with 10% fetal bovine serum and an additional 1 mM glutamine (Gibco). In preparation for an experiment, 1×10⁵ cells in 5 mL of medium are seeded into standard dishes (Corning Costar Corp.). The growth of the cells is monitored daily by microscopic observation, and when the cells reach a state of confluence of 50–60%, the analyte solution is added and left in contact with the cells for 18 h (i.e. overnight). This procedure is designed to incubate the cells with the analyte molecules for subsequent monitoring using the nanobiosensors. The growth conditions are chosen so that the cells would be in log phase growth during the chemical treatment, but would not be so close to confluence that a confluent monolayer would form by the termination of the chemical exposure. The analyte solution is prepared as a 1-mM stock solution in reagent grade methanol and further diluted in reagent grade ethanol (95%) prior to addition to the cells. Following chemical treatment, the medium containing the analyte is aspirated and replaced with standard growth medium, prior to the nanoprobe procedure.
Analysis of molecules in single cells is then performed using antibody nanoprobes in the following way. A culture dish of cells is placed on the pre-warmed microscope stage, and the nanoprobe, mounted on the micropipette holder, is moved into position (i.e. in the same plane of the cells), using bright field microscopic illumination, so that the tip is outside the cell to be probed. The total magnification is usually 400×. Under no room light and no microscope illumination, the laser shutter is opened to illuminate the optical fiber for excitation of the analyte molecules bound on the antibodies at the fiber tip. Usually, if the silver coating on the nanoprobe is appropriate, no light leaks out of the sidewall of the tapered fiber. Only a faint glow of laser excitation at the tip is be observed on the nanoprobe. A reading is first taken with the nanoprobe outside the cell and the laser shutter closed. The nanoprobe is then moved into the cell, inside the cell membrane and extending into the cellular compartments of interest. The laser is again opened, and readings are then taken and recorded as a function of time during which the nanoprobe is inside the cell.
3.4. Instrumentation
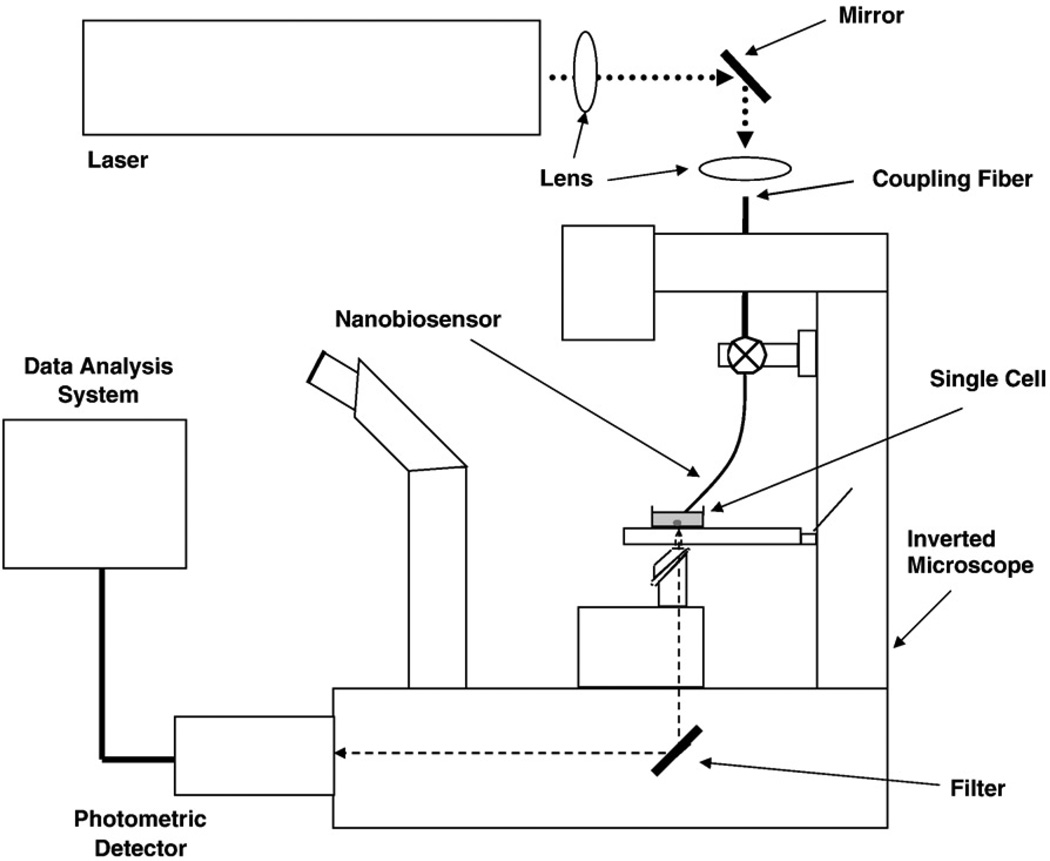
The optical detection system used for monitoring single cells using the nanobiosensors is schematically illustrated in Fig. 4. Laser excitation light, either the 325-nm line of a HeCd laser (Omnichrome, 8 mW laser power) or the 488-nm line of an argon ion laser (Coherent, 10 mW), is focused onto a 600-µm delivery fiber, which is connected to the nanofiber through an SMA connector. The nanofiber is secured to a micromanipulator on the microscope. The experimental setup used to probe single cells is adapted to this purpose from a standard micromanipulation/microinjection apparatus. A Nikon Diaphot 300 inverted microscope (Nikon, Inc.) with Diaphot 300/Diaphot 200 Incubator, to maintain the cell cultures at ~37 °C on the microscope stage, is used for these experiments. The micromanipulation equipment used consists of MN-2 (Narishige Co., LTD) Narishige three-dimensional manipulators for coarse adjustment, and Narishige MMW-23 three-dimensional hydraulic micromanipulators for final movements. The optical fiber nanoprobe is mounted on a micropipette holder (World Precision Instruments, Inc.). The fluorescence emitted from the cells is collected by the microscope objective and passed through an appropriate longpass dichroic mirror to eliminate the laser excitation scatter light. The fluorescence beam is then focused onto a photomultiplier tube (PMT) for detection. The output from the PMT is passed through a picoammeter and recorded on a strip chart recorder or a personal computer (PC) for further data treatment. To record the fluorescence of analyte molecules binding to antibodies at the fiber tip, a Hamamatsu PMT detector assembly (HC125-2) is mounted in the front port of the Diaphot 300 microscope, and fluorescence is collected via this optical path (80% of available light at the focal plane can be collected through the front port). A charge-coupled device (CCD) mounted onto another port of the microscope is used to record images of the nanobiosensor monitoring single cells.
Fig. 4.
Instrumental system for fluorescence measurements of single cells.
4. Applications
4.1. Monitoring biomarkers in single living cells
The small size of this new class of nanosensors allows for measurements in submicron environments. One such environment that has evoked a great deal of interest is that of individual cells. Using these nanobiosensors, it has become possible to probe individual chemical species in specific locations throughout a cell. Previously, such measurements were limited to the field of fluorescence microscopy, where a fluorescent dye was inserted into a cell and allowed to diffuse throughout. Depending upon the particular fluorescent dye that was chosen, changes in the fluorescence properties of the dye could then be monitored, in an imaging modality, as the dye came in contact with the analyte of interest. Since this technique relies on imaging the fluorescent dye, it requires the homogenous dispersion of the dye through the various locations in the cell, which is limited by intracellular conditions (i.e. pH, etc.) or often does not even occur due to compartmentalization by the cell. Fiber-optic nanobiosensors, therefore, could offer significant improvements over such methods to the problems associated with cellular diffusion.
Nanobiosensors that have antibody-based probes to measure specific fluorescent targets inside a single cell have been demonstrated [16–22]. Since cells have very small sizes (1–10 µm) the success of intracellular investigations depends on several factors, including the sensitivity of the measurement system, the selectivity of the probe and the small size of the nanofiber probes. The smallest cells to be non-destructively probed with a fiber-optic nanobiosensor were reported for in situ measurements of the carcinogen benzo[a]pyrene (BaP), a polycyclic aromatic hydrocarbon of great environmental and toxicological interest [21]. Benzo[a]pyrene has been identified as a chemical carcinogen in laboratory animal studies. Detection of BaP transport inside single cells is of great biomedical interest since it can serve as a means for monitoring BaP exposure, which can lead to DNA damage. In order to perform these measurements, it was necessary to use antibodies targeted to BaP. The fluorescent BaP molecules were bound by interaction with the immobilized antibody receptor, forming a receptor–ligand complex. Upon laser excitation of this complex, a fluorescence signal emitted by BaP molecules provided a basis for the quantification of BaP concentration in the cell being monitored. The fluorescence signal generated allows for a high sensitivity of detection. The intracellular measurements of BaP depend on the reaction times involved. The reaction time established in this study for antibody–BaP complexing was 5 min. This was used as a standard time to enable calibration from fiber to fiber. Additionally, the nanobiosensors were calibrated using standard analytical procedures using measurements of known concentration of reference solutions. Our study was the first application of antibody-based nanoprobes for measurements of biochemicals in a single living cell [16].
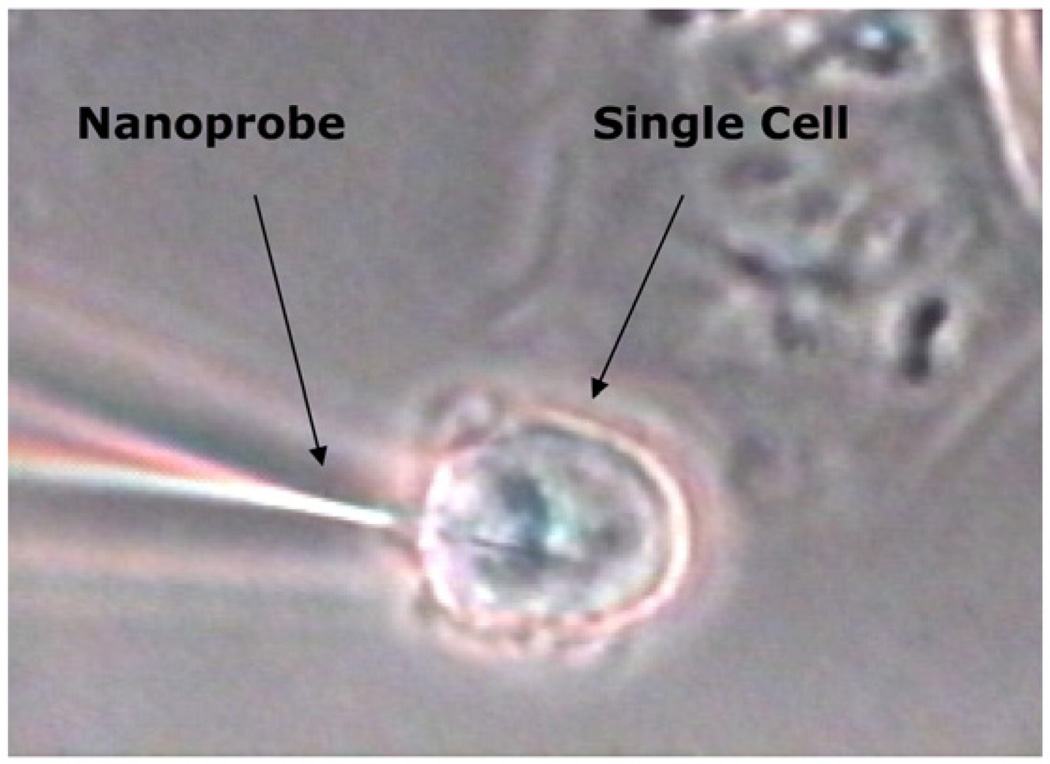
In another study, the antibody probe was targeted against benzopyrene tetrol (BPT), an important biological compound, which was used as a biomarker of human exposure to BaP [19]. The cells were first incubated with BPT prior to measurements using the experimental procedures described previously. Monitoring BPT was then carried out using antibody nanoprobes for excitation and a photometric system for fluorescence signal detection. Nanobiosensors for BPT were used for the measurement of intracellular concentrations of BPT in the cytoplasm of two different cell lines: 1) human mammary carcinoma cells and 2) rat liver epithelial cells, following treatment of the culturing media with an excess of BPT. Fig. 5 depicts an image of the nanobiosensor inserted into a single human mammary carcinoma cell. The measurements were performed on rat liver epithelial cells (Clone 9) used as the model cell system. The cells had been previously incubated with BPT molecules prior to measurements. The results demonstrated the possibility of in situ measurements of BPT inside a single cell.
Fig. 5.
Photograph of a fiber-optic nanobiosensors inserted into a single cell.
It is noteworthy that the nanobiosensors were equipped with single-use bioprobes because the probes were used to obtain only one measurement at a specific time and could not be reused due to the strong association constant of the antibody–antigen binding process. The antibody probes, however, could be regenerated using ultrasound methods. Our laboratory has successfully developed a method using ultrasound to non-invasively release antigen molecules from the antibodies, and therefore, to regenerate antibody-based biosensors [24]. The results of the measurements with antibody against breast cancer antigen illustrate the effectiveness and potential of the regenerable immunosensor. A 65% removal of the antigens bound to the monoclonal antibodies immobilized on the fiber surface is attained after ultrasound regeneration. The ultrasound regeneration scheme is a non-destructive approach that has a great potential to be applied to nanobiosensors. The results demonstrate the effectiveness of this innovative ultrasound-based approach for biosensor regeneration, i.e. releasing the antigen from the antibody probe.
Multiple calibration measurements of solutions containing different BPT concentrations were carried out to obtain a quantitative estimation of the amount of BPT molecules detected. Multiple (e.g., five) recordings of the fluorescence signals could be taken with each measurement using a specific nanoprobe. For these calibration measurements, the fibers were placed in Petri dishes containing solutions of BPT with concentrations ranging from 1.56×10⁻¹⁰ M to 1.56×10⁻⁸ M. By plotting the increase in fluorescence from one concentration to the next versus the concentration of BPT, and fitting these data with an exponential function in order to simulate a saturated condition, a concentration of (9.6±0.2)×10−11 M was determined for BPT in the individual cell investigated.
4.2. Detection of apoptotic signaling in a single living cell
During the last few years there has been increasing interest in developing instruments and techniques for monitoring the onset of apoptosis in living cells. The cell death process known as apoptosis is executed in a highly organized fashion, indicating the presence of well-defined molecular pathways. Caspase activation is a hallmark of apoptosis, and probably one of the earlier markers that signals the apoptotic cascade [25–28]. These cysteine proteases are activated during apoptosis in a self-amplifying cascade. A variety of experimental evidence suggests that caspase activation is essential for the apoptotic process to take place, although not all cell death is dependent upon caspase activation. Caspases have an essential role both in the initial signaling events of apoptosis, as well as in the downstream processes which produce the various hallmark signs of apoptosis [26,28]. Activation of so-called “upstream” caspases like caspases 2,8, 9 and 10 leads to proteolytic activation of “downstream “ caspases such as 3, 6 and 7. Two different pathways of caspase activation have so far been observed. One, the mitochondrial pathway, involves the release of cytochrome c, and other caspase-activating factors (e.g. apoptosis-inducing factor [AIF], apoptosis protease-activating factor [Apaf-1] and dATP) from the mitochondrion. These factors associate in the cytoplasm to form a complex that in turn activates pro-caspase 9 to the active form. The other pathway involves the binding of the appropriate ligand to the death receptors, which include Fas and TNF receptors. Caspase 8 seems to be the most “upstream” caspase in this pathway. It has become increasingly apparent that the mitochondria play a major role in the apoptosis process. The key mitochondrial components regulating apoptosis exert their effects two control points — the permeability transition pore complex (PTPC) situated at points where the inner and outer mitochondrial membranes come into close proximity, and the apoptosome located just outside the mitochondria.
We have used nanobiosensors for monitoring the onset of the mitochondrial pathway of apoptosis in a single living cell by detecting enzymatic activities of caspase-9 [21]. Minimally invasive analysis of single liveMCF-7 cells for caspase-9 activity was demonstrated using the optical nanobiosensor which employed a modification of an immunochemical assay format for the immobilization of non-fluorescent enzyme substrate, Leucine-GlutamicAcid-Histidine-AsparticAcid-7-amino-4-methyl coumarin (LEHD-AMC). LEHD-AMC covalently attached on the tip of an optical nanobiosensor was cleaved during apoptosis by caspase-9 generating free AMC. An evanescent field was used to excite cleaved AMC and the resulting fluorescence signal was detected. By quantitatively monitoring the changes in fluorescence signals, caspase-9 activity within a single living MCF-7 cell was detected. Photodynamic therapy (PDT) protocols employing δ-aminolevulinic acid (ALA) were used to induce apoptosis in MCF-7 cells. The substrate LEHD-AMC was cleaved by caspase-9 and the released AMC molecules were excited and emitted a fluorescence signal. By comparing the fluorescence from an apoptotic cell and an uninduced control, we detected and identified caspase-9 activity. By comparison of the fluorescence signals from apoptotic cells induced by photodynamic treatment, and non-apoptotic cells, we successfully detected caspase-9 activity, which indicates the onset of apoptosis in the cells.
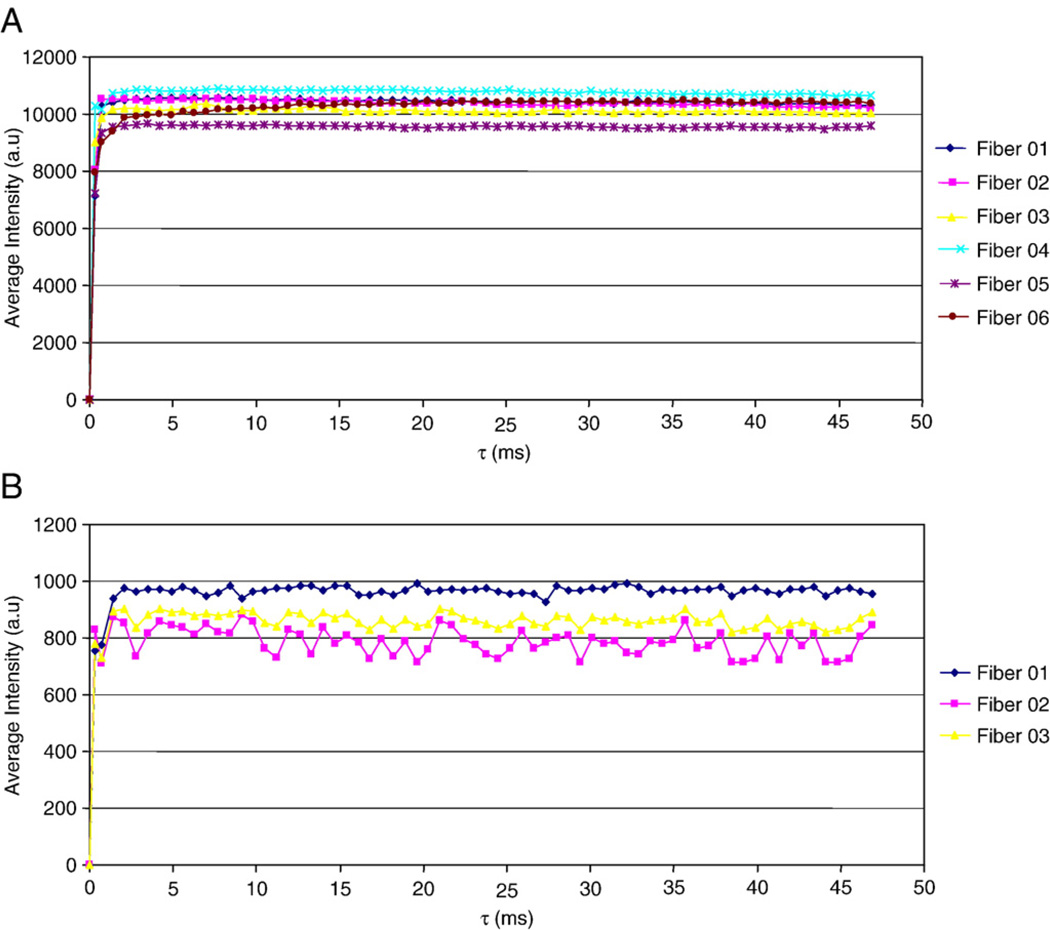
The results show that the fluorescence signals obtained from the cells that were both incubated with ALA and photoactivated by laser excitation (Fig. 6A) were much higher than the signal obtained from control groups, i.e., without laser activation (Fig. 6B). The presence and detection of cleaved AMC in single live MCF-7 cells as a result of these experiments reflects the presence of caspase-9 activity and the occurrence of apoptosis. These results indicate that apoptosis can be monitored in vivo using optical nanobiosensors in a single living cell.
Fig. 6.
(A) Detection of caspase-9 activity in MCF-7 cells with ALA and laser treatment. (B) Monitoring of the control group of MCF-7 cells with ALA and no laser treatment [adapted from Ref. [21]].
5. Conclusion
In the living cell, which is the smallest structural unit of biological life, a myriad of biological systems perform functions as diverse as energy metabolism, intra- and intercellular signaling, and self-reproduction in a complex but well-orchestrated processes. Therefore, measurements of biomolecules and pathways in intact live cells provide more relevant knowledge of their physiological function than biochemical assays carried out with isolated molecules from lysed cells in test tubes. The convergence of molecular biology, photonics, and nanotechnology opens the possibility of detecting and manipulating atoms and molecules using nanoscale devices such as nanobiosensors for a wide variety of chemical, biological and medical applications at the single cell level. The nanobiosensor technology has the potential to provide the critical information on the functioning of the living cell in a systems biology perspective and, therefore, could change our fundamental understanding of the life process itself. Combined with the exquisite molecular recognition of antibody probes, nanobiosensors have great potential to serve as powerful tools capable for exploring biomolecular processes in sub-compartments of living cells. These nanotools could ultimately lead to the development of new modalities for early diagnostics and medical treatment and prevention beyond the cellular level to that of individual organelles and even DNA, the building block of life.
Acknowledgements
The author acknowledges the contribution of P. Kasili, B.M. Cullum, J.P. Alarie, and G.D. Griffin. This research is sponsored by the National Institutes of Health R01ES014774.
Footnotes
This article is published in a special honor issue dedicated to Jim Winefordner on the occasion of his retirement, in recognition of his outstanding accomplishments in analytical atomic and molecular spectroscopy.
References
- 1.Zandonella C. Cell nanotechnology: the tiny toolkit. Nature. 2003;423:10–12. doi: 10.1038/423010a. [DOI] [PubMed] [Google Scholar]
- 2.Vo-Dinh T, Tromberg BJ, Griffin GD, Ambrose KR, Sepaniak, Gardenshire EM. Antibody-based fiberoptics biosensor for the carcinogen benzo(a)pyrene. Appl. Spectrosc. 1987;41:735–739. [Google Scholar]
- 3.Vo-Dinh T, Griffin GD, Sepaniak MJ. Fiberoptics immunosensors. In: Wolfbeis OS, editor. Chemical Sensors and Biosensors. Vol. 2. Florida: CRC Press Boca Raton; 1991. pp. 218–248. [Google Scholar]
- 4.Vo-Dinh T, Sepaniak MJ, Griffin GD, Alarie JP. Immunosensors: principles and applications. Immunomethods. 1993;3:85–93. [Google Scholar]
- 5.Alarie JP, Vo-Dinh T. Antibody-based submicron biosensor for benzo[a] pyrene DNA adduct. Polycycl. Aromat. Compd. 1996;8:45–52. [Google Scholar]
- 6.Alarie JP, Vo-Dinh T. A fiber-optic cyclodextrin-based sensor. Talanta. 1991;38:529–534. doi: 10.1016/0039-9140(91)80176-z. [DOI] [PubMed] [Google Scholar]
- 7.Tromberg BJ, Sepaniak MJ, Alarie JP, Vo-Dinh T, Santella SM. Development of antibody-based fiberoptics sensor for the detection of benzo(a)pyrene metabolite. Anal. Chem. 1998;60:1901–1908. doi: 10.1021/ac00169a012. [DOI] [PubMed] [Google Scholar]
- 8.Alarie JP, Bowyer JR, Sepaniak MJ, Hoyt AM, Vo-Dinh T. Fluorescence monitoring of benzo(a)pyrene metabolite using a regenerable immunochemical-based fiberoptic sensor. Anal. Chim. Acta. 1990;236:237–244. [Google Scholar]
- 9.Bowyer JR, Alarie JP, Sepaniak MJ, Vo-Dinh T, Thompson RQ. Construction and evaluation of regenerable, fluoroimmunochemical-based fiber optic biosensor. Analyst. 1991;116:117–123. [Google Scholar]
- 10.Pohl DW. Scanning near-field optical microscopy (SNOM) In: Sheppard CRJ, editor. Advances in Optical and Electron Microscopy. Vol. 12. London: Academic Press; 1991. pp. 243–312. [Google Scholar]
- 11.Betzig E, Chichester RJ. Single molecules observed by near-field scanning optical microscopy. Science. 1993;262:1422–1425. doi: 10.1126/science.262.5138.1422. [DOI] [PubMed] [Google Scholar]
- 12.Zeisel D, Deckert V, Zenobi R, Vo-Dinh T. Near-field surface-enhanced Raman spectroscopy of dye molecules adsorbed on silver island films. Chem. Phys. Lett. 1998;283:38–42. [Google Scholar]
- 13.Deckert V, Zeisel D, Zenobi R, Vo-Dinh T. Near-field surface-enhanced Raman imaging of dye-labeled DNA with 100-nm resolution. Anal. Chem. 1998;70:2646–2650. doi: 10.1021/ac971304f. [DOI] [PubMed] [Google Scholar]
- 14.Tan W, Shi ZY, Kopelman R. Development of submicron chemical optic sensors. Anal. Chem. 1992;64:2985–2990. [Google Scholar]
- 15.Tan W, Shi ZY, Smith S, Birnbaum D, Kopelman R. Submicrometer intracellularchemical optical fibre sensors. Science. 1992;258:778–781. doi: 10.1126/science.1439785. [DOI] [PubMed] [Google Scholar]
- 16.Vo-Dinh T, Alarie JP, Cullum PM, Griffin GD. Antibody-based nanoprobe for measurements in a single cell. Nat. Biotechnol. 2000;18:76–80. doi: 10.1038/77337. [DOI] [PubMed] [Google Scholar]
- 17.Vo-Dinh T, Cullum BM. Biosensors and biochips: advances in biological and medical diagnostics, Fresenius. J. Anal. Chem. 2000;366:540–551. doi: 10.1007/s002160051549. [DOI] [PubMed] [Google Scholar]
- 18.Vo-Dinh T, Cullum BM, Stokes DL. Nanosensors and biochips: frontiers inbiomolecular diagnostics. Sens. Actuators. 2001;B74:2–11. [Google Scholar]
- 19.Cullum BM, Griffin GD, Miller GH, Vo-Dinh T. Intracellular measurements in mammary carcinoma cells using fiber-optic nanosensors. Anal. Biochem. 2000;277:25–32. doi: 10.1006/abio.1999.4341. [DOI] [PubMed] [Google Scholar]
- 20.Kasili PM, Cullum BM, Griffin GD, Vo-Dinh T. Nanosensor for in-vivo measurement of the carcinogen benzo[a]pyrene in a single cell. Nanosci. J. Nanotechnol. 2002;6:653–659. doi: 10.1166/153348802321105941. [DOI] [PubMed] [Google Scholar]
- 21.Kasili PM, Song JM, Vo-Dinh T. Optical sensor for the detection of caspase-9 activity in a single cell. J. Am. Chem. Soc. 2004;126:2799–2806. doi: 10.1021/ja037388t. [DOI] [PubMed] [Google Scholar]
- 22.Vo-Dinh T, Kasili PM, Wabuyele MB. Nanoprobes and nanobiosensors for monitoring and imaging individuals living cells. Nanomedicine. 2006;2:22–30. doi: 10.1016/j.nano.2005.10.012. [DOI] [PubMed] [Google Scholar]
- 23.Vo-Dinh T. Surface-enhanced Raman spectroscopy using metallic nanostructures. Trends Anal. Chem. 1998;17:557–582. [Google Scholar]
- 24.Morena-Bondi M, Mobley J, Alarie JP, Vo-Dinh T. Antibody-based biosensor for breast cancer with ultrasonic regeneration. J. Biomed. Opt. 2000;5:350–356. doi: 10.1117/1.430006. [DOI] [PubMed] [Google Scholar]
- 25.Hug H, Los M, Hirt W, Debatin KM. Rhodamine 110-linked amino acids and peptides as substrates to measure caspase activity upon apoptosis induction in intact cells. Biochemistry. 1999;38:13906–13911. doi: 10.1021/bi9913395. [DOI] [PubMed] [Google Scholar]
- 26.Wolf B, Green DR. Suicidal tendencies: apoptotic cell death by caspase family proteinases. J. Biol. Chem. 1999;274:20049–20052. doi: 10.1074/jbc.274.29.20049. [DOI] [PubMed] [Google Scholar]
- 27.Hengartner MO. Apoptosis: DNA destroyers. Nature. 2001;412:27–29. doi: 10.1038/35083663. [DOI] [PubMed] [Google Scholar]
- 28.Ricci JE, Gottlieb RA, Green DR. Caspase-mediated loss of mitochondrial function and generation of reactive oxygen species during apoptosis. J. Cell Biol. 2003;160:65–75. doi: 10.1083/jcb.200208089. [DOI] [PMC free article] [PubMed] [Google Scholar]


