

Abstract
Objective
To examine the independent and combined associations of obesity and muscle strength with mortality in adult men and women.
Design
Follow-up study with 33 years of mortality follow-up.
Subjects
A total of 3 594 men and women aged 50–91 years at baseline with 3 043 deaths during the follow-up.
Measurement
Body mass index (BMI) and handgrip strength were measured at baseline.
Results
Based on Cox models adjusted for age, sex, education, smoking, alcohol use, physical activity and chronic conditions, baseline obesity (BMI ≥ 30 kg/m2) was associated with mortality among participants aged 50–69 years (HR 1.14, 95% CI 1.01–1.28). Among participants aged 70 years and older overweight and obesity were protective (HR 0.77, 95% CI 0.66–0.89 and HR 0.76, 95% CI 0.62–0.92). High handgrip strength was inversely associated with mortality among participants aged 50–69 (HR 0.89, 95% CI 0.80–1.00) and 70 years and older (HR 0.78, 95% CI 0.66–0.93). Compared to normal weight participants with high handgrip strength, the highest mortality risk was observed among obese participants with low handgrip strength (HR 1.23, 95% CI 1.04–1.46) in the 50–69 age group and among normal weight participants with low handgrip strength (HR 1.30, 95% CI 1.09–1.54) among participants aged 70+ years. In addition in the old age group, overweight and obese participants with high handgrip strength had significantly lower mortality than normal weight participants with high handgrip strength (HR 0.79, 95% CI 0.67–0.92 and HR 0.77, 95% CI 0.63–0.94).
Conclusion
Both obesity and low handgrip strength, independent of each other, predict the risk of death in adult men and women with additive pattern. The predictive value of obesity varies by age, whereas low muscle strength predicts mortality in all age groups aged > 50 years and across all BMI categories. When promoting health among older adults, more attention should be paid to physical fitness in addition to body weight and adiposity.
Keywords: body mass index, muscle strength, mortality
INTRODUCTION
Obesity is one of the great global public health challenges of our times. Excess adiposity is associated with an increased risk for metabolic consequences such as hypertension and dyslipidemia and it contributes to the risk of diabetes mellitus and coronary heart disease (1) as well as mortality (2–4). In addition, obesity carries an increased risk of arthritis and reduces functional capacity (5).
Prior studies show that abundant physical activity and good cardiorespiratory fitness can attenuate but not completely eliminate the increased mortality risk associated with class I or II obesity measured with body mass index (BMI) or abdominal obesity (6–9). Another aspect of fitness, muscular strength, is also known to be a very strong predictor of survival (10–12). The important role of muscle strength for health and functioning has also been emphasized in the latest physical activity guidelines, in which muscle strengthening activities were recommended for all age groups together with aerobic activity (13). However, little is known about whether good muscle strength attenuates the association between obesity and mortality. Two previous studies examined this question but utilized only data for men (14, 15). We propose that muscle strength reflects physical condition regardless of obesity or other determinants of excess mortality risk. Therefore, persons at different degrees of overweight should fare better if their physical condition (muscle strength) is better.
To our knowledge, no previous study has investigated the independent and combined associations of obesity/overweight and muscle strength with mortality in men and women and whether these relationships differ across age groups. Thus, the aim of the present study was to examine the main effects of obesity and grip strength and their potential interactions on mortality in a representative sample of Finnish adults enrolled in the Mini-Finland Health Examination Survey with 33 years of mortality follow-up.
METHODS
Study population
The Mini-Finland Health Survey was carried out in 1978–1980 in 40 areas of Finland (16). A stratified two stage systematic sample (n = 8 000) was drawn from the Social Insurance Institution register (17). The sample represents Finnish population aged 30 years and older, and the individuals had an equal probability of selection (epsem). A total of 7 217 participants (90% of the sample) participated in the survey, which included a health examination. Details of the design and implementation of the Mini-Finland Health Examination Survey have been reported elsewhere (16, 18). In this analysis, the study population was restricted to those aged 50 years and older for whom we had information on both body mass index (BMI) and handgrip strength as well as key covariates (n = 3 622). We excluded persons who were underweight (BMI<18.5; n = 28), resulting analytic cohort of 3 594 men and women.
Baseline measurements
Body weight was measured by a frequently calibrated lever balance with participants wearing light indoor clothing without shoes. Height was measured without shoes and with the back against a wall. BMI was calculated as weight divided by the square of height (kg/m2) and categorized as normal weight (BMI 18.5–<25 kg/m2), overweight (BMI 25–<30 kg/m2) and obese (BMI ≥ 30 kg/m2) as suggested by the National Institutes of Health, NHLBI (19).
Handgrip strength was used as a proxy for overall muscle strength (20, 21). Maximal handgrip strength was measured using a handheld dynamometer based on strain gauge sensors (Bruel-Kjaer Type 1526; Denmark; (22). The unit of measurement is kilopond (kp) (1 kp equals to the magnitude of the force exerted by one kilogram of mass). The measurement was conducted separately for each hand with the participant seated. The width of the handle was adjusted for the participant’s hand size. The best result of the stronger hand was used in the analyses. There was a high correlation between the test and retest results (correlation coefficient = 0.91–0.93, n = 449) (22). In the present study, participants were divided into sex-specific tertiles of handgrip strength within both age group. The cutpoints in the 50–69 age group were for men: I 0–41, II 42–50, III 51–80 kp and women: I 0–23, II 24–29, III 30–63 kp). Among participants aged 70 years and older for men: I 0–28, II 29–39, III 40–60 kp and women: I 0–18, II 19–23, III 24–36 kp).
Mortality follow-up
The mortality of the survey participants was continuously followed up from the baseline examination in 1978–1980 up to December 31, 2011. The personal identification number assigned for every resident in Finland was used to link the Mini-Finland health survey data with the Finnish mortality registry maintained by Statistics Finland. Deaths were recorded whether participants died in Finland or abroad. There were 3 043 deaths during the follow-up period.
Baseline covariates
Education was based on the total number of completed years of schooling and was dichotomized as < 9 and ≥ 9 years of education. Smoking behavior was classified as never smokers, ex-smokers, and current smokers. Average weekly alcohol consumption (g/wk) during the preceding month was calculated and the threshold for heavy alcohol use was defined as280 g/wk for men and 140 g/wk for women (23). Leisure time physical activity was assessed with a questionnaire in which participants were asked to indicate their average level of physical activity. Leisure time physical activity was classified as regular exercise activity (e.g., running, biking, gymnastics), occasional physical exercise or lifestyle activity (e.g., gardening, hunting, outdoor recreation), and inactive (e.g., reading, watching television). Standardized clinical examinations were carried out by specially trained physicians who diagnosed chronic conditions on the basis of clinical findings, symptoms, disease histories, laboratory results and related documentation using uniform criteria (16, 18, 24). For total cholesterol and other biochemical analyses, blood samples were taken at the study site, frozen and transferred to the central laboratory. Chronic conditions taken into account in this study were hypertension (defined as systolic blood pressure ≥ 140 mmHg or diastolic blood pressure ≥90 mmHg), total cholesterol, cardiovascular disease (myocardial infarction or stroke), diabetes and cancer.
Statistical analysis
All analyses were stratified by two age groups based on baseline age: 50–69 and 70 years and older. Baseline characteristics are presented as mean (standard deviation, SD) values for continuous variables and percentages for categorical variables. Group differences were assessed by Chi-square and t tests.
Cox proportional hazards models were used to estimate hazard ratios (HR) in multivariate models. Person-years of follow-up for each participant were calculated from the date of the baseline examination to the date of death or end of mortality follow-up for survivors. The first models were adjusted for age, sex, education, smoking status, alcohol use and physical activity. The second models were adjusted for categorical handgrip strength (for models related to BMI) and for categorical BMI (for models related to handgrip strength). Finally, since it has been suggested that factors such as hypertension, cardiovascular diseases and diabetes are in the causal pathway between obesity and mortality (25), the third models were adjusted for baseline hypertension, total cholesterol, cardiovascular disease, diabetes and cancer. Finally, also hazard ratios for all combinations of BMI and handgrip strength were calculated. Proportional hazards assumption was investigated for all Cox models by testing the interactions with time (log transformed) and the proportional hazards assumption was not violated.
To address the possibility that the relation between BMI and handgrip strength on early mortality may have been confounded by pre-existing disease, we conducted two sensitivity analyses. First, we excluded the first 5 years of follow-up and secondly participants with cardiovascular, disease, diabetes and cancer at baseline were excluded from the analysis. In addition, due to very long follow-up period available in the data, we present additional analyses stratified by follow-up time (5 to ≤15 and 15–33 years). These were conducted for both age groups separately (50–69, and ≥70). Finally, we performed analyses stratified by smoking status (ever vs. never smokers) because of concerns that the HRs of BMI and handgrip strength differ by smoking status.
Due to the complex sampling design in the Mini-Finland Health Survey, the design effects were examined and found that most of them were around or below 1 (17). As a consequence, for most variables the results obtained by weighted analysis and by non-weighted model-based analysis were practically the same. Therefore, the results in this study are based on non-weighted model-based analysis. All analyses were performed using the SAS System for Windows, version 9.3 (SAS Institute, Inc., Cary, NC).
RESULTS
During mean follow-up period of 17.9 years (SD 9.7, range 5–33.9 years), 1354 men and 1689 women died resulting in total of 60 923 person-years of follow-up. Table 1 shows the baseline characteristics of the study population according to baseline age. Participants aged 70 years and older had lower BMI and lower handgrip strength than participants aged 50–69 years. Older participants also had fewer years of education, they were less often current smokers and heavy alcohol users and were physically more inactive, and they had more chronic conditions compared to younger participants. At baseline, categorized BMI and handgrip strength tertiles were inversely associated among participants aged 50–69 and 70 years and older.
Table 1.
Baseline characteristics of study participants according to baseline age. Mini-Finland Health Examination Survey (n = 3594).
| 50–69 years | ≥ 70 years | p value* | |
|---|---|---|---|
| N | 2718 | 876 | |
| Mean Age (SD) | 58.6 (5.8) | 75.3 (4.5) | <.0001 |
| Male, % | 44.5 | 37.2 | 0.0002 |
| Education < 9 yrs, % | 78.8 | 85.6 | <.0001 |
| Current smoker, % | 20.4 | 10.0 | <.0001 |
| Heavy alcohol use, % | 2.5 | 1.0 | 0.0102 |
| Physically inactive, % | 40.1 | 54.3 | <.0001 |
| Mean BMI (SD) | 27.0 (4.1) | 26.4 (4.1) | <.0001 |
| Mean grip strength (SD) | 34.0 (14.6) | 23.8 (12.3) | <.0001 |
| Hypertension, % | 50.9 | 66.3 | <.0001 |
| Cardiovascular disease, % | 8.0 | 13.2 | <.0001 |
| Diabetes, % | 7.5 | 16.8 | <.0001 |
| Cancer, % | 3.2 | 4.9 | 0.0218 |
Notes: SD = standard deviation;
The differences across groups were calculated by Chi square and t tests for categorical and continuous variables, respectively.
Among participants aged 50–69 years at baseline, obesity (BMI ≥ 30 kg/m2) was associated with a significantly higher mortality risk (HR= 1.23, 95% confidence interval (CI) 1.09–1.39) in comparison with normal weight, whereas overweight (BMI 25–29.9 kg/m2) did not exhibit a significant association with mortality (HR 0.98, 95% CI 0.89–1.08) (Table 2, model 1). Adjustment for handgrip strength did not markedly change these associations (Table 2, model 2). Despite further adjustment for chronic conditions, the association between obesity and mortality in the 50–69 age group remained statistically significant (Table 2, model 3). Among the older group, overweight (HR = 0.77, 95% CI 0.66–0.89) and obesity (HR = 0.76, 95% CI 0.62–0.92) had a significant inverse association with mortality in the fully adjusted models.
Table 2.
All-cause mortality during 33 years of follow-up according to Body Mass Index in different age groups. Mini-Finland Health Examination Survey (n = 3594).
| Body Mass Index | Number of participants | Number of deaths | Persons years of follow-up | Model 1
|
Model 2
|
Model 3
|
|||
|---|---|---|---|---|---|---|---|---|---|
| HR | (95% CI) | HR | (95% CI) | HR | (95% CI) | ||||
| 50–69 years | |||||||||
| 18.5–24.9 | 922 | 711 | 17857 | 1.00 | 1.00 | 1.00 | |||
| 25–29.9 | 1222 | 973 | 24453 | 0.98 | (0.89, 1.08) | 0.99 | (0.89, 1.09) | 0.96 | (0.87, 1.06) |
| ≥ 30 | 574 | 485 | 10738 | 1.23 | (1.09, 1.39) | 1.24 | (1.10, 1.40) | 1.14 | (1.01, 1.28) |
| ≥ 70 years | |||||||||
| 18.5–24.9 | 356 | 354 | 2840 | 1.00 | 1.00 | 1.00 | |||
| 25–29.9 | 354 | 354 | 3390 | 0.83 | (0.71, 0.96) | 0.84 | (0.72, 0.97) | 0.77 | (0.66, 0.89) |
| ≥ 30 | 166 | 166 | 1645 | 0.77 | (0.64, 0.93) | 0.81 | (0.67, 0.98) | 0.76 | (0.62, 0.92) |
Notes: Model 1 adjusted for age, sex, education, smoking, alcohol use and physical activity.
Model 2 additionally adjusted for handgrip strength.
Model 3 additionally adjusted for baseline hypertension, cardiovascular disease, diabetes and cancer.
Participants in the highest tertile of handgrip strength had a significantly lower risk of death among participants aged 50–69 (HR 0.89, 95% CI 0.79–0.99) and 70 years and older (HR 0.75, 95% CI 0.63–0.89) at baseline (Table 3, model 1). Adjustment for BMI or chronic conditions did not markedly change these associations (Table 3, model 2 and 3).
Table 3.
All-cause mortality during 33 Years of follow-up according to Handgrip Strength tertiles in different age groups. Mini-Finland Health Examination Survey (n = 3594).
| Handgrip strength tertiles | Number of participants | Number of deaths | Person years of follow-up | Model 1
|
Model 2
|
Model 3
|
|||
|---|---|---|---|---|---|---|---|---|---|
| HR | (95% CI) | HR | (95% CI) | HR | (95% CI) | ||||
| 50–69 years | |||||||||
| Low | 903 | 794 | 15856 | 1.00 | 1.00 | 1.00 | |||
| Middle | 946 | 749 | 18629 | 0.97 | (0.88, 1.08) | 0.97 | (0.87,1.07) | 0.96 | (0.86, 1.06) |
| High | 869 | 626 | 18561 | 0.89 | (0.79, 0.99) | 0.88 | (0.78,0.98) | 0.89 | (0.80, 1.00) |
| ≥ 70 years | |||||||||
| Low | 294 | 294 | 2310 | 1.00 | 1.00 | 1.00 | |||
| Middle | 284 | 283 | 2422 | 0.93 | (0.79, 1.10) | 0.93 | (0.79,1.10) | 0.89 | (0.75, 1.05) |
| High | 298 | 297 | 3143 | 0.75 | (0.63, 0.89) | 0.77 | (0.65,0.92) | 0.78 | (0.66, 0.93) |
Notes: Model 1 adjusted for age, sex, education, smoking, alcohol use and physical activity.
Model 2 additionally adjusted for body mass index.
Model 3 additionally adjusted for baseline hypertension, cardiovascular disease, diabetes and cancer.
In Table 4 we show hazard ratios for each BMI and handgrip strength combination. Normal weight with high handgrip strength was the reference group. Among participants aged 50–69 years at baseline weaker handgrip strength was associated with higher mortality risk across BMI groups after adjusting for sociodemographic and lifestyle factors (Figure 1a). The highest mortality risk was among obese participants with low handgrip strength (HR 1.40, 95% CI 1.18–1.66). Additional adjustment for baseline chronic conditions slightly attenuated the associations, but the excess mortality risk related to low handgrip strength among obese participants remained statistically significant (Table 4, model 2). Also among the participants aged 70 years and older at baseline, risk of death increased with decreasing handgrip strength for each BMI category (Figure 1b). Mortality was significantly higher only among normal weight participants with low and medium handgrip strength relative to normal weight participants with high handgrip strength (HR 1.30, 95% CI 1.09–1.55 and HR 1.22, 95% CI 1.02–1.45). After adjusting for baseline chronic conditions, overweight and obesity combined with high handgrip strength became significant (HR 0.79, 95% CI 0.67–0.92 and HR 0.77, 95% CI 0.63–0.94) and decreased the risk of death.
Table 4.
All-cause mortality during 33 Years of follow-up according to combinations of Body Mass Index and handgrip strength tertiles in different age groups. Mini-Finland Health Examination Survey (n = 3594).
| Combination of BMI and handgrip strength tertiles | Number of participants | No. of deaths | Person years of follow-up | Model 1
|
Model 2
|
|||
|---|---|---|---|---|---|---|---|---|
| HR | (95% CI) | HR | (95% CI) | |||||
| 50–69 years | ||||||||
| Normal weight | High grip | 242 | 156 | 5350 | 1.00 | 1.00 | ||
| Medium grip | 335 | 251 | 6712 | 1.06 | (0.95,1.18) | 1.02 | (0.92,1.14) | |
| Low grip | 345 | 304 | 5795 | 1.10 | (0.98,1.23) | 1.06 | (0.94,1.18) | |
| Overweight | High grip | 444 | 334 | 9436 | 1.02 | (0.92,1.12) | 0.98 | (0.89,1.08) |
| Medium grip | 414 | 324 | 8288 | 1.07 | (0.92,1.25) | 1.00 | (0.86,1.17) | |
| Low grip | 364 | 315 | 6729 | 1.12 | (0.96,1.31) | 1.04 | (0.89,1.21) | |
| Obese | High grip | 183 | 136 | 3775 | 1.27 | (1.13,1.44) | 1.16 | (1.03,1.31) |
| Medium grip | 197 | 174 | 3629 | 1.35 | (1.14,1.59) | 1.19 | (1.01,1.41) | |
| Low grip | 194 | 175 | 3333 | 1.40 | (1.18,1.66) | 1.23 | (1.04,1.46) | |
| ≥ 70 years | ||||||||
| Normal weight | High grip | 96 | 96 | 931 | 1.00 | 1.00 | ||
| Medium grip | 121 | 120 | 944 | 1.22 | (1.02,1.45) | 1.16 | (0.97,1.38) | |
| Low grip | 139 | 138 | 965 | 1.30 | (1.09,1.55) | 1.30 | (1.09,1.54) | |
| Overweight | High grip | 124 | 124 | 1357 | 0.86 | (0.74,1.00) | 0.79 | (0.67,0.92) |
| Medium grip | 117 | 117 | 1057 | 1.05 | (0.83,1.32) | 0.91 | (0.72,1.16) | |
| Low grip | 113 | 113 | 976 | 1.12 | (0.88,1.42) | 1.02 | (0.80,1.29) | |
| Obese | High grip | 74 | 74 | 856 | 0.83 | (0.68,1.01) | 0.77 | (0.63,0.94) |
| Medium grip | 46 | 46 | 421 | 1.01 | (0.76,1.34) | 0.90 | (0.67,1.19) | |
| Low grip | 46 | 46 | 369 | 1.08 | (0.82,1.43) | 1.00 | (0.75,1.33) | |
Notes: Model 1 adjusted for age, sex, education, smoking, alcohol use and physical activity.
Model 2 additionally adjusted for baseline hypertension, cardiovascular disease, diabetes and cancer.
Figure 1.
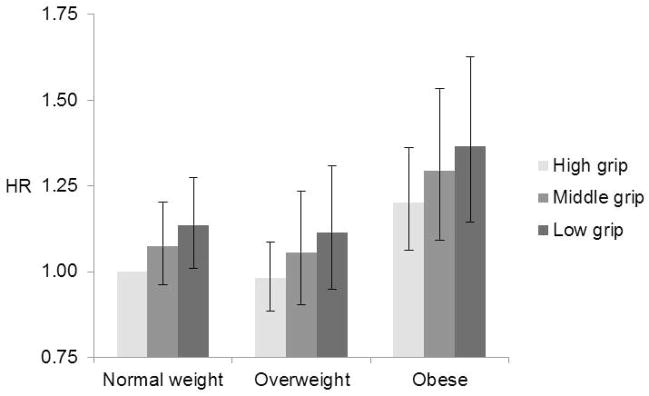
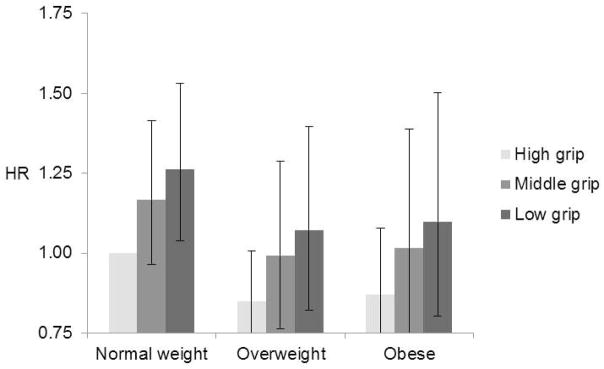
All-cause mortality during 33 years of follow-up according to the combination of Handgrip Strength and Body Mass Index among participants aged a) 50–69 years and b) ≥ 70 years. Models adjusted for age, sex, education, smoking, alcohol use and physical activity.
In order to take into account the potential confounding by pre-existing diseases we conducted sensitivity analyses in which we excluded the first 5 years of follow-up and alternatively excluded participants with cardiovascular, disease, diabetes and cancer at baseline (data not shown). The results were very similar after excluding first years of follow-up. Excluding participants with chronic conditions at baseline did not change the results related to BMI in younger participants, but the protective effect of obesity on mortality disappeared among older participants (data not shown). The exclusion of chronic conditions also reduced the association between handgrip strength and mortality in both age groups.
All analyses were also repeated by stratifying the follow-up time into early years (0 to 15 years) and later years (15–33 years) (Appendix 1). The results were very similar indicating that the length of follow-up did not affect the observed associations between obesity and low handgrip strength on mortality.
Finally, we also conducted separate analyses showing results by smoking status to take into account potential differences in HRs by smoking status (Appendix 2). The association between obesity and mortality was stronger among ever smokers than never smokers in the 50–69 age group, but it was weaker among ever smokers than never smokers in the ≥70 age group. The association between low handgrip strength and mortality did not differ between never and ever smokers in the 50–69 age group, but it was weaker among ever smokers than never smokers in the ≥70 age group.
DISCUSSION
The results of this representative prospective study demonstrate that both obesity and low handgrip strength, independent of each other, predict mortality among participants aged 50–69 years at baseline. However, among participants aged 70 years and older at baseline obesity was inversely associated with mortality and low handgrip strength positively associated with mortality. After combining the effects of BMI and handgrip strength, low handgrip strength increased the risk of mortality for all BMI categories in younger and older participants. Among participants aged 50–69 years at baseline the mortality risk was highest in obese participants with low handgrip strength and among participants aged ≥70 years it was highest in normal weight participants with low handgrip strength. In addition in the oldest age group, overweight and obese participants with high handgrip strength had significantly lower mortality than normal weight participants with high handgrip strength.
Our results regarding obesity and mortality agree with previous studies showing a positive association among middle-aged participants, but an inverse association between obesity and mortality among participants aged 70 years and older (2, 3, 26–30). Several explanations for the inverse association between obesity and mortality in older adults have been proposed including selection bias, pre-existing chronic diseases, weight history, fat redistribution and protective role of extra caloric stores (30–34). In this study, we controlled for many chronic diseases at baseline, but they had little effect on the association between BMI and mortality. However, after excluding participants with chronic conditions at baseline the protective effect of obesity on mortality disappeared among older healthy participants. In addition, it has been suggested that information on weight dynamics and obesity duration over the life course might be useful when examining obesity-related mortality (35, 36). Unfortunately, we only had a single observation of BMI and other determinants of mortality measured at baseline.
Although the association between low handgrip strength and mortality is well-reported, most previous studies examining the association between handgrip strength and mortality were restricted to older people and had follow-up periods shorter than 10 years (10, 37, 38). Only two studies from the United States, the Honolulu Heart Program and Baltimore Longitudinal Study on Aging, followed-up middle-aged men for a longer duration, 30 and 40 years, respectively (12, 14). In the study by Rantanen and colleagues (14) no age stratification was used, but Metter et al. (12) conducted analyses separately for men aged < 60 years and 60 years and older and found that the absolute handgrip strength was associated with mortality only in the older age group (12). In contrast, we found that low handgrip strength was also a significant predictor of mortality among participants below age 70 years.
There are several potential mechanisms linking low muscle strength to mortality. Muscle strength decline is often a consequence of subclinical disease and other negative physiological processes in the body. It has also been shown that elevated pro-inflammatory state, disturbances in hormones and insulin resistance are all associated with muscle strength decline (39–42). In this study adjustment for chronic conditions had very little effect on the association between handgrip strength and mortality. However, exclusion of participants with chronic conditions at baseline reduced the association between handgrip strength and mortality in both age groups supporting the important role of disease in the pathway towards decreasing muscle strength. In addition, good handgrip strength may be a marker of physical activity, which is associated with lower mortality (43). Finally, good performance in handgrip strength test may reflect some general intrinsic life vitality or motivation that tracks over the life course (44).
Handgrip strength as a measure is an easy test often used in large surveys. The results correlate with strength of other muscle groups and it is therefore a good and widely used indicator of overall strength (21). In this study the cutpoints for low handgrip strength were based on sex specific tertiles in both age group. Those in the lowest tertile in the 50–69 age group had handgrip strength close to a cutpoint (37 kg in men and 21 kg in women) that is shown to be associated with functional limitations and difficulties in mobility (45). Participants in the 70+ group had obviously lower values and those in the two lowest tertiles fell below this clinical threshold. Handgrip strength is easy to measure at clinical setting and could be used as a screening tool to identify individuals with low muscle strength and in need for exercise intervention. Several studies have confirmed that exercise, particularly strength training, is the best approach to increase muscle strength even in very old persons (46).
Two previous studies have examined the joint associations of overweight/obesity and muscle strength on mortality, but they were limited to men and selected study populations. Results from The Honolulu Heart Program suggested that having a high handgrip strength can partly counteract the deleterious effect of overweight on mortality (14). In the Aerobic Center Longitudinal Study the results were very similar although the outcome was restricted to cancer mortality (15). Our results based on a nationally representative population were quite similar, suggesting that obesity and handgrip strength have an additive rather than interactive effect on mortality. We observed slightly lower mortality risk with increasing handgrip strength among obese participants, despite the fact that we used obesity instead of overweight an indicator of excess weight. We did not detect significant interactions between obesity and hand grip strength suggesting that the protective role of high handgrip strength on mortality among obese participants remained in both age groups. The finding that a strong handgrip reflects a better prognosis in the elderly is supportive of the importance of muscle strength irrespective of age. Finally, although obesity may not be associated with excess mortality among older adults, it can have harmful effects on physical functioning (47, 48) and thus decrease quality of life of many older adults.
In the oldest age group, normal weight combined with low handgrip strength was associated with excess mortality risk compared to normal weight and overweight participants with high handgrip strength. With advancing age despite being in the healthy weight category (BMI 18.5–24.9 kg/m2), many elderly people may suffer from several chronic conditions that influence their weight status. Especially harmful is unintentional weight loss, which usually indicates underlying diseases and catabolic processes in the body, that may also accelerate muscle loss normally occurring with aging (49). We attempted to control for this possibility by excluding underweight persons from our analysis. In addition, we repeated the analysis by using less strict lower limit for BMI (BMI ≥ 20 kg/m2), but the results did not change. Moreover, in order to take into account the potential confounding by pre-existing diseases we conducted sensitivity analyses in which we excluded the first 5 years of follow-up and alternatively excluded participants with cardiovascular, disease, diabetes and cancer at baseline.
Smoking is associated with both a lower BMI, handgrip strength and an increased risk of death and can therefore distort the studied associations. Our smoking status stratified analysis showed that the association between obesity and mortality was stronger among ever smokers in the 50–69 age group which is in accordance with previous research (50). On the other hand, in the older age group the association between obesity and low handgrip strength on mortality was weaker among ever smokers. One explanation for this finding may be that smoking was not very common in this age group (current 10%, former 19%, never 71%) and those ever smokers that were still alive at the beginning of the study may have characteristics that have protected them from early death related to smoking.
The limitations of the current study include potential reverse causality between obesity and muscle strength. Obese people are known to be physically less active, which usually leads to lower muscle strength. There are also several physiological pathways that link excess adiposity to decreased muscle strength including sub-clinical inflammation and insulin resistance (39, 40). However, our results show that both obesity and low handgrip strength are associated with mortality independently of each other in at ages 50–69. Thus, they both carry unique information that increases the risk of death.
Despite its limitations, our large, long-term follow-up study provides important information on the association of two components of body composition, adiposity and muscle, on mortality. We were able to adjust for several confounding factors and examine the mortality risks across age groups, smoking status and length of follow-up.
In conclusion, we found obesity and low muscle strength to be independent, additive and important risk factors for mortality. The predictive value of obesity varies by age, whereas low muscle strength predicts mortality in all age groups aged > 50 years and across all BMI categories. Among participants aged 50–69 years the mortality risk was highest in obese participants with low handgrip strength and among participants aged ≥70 years it was highest in normal weight participants with low handgrip strength. High muscle strength among older participants with excess weight seems to provide the best protection against mortality. When promoting health and functioning among older adults more attention should be paid to physical fitness in addition to body weight and adiposity.
Supplementary Material
Acknowledgments
The authors wish to thank Dr. Tommi Härkänen for statistical support. This work was supported by grants from the Academy of Finland (264944 and 273850) and National Institute of Aging (RO1 #AG040212-01).
Footnotes
Conflict of Interest
The authors declare no conflict of interest.
Supplementary information is available at the journal’s website.
References
- 1.WHO. Report of a WHO Consultation. Geneva, Switzerland: 2000. Obesity: Preventing and managing the global epidemic. [PubMed] [Google Scholar]
- 2.Flegal KM, Kit BK, Orpana H, Graubard BI. Association of all-cause mortality with overweight and obesity using standard body mass index categories: A systematic review and meta-analysis. JAMA. 2013;309:71–82. doi: 10.1001/jama.2012.113905. [DOI] [PMC free article] [PubMed] [Google Scholar]
- 3.Whitlock G, Lewington S, Sherliker P, Clarke R, Emberson J, et al. Prospective Studies Collaboration. Body-mass index and cause-specific mortality in 900 000 adults: collaborative analyses of 57 prospective studies. Lancet. 2009;373:1083–1096. doi: 10.1016/S0140-6736(09)60318-4. [DOI] [PMC free article] [PubMed] [Google Scholar]
- 4.Mehta NK, Chang VW. Secular declines in the association between obesity and mortality in the United States. Popul Dev Rev. 2011;37:435–451. doi: 10.1111/j.1728-4457.2011.00429.x. [DOI] [PMC free article] [PubMed] [Google Scholar]
- 5.Stenholm S, Sainio P, Rantanen T, Alanen E, Koskinen S. Effect of co-morbidity on the association of high body mass index with walking limitation among men and women aged 55 years and older. Aging Clin Exp Res. 2007;19:277–283. doi: 10.1007/BF03324702. [DOI] [PubMed] [Google Scholar]
- 6.Koster A, Harris TB, Moore SC, Schatzkin A, Hollenbeck AR, van Eijk JTM, et al. Joint Associations of Adiposity and Physical Activity With Mortality: The National Institutes of Health-AARP Diet and Health Study. Am J Epidemiol. 2009;169:1344–1351. doi: 10.1093/aje/kwp053. [DOI] [PMC free article] [PubMed] [Google Scholar]
- 7.Wei M, Kampert JB, Barlow CE, Nichaman MZ, Gibbons LW, Paffenbarger RS, Jr, et al. Relationship between low cardiorespiratory fitness and mortality in normal-weight, overweight, and obese men. JAMA. 1999;282:1547–1553. doi: 10.1001/jama.282.16.1547. [DOI] [PubMed] [Google Scholar]
- 8.Hu G, Tuomilehto J, Silventoinen K, Barengo NC, Peltonen M, Jousilahti P. The effects of physical activity and body mass index on cardiovascular, cancer and all-cause mortality among 47 212 middle-aged Finnish men and women. Int J Obes (Lond) 2005;29:894–902. doi: 10.1038/sj.ijo.0802870. [DOI] [PubMed] [Google Scholar]
- 9.Sui X, LaMonte MJ, Laditka JN, Hardin JW, Chase N, Hooker SP, et al. Cardiorespiratory fitness and adiposity as mortality predictors in older adults. JAMA. 2007;298:2507–2516. doi: 10.1001/jama.298.21.2507. [DOI] [PMC free article] [PubMed] [Google Scholar]
- 10.Rantanen T, Volpato S, Ferrucci L, Heikkinen E, Fried LP, Guralnik JM. Handgrip strength and cause-specific and total mortality in older disabled women: exploring the mechanism. J Am Geriatr Soc. 2003;51:636–641. doi: 10.1034/j.1600-0579.2003.00207.x. [DOI] [PubMed] [Google Scholar]
- 11.Ruiz JR, Sui X, Lobelo F, Morrow JR, Jr, Jackson AW, Sjostrom M, et al. Association between muscular strength and mortality in men: prospective cohort study. BMJ. 2008;337:a439. doi: 10.1136/bmj.a439. [DOI] [PMC free article] [PubMed] [Google Scholar]
- 12.Metter EJ, Talbot LA, Schrager M, Conwit R. Skeletal muscle strength as a predictor of all-cause mortality in healthy men. J Gerontol A Biol Sci Med Sci. 2002;57:B359–365. doi: 10.1093/gerona/57.10.b359. [DOI] [PubMed] [Google Scholar]
- 13.U.S. Department of Health and Human Services. 2008 Physical Activity Guidelines for Americans. 2008 [Google Scholar]
- 14.Rantanen T, Harris T, Leveille SG, Visser M, Foley D, Masaki K, et al. Muscle Strength and Body Mass Index as Long-Term Predictors of Mortality in Initially Healthy Men. J Gerontol A Biol Sci Med Sci. 2000;55A:M168–M173. doi: 10.1093/gerona/55.3.m168. [DOI] [PubMed] [Google Scholar]
- 15.Ruiz JR, Sui X, Lobelo F, Lee DC, Morrow JR, Jr, Jackson AW, et al. Muscular strength and adiposity as predictors of adulthood cancer mortality in men. Cancer Epidemiol Biomarkers Prev. 2009;18:1468–1476. doi: 10.1158/1055-9965.EPI-08-1075. [DOI] [PMC free article] [PubMed] [Google Scholar]
- 16.Aromaa A, Heliövaara M, Impivaara O, Knekt P, Maatela J, Joukamaa M, et al. Basic results from the Mini-Finland Health Survey. Vol. 32. Publications of the Social Insurance Institution AL; Helsinki and Turku: 1989. Health, functional limitations and need for care in Finland; p. 793. (In Finnish with an English summary: 525–554) [Google Scholar]
- 17.Lehtonen R, Kuusela V. Statistical Efficiency of the Mini-Finland Health Survey’s Sampling Desing (In Finnish, with English summary) Helsinki and Turku: Publications of the Social Insurance Institution ML; 1986. p. 65. [Google Scholar]
- 18.Heliövaara M, Mäkelä M, Knekt P, Impivaara O, Aromaa A. Determinants of sciatica and low-back pain. Spine. 1991;16:608–614. doi: 10.1097/00007632-199106000-00002. [DOI] [PubMed] [Google Scholar]
- 19.National Institutes of Health, National Heart L, and Blood Institute. The Practical Guide. Identification, Evaluation, and Treatment of Overweight and Obesity in Adults. 2000 NIH Publication No. 00-4084. [Google Scholar]
- 20.Lauretani F, Russo C, Bandinelli S, Bartali B, Cavazzini C, Di Iorio A, et al. Age-associated changes in skeletal muscles and their effect on mobility: an operational diagnosis of sarcopenia. J Appl Physiol. 2003;95:1851–1860. doi: 10.1152/japplphysiol.00246.2003. [DOI] [PubMed] [Google Scholar]
- 21.Rantanen T, Era P, Kauppinen M, Heikkinen E. Maximal isometric muscle strength and socioeconomic status, health, and physical activity in 75-year-old persons. Journal of Aging and Physical Activity. 1994;2:206–220. [Google Scholar]
- 22.Mälkiä E. Muscular performance as a determinant of physical ability in Finnish adult population. Vol. 23. Publications of the Social Insurance Institution AL; Turku: 1983. p. 148. (In Finnish with an English summary: 119–12. [Google Scholar]
- 23.Sanchez-Craig M, Wilkinson DA, Davila R. Empirically based guidelines for moderate drinking: 1-year results from three studies with problem drinkers. Am J Public Health. 1995;85:823–828. doi: 10.2105/ajph.85.6.823. [DOI] [PMC free article] [PubMed] [Google Scholar]
- 24.Mäkelä M, Heliövaara M, Sievers K, Impivaara O, Knekt P, Aromaa A. Prevalence, determinants, and consequences of chronic neck pain in Finland. Am J Epidemiol. 1991;134:1356–1367. doi: 10.1093/oxfordjournals.aje.a116038. [DOI] [PubMed] [Google Scholar]
- 25.Ajani UA, Lotufo PA, Gaziano JM, Lee IM, Spelsberg A, Buring JE, et al. Body mass index and mortality among US male physicians. Ann Epidemiol. 2004;14:731–739. doi: 10.1016/j.annepidem.2003.10.008. [DOI] [PubMed] [Google Scholar]
- 26.Corrada MM, Kawas CH, Mozaffar F, Paganini-Hill A. Association of Body Mass Index and Weight Change with All-Cause Mortality in the Elderly. Am J Epidemiol. 2006;163:938–949. doi: 10.1093/aje/kwj114. [DOI] [PMC free article] [PubMed] [Google Scholar]
- 27.Janssen I, Mark AE. Elevated body mass index and mortality risk in the elderly. Obesity Reviews. 2007;8:41–59. doi: 10.1111/j.1467-789X.2006.00248.x. [DOI] [PubMed] [Google Scholar]
- 28.Kuk JL, Ardern CI. Influence of age on the association between various measures of obesity and all-cause mortality. J Am Geriatr Soc. 2009;57:2077–2084. doi: 10.1111/j.1532-5415.2009.02486.x. [DOI] [PubMed] [Google Scholar]
- 29.Stevens J, Cai J, Pamuk ER, Williamson DF, Thun MJ, Wood JL. The effect of age on the association between body-mass index and mortality. N Engl J Med. 1998;338:1–7. doi: 10.1056/NEJM199801013380101. [DOI] [PubMed] [Google Scholar]
- 30.Janssen I, Katzmarzyk PT, Ross R. Body mass index is inversely related to mortality in older people after adjustment for waist circumference. J Am Geriatr Soc. 2005;53:2112–2118. doi: 10.1111/j.1532-5415.2005.00505.x. [DOI] [PubMed] [Google Scholar]
- 31.Oreopoulos A, Kalantar-Zadeh K, Sharma AM, Fonarow GC. The obesity paradox in the elderly: potential mechanisms and clinical implications. Clin Geriatr Med. 2009;25:643–659. viii. doi: 10.1016/j.cger.2009.07.005. [DOI] [PubMed] [Google Scholar]
- 32.Ferreira I, Stehouwer CD. Obesity paradox or inappropriate study designs? Time for life-course epidemiology. J Hypertens. 2012;30:2271–2275. doi: 10.1097/HJH.0b013e32835b4fe0. [DOI] [PubMed] [Google Scholar]
- 33.Masters RK, Powers DA, Link BG. Obesity and US Mortality Risk Over the Adult Life Course. Am J Epidemiol. 2013;177:431–442. doi: 10.1093/aje/kws325. [DOI] [PMC free article] [PubMed] [Google Scholar]
- 34.Zamboni M, Mazzali G, Zoico E, Harris TB, Meigs JB, Di Francesco V, et al. Health consequences of obesity in the elderly: a review of four unresolved questions. Int J Obes (Lond) 2005;29:1011–1029. doi: 10.1038/sj.ijo.0803005. [DOI] [PubMed] [Google Scholar]
- 35.Hardy R, Kuh D. Commentary: BMI and mortality in the elderly--a life course perspective. Int J Epidemiol. 2006;35:179–180. doi: 10.1093/ije/dyi302. [DOI] [PubMed] [Google Scholar]
- 36.Preston SH, Mehta NK, Stokes A. Modeling Obesity Histories in Cohort Analyses of Health and Mortality. Epidemiology. 2013;24:158–166. doi: 10.1097/EDE.0b013e3182770217. [DOI] [PMC free article] [PubMed] [Google Scholar]
- 37.Newman AB, Kupelian V, Visser M, Simonsick EM, Goodpaster BH, Kritchevsky SB, et al. Strength, but not muscle mass, is associated with mortality in the health, aging and body composition study cohort. Journal of Gerontology: Biol Sci Med Sci. 2006;61A:M72–M77. doi: 10.1093/gerona/61.1.72. [DOI] [PubMed] [Google Scholar]
- 38.Cesari M, Pahor M, Lauretani F, Zamboni V, Bandinelli S, Bernabei R, et al. Skeletal muscle and mortality results from the InCHIANTI Study. J Gerontol A Biol Sci Med Sci. 2009;64:377–384. doi: 10.1093/gerona/gln031. [DOI] [PMC free article] [PubMed] [Google Scholar]
- 39.Barzilay JI, Cotsonis GA, Walston J, Schwartz AV, Satterfield S, Miljkovic I, et al. Insulin resistance is associated with decreased quadriceps muscle strength in nondiabetic adults aged >or=70 years. Diabetes Care. 2009;32:736–738. doi: 10.2337/dc08-1781. [DOI] [PMC free article] [PubMed] [Google Scholar]
- 40.Stenholm S, Maggio M, Lauretani F, Bandinelli S, Ceda G, Di Iorio A, et al. Anabolic and Catabolic Biomarkers As Predictors of Muscle Strength Decline: The InCHIANTI Study. Rejuvenation Res. 2010;13:3–11. doi: 10.1089/rej.2009.0891. [DOI] [PMC free article] [PubMed] [Google Scholar]
- 41.Valenti G, Denti L, Maggio M, Ceda G, Volpato S, Bandinelli S, et al. Effect of DHEAS on skeletal muscle over the life span: the InCHIANTI study. J Gerontol A Biol Sci Med Sci. 2004;59:466–472. doi: 10.1093/gerona/59.5.m466. [DOI] [PubMed] [Google Scholar]
- 42.Cappola AR, Bandeen-Roche K, Wand GS, Volpato S, Fried LP. Association of IGF-I levels with muscle strength and mobility in older women. J Clin Endocrinol Metab. 2001;86:4139–4146. doi: 10.1210/jcem.86.9.7868. [DOI] [PubMed] [Google Scholar]
- 43.Sabia S, Dugravot A, Kivimäki M, Brunner E, Shipley MJ, Singh-Manoux A. Effect of intensity and type of physical activity on mortality: results from the Whitehall II cohort study. Am J Public Health. 2012;102:698–704. doi: 10.2105/AJPH.2011.300257. [DOI] [PMC free article] [PubMed] [Google Scholar]
- 44.Rantanen T, Guralnik JM, Foley D, Masaki K, Leveille S, Curb JD, et al. Midlife hand grip strength as a predictor of old age disability. JAMA. 1999;281:558–560. doi: 10.1001/jama.281.6.558. [DOI] [PubMed] [Google Scholar]
- 45.Sallinen J, Stenholm S, Rantanen T, Heliovaara M, Sainio P, Koskinen S. Hand-grip strength cut points to screen older persons at risk for mobility limitation. J Am Geriatr Soc. 2010;58:1721–1726. doi: 10.1111/j.1532-5415.2010.03035.x. [DOI] [PMC free article] [PubMed] [Google Scholar]
- 46.Liu CJ, Latham NK. Progressive resistance strength training for improving physical function in older adults. Cochrane Database Syst Rev. 2009:CD002759. doi: 10.1002/14651858.CD002759.pub2. [DOI] [PMC free article] [PubMed] [Google Scholar]
- 47.Stenholm S, Rantanen T, Alanen E, Reunanen A, Sainio P, Koskinen S. Obesity History as a Predictor of Walking Limitation at Old Age. Obesity. 2007;15:929–938. doi: 10.1038/oby.2007.583. [DOI] [PubMed] [Google Scholar]
- 48.Mendes de Leon CF, Hansberry MR, Bienias JL, Morris MC, Evans DA. Relative weight and mobility: a longitudinal study in a biracial population of older adults. Ann Epidemiol. 2006;16:770–776. doi: 10.1016/j.annepidem.2006.05.002. [DOI] [PubMed] [Google Scholar]
- 49.Miller SL, Wolfe RR. The danger of weight loss in the elderly. J Nutr Health Aging. 2008;12:487–491. doi: 10.1007/BF02982710. [DOI] [PubMed] [Google Scholar]
- 50.Freedman DM, Sigurdson AJ, Rajaraman P, Doody MM, Linet MS, Ron E. The mortality risk of smoking and obesity combined. Am J Prev Med. 2006;31:355–362. doi: 10.1016/j.amepre.2006.07.022. [DOI] [PubMed] [Google Scholar]
Associated Data
This section collects any data citations, data availability statements, or supplementary materials included in this article.