Abstract
Objective
Research of electroencephalograph (EEG) power spectrum and mean frequency has shown inconsistent results in patients with schizophrenic, schizoaffective and bipolar disorders during medication when compared to normal subjects thus; the characterization of these parameters is an important task.
Methods
We applied quantitative EEG (qEEG) to investigate 38 control, 15 schizophrenic, 7 schizoaffective and 11 bipolar disorder subjects which remaine under the administration of psychotropic drugs (except control group). Absolute spectral power (ASP), mean frequency and hemispheric electrical asymmetry were measured by 19 derivation qEEG. Group mean values were compared with non parametrical Mann-Whitney test and spectral EEG maps with z-score method at p < 0.05.
Results
Most frequent drug treatments for schizophrenic patients were neuroleptic+antiepileptic (40% of cases) or 2 neuroleptics (33.3%). Schizoaffective patients received neuroleptic+benzodiazepine (71.4%) and for bipolar disorder patients neuroleptic+antiepileptic (81.8%). Schizophrenic (at all derivations except for Fp1, Fp2, F8 and T6) and schizoaffective (only at C3) show higher values of ASP (+57.7% and +86.1% respectively) compared to control group. ASP of bipolar disorder patients did not show differences against control group. The mean frequency was higher at Fp1 (+14.2%) and Fp2 (+17.4%) in bipolar disorder patients than control group, but no differences were found in frequencies between schizophrenic or schizoaffective patients against the control group. Majority of spectral differences were found at the left hemisphere in schizophrenic and schizoaffective but not in bipolar disorder subjects.
Conclusion
The present report contributes to characterize quantitatively the qEEG in drug treated schizophrenic, schizoaffective or bipolar disorder patients.
Keywords: Schizophrenia, Schizoaffective disorder, Bipolar disorder, Fourier analysis, Psychotropic drugs
INTRODUCTION
Electroencephalograph (EEG) test applied in psychiatric illness allows to diagnose from organic diseases,1) but its use as a biomarker for diagnosis, prognosis and treatment in psychiatric disease remains unclear, specially for patients under medication. About 30% of hospitalized psychotic patients had EEG abnormalities located at temporal lobes2) or with epileptiform EEG abnormalities in about 2.6% of cases.3) Manic patients have been reported to display abnormal EEG in few cases.4) Several EEG studies have been conducted in schizophrenia5) reporting increased beta, low power at slow frequency and reduced main alpha power, but other reports did not show the same results6) starting a denoted controversy about EEG alterations in schizophrenia.7)
An important neuropharmacological and ethical factor in the study of psychiatric diseases is the effects of medications during the EEG test due to the potential induction of trace alterations1,4,8,9); however, quantitative EEG (qEEG) has been used to identify these changes in patients during treatment,10) to study cognitive and brain functions11) and for drug response evaluation.12) Some studies in schizophrenic patients reported decrease in delta,13,14,15) theta or alpha14) activities after neuroleptics administration. In contrast, increase of delta,9,16) theta9,15) or alpha15,16) activities have been also reported during neuroleptics administration. qEEG showed an increase of theta activity after neuroleptic administration in patients with schizophenia15) but was not confirmed.14) EEG changes in schizoaffective and bipolar disorders are even more confusing.1,4,17,18) Thus, the effects of psychotropic medication on EEG patterns in psychiatric patients are still controversial, even in our environment where schizophrenia, schizoaffective and bipolar disorders are the most frequent hospitalization cause.
The effects of medication in addition to specific psychiatric disease on EEG patterns are relevant issues and need to be clarified due to the high frequency of EEG evaluation in these patients. Many patients receive more than one drug and it is not always ethical to achieve drug washout for an EEG study. All these facts cause confusion in the interpretation of EEG patterns in these patients. The use of the power spectrum such as a qEEG parameter could help to clarify these patterns.
METHODS
Patients of any gender with age above eighteen from the database of the Department of Electroencephalography at the Psychiatric Hospital "Dr. José Ortega Durán" treated from January 2009 until September 2010 with no more than 2 years from the diagnosis of schizophrenia, schizoaffective or bipolar disorders were included in our study. All patients fulfilled the International Statistical Classification of Diseases and Related Health Problems (ICD)19) criteria for schizophrenia, schizoaffective or bipolar disorder, at least 2 psychiatrists confirmed the diagnoses. The study was authorized by the Hospital Bioethics Committee. qEEG traces from all psychiatric patients were obtained while undergoing conventional treatment with antipsychotics, benzodiazepines or anticonvulsants. Patients were not routinely screened for illicit drugs. Inclusion criteria for the control group patients were age above eighteen, without history of mental illness, without medication and a normal EEG trace. Most of these control patients were referred by general practitioners as a part of a general medical evaluation.
Recordings of qEEG were performed between 8:00 and 10:00 hours without drug washout. The last medication was given the night before the study. In an electrical and sound shielded recording environment, monopolar 19 leads (ear reference) and 10-20 electrode system were used. EEG signals (30 minutes total recording time) were recorded amplified, filtered (anti-aliasing; low pass at 0.5 Hz; high pass at 100 Hz; notch on) and digitized at a sampling rate of 1 kHz, with ≥20 MΩ input impedance, 1,200±3% amplification, 16 bits (0.06 µV/bit) of vertical resolution, common rejection mode >80 dB for all channels, overall noise <4 µV peak to peak and patient bias current typically 300 pA. Amplifiers were calibrated with 500 µV peak to peak at 5 Hz and 50 µV peak to peak at 0.1 Hz (Medicid4™; Neuronic SA, La Habana, Cuba) to perform the fast Fourier transformation (FFT) at 0.1 Hz resolution in artifact-free traces. ASP (µV2.Hz-1) was computed every 30 seconds for the spectral band from 0 to 100 Hz, which delivered the total amount of information, i.e., cumulated power from every 0.1 Hz step contained at 0 to 100 Hz frequency band.1,11,18) Special effort was made to mark and to exclude EEG artifacts, i.e., electro-oculograph and blinking. EEG processing during closed eyes included frequency analysis and differential frequency brain maps generated using 8 sectors weighed nearest neighbor algorithm20) where the closest data point in each octant is found. The intersection is set to the average of these points weighed by 1× distance from grid intersection-2.
Frequency and ASP comparisons were evaluated with the distribution free Mann-Whitney U-test. EEG frequency and ASP maps were compared by z-score method where map value differences (point to point) are presented such as z values being z>1.96 statistically significant at p<0.05. Hemispheric asymmetries were evaluated comparing group spectral power and frequency mean values at each EEG derivation between brain hemispheres by Mann-Whitney U test. Significance was set at to p values less than 0.05.
RESULTS
Patient Groups
A total of 71 patients were recruited in the present study, control group (n=38), schizophrenic patients (n=15), schizoaffective patients (n=7) and bipolar disorder patients (n=11) whose gender, age and disease duration are presented in Table 1. No significant differences between groups were found for age and disease duration. Most of the schizophrenic and schizoaffective patients displayed negative symptoms at the moment of the EEG test.
Table 1.
Clinical characteristics for each patient group
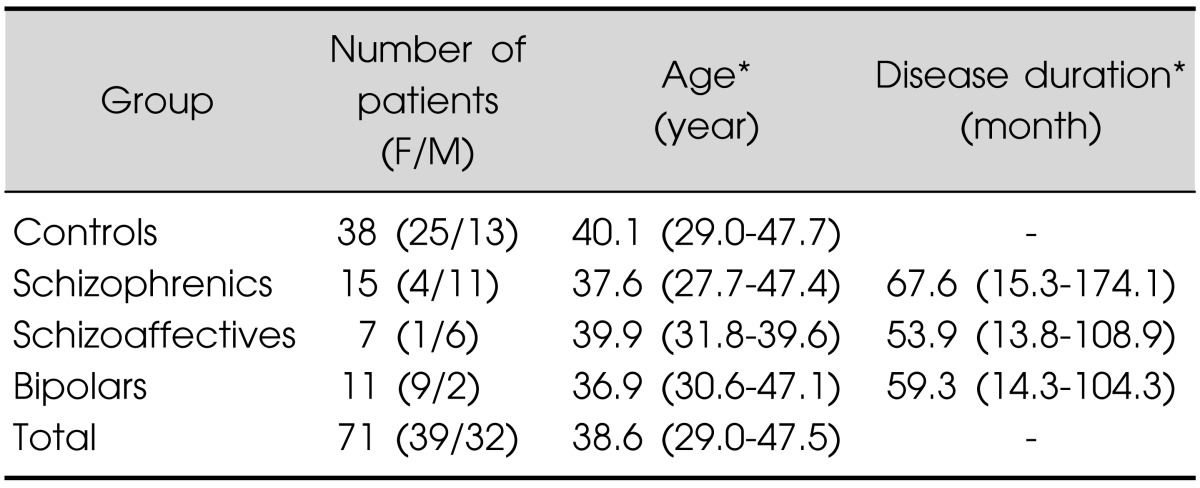
F, female; M, male. *Median (percentile 25-75).
Patient Treatments
Treatment for each patient group is presented in Table 2, a combination of two drugs was administrated. For the schizophrenia patients the most frequent treatment was the combination of a neuroleptic with and antiepileptic (40% of the cases) or the combination of 2 neuroleptics (33.3%). Of the schizoaffective patients group, 71.4% received the combination of a neuroleptic with a benzodiazepine. A neuroleptic with an antiepileptic was the most frequent drug combination (81.8%) for the bipolar disorder patients. Specific drugs used for each patient group are presented in Table 3. Most used neuroleptics for schizophrenia patients were olanzapine (25%) and quetiapine (25%), this drug was the most used in schizoaffective patients (42.9%) and in bipolar disorder patients (70%). Valproate was the most used antiepileptic drug for schizophrenic (40%) and bipolar disorder (41.7%) patients. In the schizoaffective patient group clonazepam was the most used benzodiazepine (42.9%) and carbamazepine the most used antiepileptic (28.6%).
Table 2.
Drug therapy received by patient groups
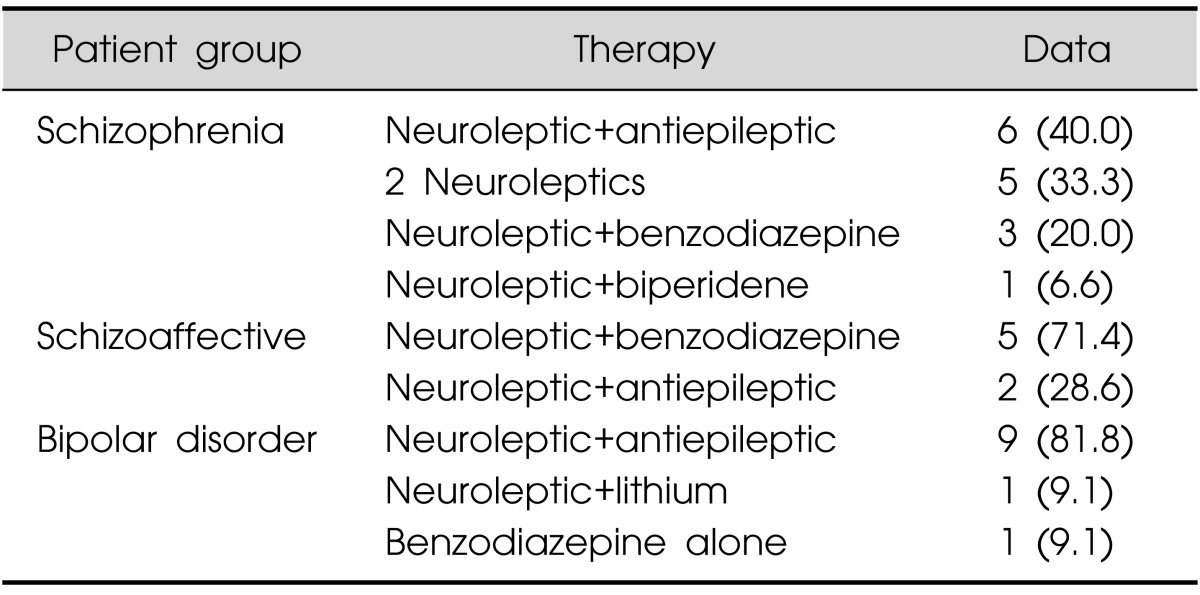
Values are presented as number (%).
Percentage referred to the group.
Table 3.
Specific drug used by each patient groups
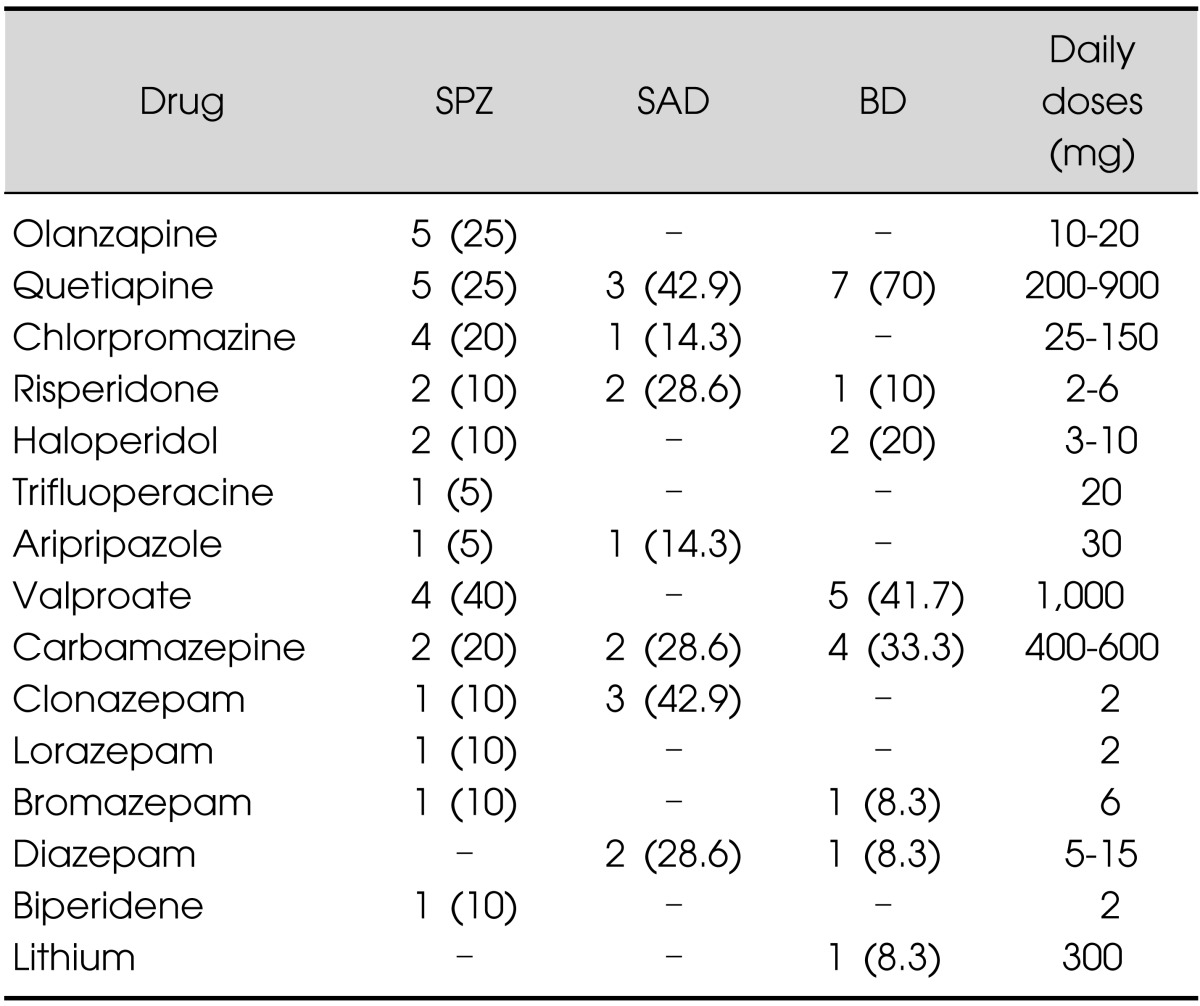
Upper panel corresponds to neuroleptics and lower panel other drug groups.
Percentage values in parenthesis are referred to the drug group.
SPZ, schizophrenia; SAD, schizoaffective disorder; BD, bipolar disorder.
EEG ASP between Patient Groups
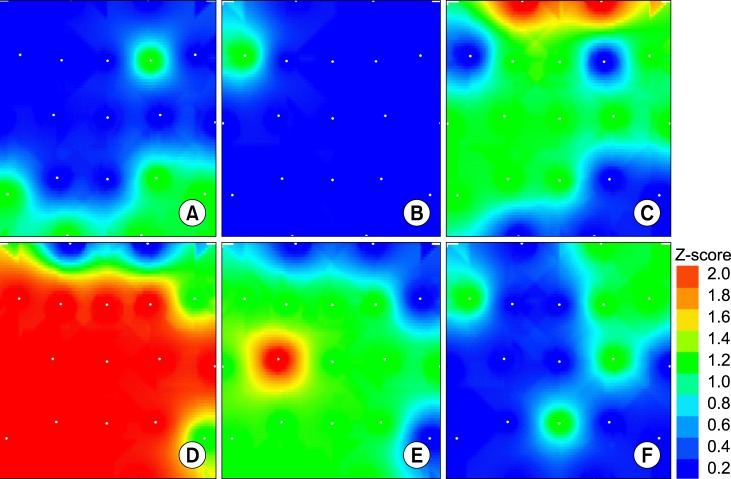
Fig. 1 presents the EEG ASP map from a typical control subject (A) and a schizophrenic patient (B) denoting the increased power values of the last one. The mean values of the ASP in the schizophrenic patient group were significant higher (p<0.05) than those of control patients for all derivations except for Fp1, Fp2, F8 and T6 with a 57.7±16.3% (mean±standard deviation) increased values. The significance, intensity and scalp distribution of these spectral power differences vs. control subjects are expressed by the z-score map (Fig. 2D). In contrast, the schizoaffective patients showed statistical differences in this parameter compared with control subjects only at C3 derivation with an 86.1±18.1% of increased value (Fig. 2E). ASP of the bipolar patients was not statistically different than that of control subjects (Fig. 2F).
Fig. 1.
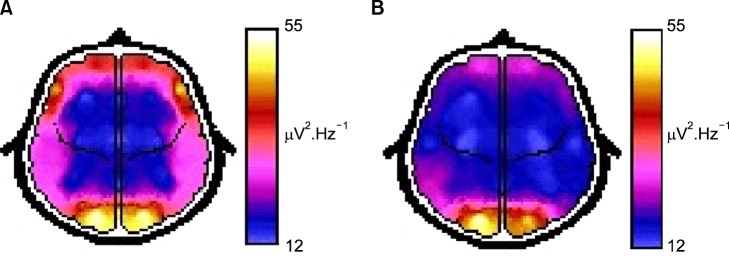
Representative mean absolute spectral power brain maps from a control subject (A) and a schizophrenic patient (B) with an increased values.
Fig. 2.
Differential z-score brain maps between control group versus schizophrenic (A and D); schizoaffective (B and E) and bipolar disorder (C and F) patient groups, for frequency domain (upper panel) and absolute spectral power domain (lower panel). Red and orange colour areas are locations with statistical significance (z>1.56 and p<0.05). White points represent recording electrode locations on a vertex projection with the frontal pole up and left-right as seen on vertex projection.
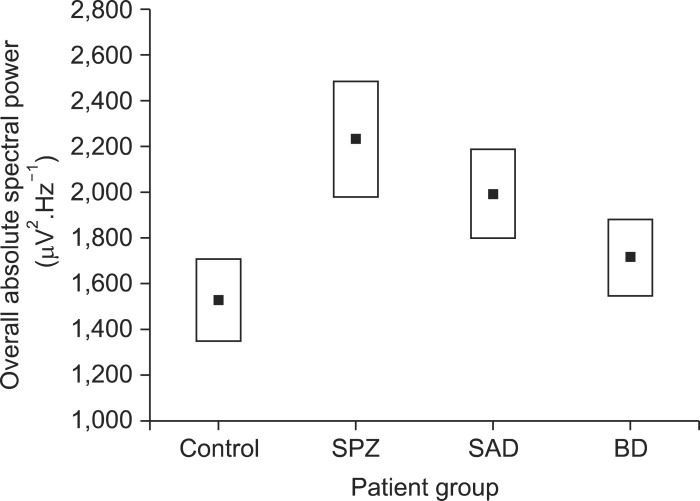
ASP of all derivations were added for all patients within each group to obtain the overall ASP value. Schizophrenic patients displayed significantly higher values (2,231.2±1,092.0 µV2.Hz.-1) than control subjects (1,528.1±782.1 µV2.Hz-1; p<0.03; t=2.28) which represented a 46% of increased power (Fig. 3). Despite that the ASP values show the tendency to be lower for schizoaffective and even lower for bipolar disorder patients, both values were not statistically significant (Fig. 3).
Fig. 3.
Overall absolute spectral power from each patient group, Values are mean±standard error. Difference between control and schizophrenic groups was statistically different (p<0.03).
SPZ, schizophrenia; SAD, schizoaffective disorder; BD, bipolar disorder.
The schizophrenic patients did not show statistical differences in ASP when compared to schizoaffective patients. The schizophrenic subjects showed statistical differences in ASP EEG compared with bipolar disorder patients only at O2 EEG derivation.
EEG Frequency between Patient Groups
The control subjects showed no statistical differences in mean frequency EEG compared to neither schizophrenic (Fig. 2A) nor schizoaffective patients (Fig. 2B), but showed statistical significant lower frequency compared to bipolar disorder patients at Fp1 (5.43±1.35 vs. 6.20±0.81 Hz; M-W U=122.5; p=0.04) and Fp2 (5.51±1.34 Hz vs. 6.47±0.71 Hz; M-W U=116.0; p=0.03) see Fig. 2C, which represents a -14.2% and -17.4% lower values respectively.
The schizophrenic subjects showed no statistical differences in mean frequency EEG compared to schizoaffective patients, but show statistically significant lower frequencies (mean -10.62%) at F3, C3, P3, P4, T4, T5, T6, FZ (M-W U=38 to 44; p<0.04) than bipolar disorder patients.
Pharmacological Treatment and EEG Frequency and ASP
No statistically significant differences were found neither between EEG frequencies nor ASP at any EEG derivation when compared groups of patients under combinations of neuroleptic+antiepileptic vs. 2 neuroleptics or neuroleptic+antiepileptic vs. neuroleptic+benzodiazepine, nor 2 neuroleptics vs. neuroleptic+benzodiazepine (p>0.5 for all comparisons, M-W U-test).
Hemispheric Differences between Patient Groups
Interhemispheric differences in mean ASP and mean frequency from patients within the same group and between groups were further analyzed, and no statistically significant hemispheric asymmetries were found neither in the control, schizophrenic, schizoaffective nor bipolar disorder patient groups. But when patient group maps are compared to control subjects (Fig. 2D, 2E) most significant differences are seen at left derivations for schizophrenic and schizoaffective patients but not found for bipolar disorder patients.
DISCUSSION
The present study aimed to identify patterns of qEEG in schizophrenic, schizoaffective and bipolar disorder patients under conventional combined psychotropic drug treatment. This scenario is frequent in clinical practice and raises issues about the theoretical pure test condition where the washout of pharmacological treatment should be done 24 to 72 hours before EEG test. In this study, we characterized the qEEG patterns in patients receiving drug combination treatment (without drug washout). At this respect, qEEG slow waves excess (delta and theta) considered a robust organic sign of schizophrenia, have been found in medicated as well as in non medicated patients.6,21)
The risk of EEG abnormalities induced by antipsychotic medication has been shown to be drug specific,22) being those used in the present study of low (quetiapine 0%), moderate (risperidone 28%) and even high for olanzapine, that shows a risk lower than 39% of the cases.22,23,24) When present, EEG abnormality induced by neuroleptics shows an attenuation of beta frequency power25,26) but this contrasts to another report where the influence of conventional antipsychotics on the EEG spectral power showed to be rather minimal.27) Consistent with this report, risperidone has rarely been associated with severe EEG abnormalities.22,28,29) In the cases evaluated here we did not find significant differences neither in frequency nor in ASP among two drug combination of antipsychotics, benzodiazepines or anticonvulsants, thus it is suggested that the differences reported between control and psychiatric subjects are mainly induced by the specific disease, i.e., schizophrenia, schizoaffective or bipolar disorders and less by the pharmacological treatment, this contrast to a previous report were qEEG differences were explained partially in terms of the psychotropic drug treatment and not of the specific psychiatric disease.30)
The benzodiazepines have been reported to induce some EEG abnormalities probably due to their anticonvulsant effect, tendency to suppress epileptiform activity and induction of EEG slowing.31,32,33) However, in the present report, despite that benzodiazepines were administrated to 20% of the schizophrenic, 71.4% of schizoaffective and 9.1% of bipolar disorder patients, we did not find (by far) any EEG frequency differences between these patient groups and control subjects.
Mean frequency values between 4.0-7.5 Hz found in control, schizophrenic and schizoaffective groups did not show statistical differences among them for all EEG derivations, and are within the frequency range reported in previous studies.7)
Augmented low-frequency EEG power had been associated to schizophrenia patients with negative symptoms,34) regarding this, the vast majority of psychotic patients evaluated in the present study did not show positive signs at the moment of the EEG test. Some authors reported that EEG power is reduced in schizophrenic patients compared to the control subjects.35) Taken together; this contrasting result could be the product of different cortical electrical states associated to the presence of positive or negative psychotic symptoms. Additionally, the ASP value used in the present study does not express the power of a specific EEG rhythm, instead is an overall power, i.e., integral of all bands α, β, δ and θ within the wide range from 0 to 100 Hz thus, overall basal power increases could enclose changes in specific rhythms, and could be associated to the severity of the psychiatric disease as is suggested by the data presented on Fig. 3 and deserves further investigation.
The data of our study suggests left hemispheric asymmetries in schizophrenic and schizoaffective patients when compared to control subjects, which agrees with results from other qEEG studies36,37) and with methods with higher spatial resolution like functional magnetic resonance imaging.18)
The present report contributes to clarify the EEG patterns associated to patients with psychiatric diseases under the most frequent drug medication and their combinations.
Acknowledgments
Thanks to Mrs. Eloina González Ochoa from Medical record service of the Hospital Dr. José Ortega Durán for valuable help, and to Dr. Virginia Vivas-O'Connor for critical reading of the manuscript.
References
- 1.Niedermeyer E, DaSilva FHL. Electroencephalography: basic principles, clinical applications, and related fields. 3rd ed. Baltimore: Williams & Wilkins; 1993. pp. 235–251. [Google Scholar]
- 2.Stevens JR, Bigelow L, Denney D, Lipkin J, Livermore AH, Jr, Rauscher F, et al. Telemetered EEG-EOG during psychotic behaviors of schizophrenia. Arch Gen Psychiatry. 1979;36:251–262. doi: 10.1001/archpsyc.1979.01780030017001. [DOI] [PubMed] [Google Scholar]
- 3.Bridgers SL. Epileptiform abnormalities discovered on electroencephalographic screening of psychiatric inpatients. Arch Neurol. 1987;44:312–316. doi: 10.1001/archneur.1987.00520150056022. [DOI] [PubMed] [Google Scholar]
- 4.Small JG, Milstein V, Malloy FW, Medlock CE, Klapper MH. Clinical and quantitative EEG studies of mania. J Affect Disord. 1999;53:217–224. doi: 10.1016/s0165-0327(98)00124-4. [DOI] [PubMed] [Google Scholar]
- 5.Nunez PL, Cutillo BA. Neocortical dynamics and human EEG rhythms. New York: Oxford University Press; 1995. pp. 123–145. [Google Scholar]
- 6.John ER, Prichep LS, Alper KR, Mas FG, Cancro R, Easton P, et al. Quantitative electrophysiological characteristics and subtyping of schizophrenia. Biol Psychiatry. 1994;36:801–826. doi: 10.1016/0006-3223(94)90592-4. [DOI] [PubMed] [Google Scholar]
- 7.Galderisi S, Mucci A, Volpe U, Boutros N. Evidence-based medicine and electrophysiology in schizophrenia. Clin EEG Neurosci. 2009;40:62–77. doi: 10.1177/155005940904000206. [DOI] [PubMed] [Google Scholar]
- 8.Begić D, Hotujac L, Jokić-Begić N. Quantitative EEG in 'positive' and 'negative' schizophrenia. Acta Psychiatr Scand. 2000;101:307–311. [PubMed] [Google Scholar]
- 9.Small JG, Milstein V, Small IF, Miller MJ, Kellams JJ, Corsaro CJ. Computerized EEG profiles of haloperidol, chlorpromazine, clozapine and placebo in treatment resistant schizophrenia. Clin Electroencephalogr. 1987;18:124–135. [PubMed] [Google Scholar]
- 10.Hunter AM, Leuchter AF, Morgan ML, Cook IA. Changes in brain function (quantitative EEG cordance) during placebo lead-in and treatment outcomes in clinical trials for major depression. Am J Psychiatry. 2006;163:1426–1432. doi: 10.1176/ajp.2006.163.8.1426. [DOI] [PubMed] [Google Scholar]
- 11.van der Stelt O, Belger A. Application of electroencephalography to the study of cognitive and brain functions in schizophrenia. Schizophr Bull. 2007;33:955–970. doi: 10.1093/schbul/sbm016. [DOI] [PMC free article] [PubMed] [Google Scholar]
- 12.Kikuchi M, Wada Y, Higashima M, Nagasawa T, Takeda T, Koshino Y. Individual analysis of EEG band power and clinical drug response in schizophrenia. Neuropsychobiology. 2005;51:183–190. doi: 10.1159/000085593. [DOI] [PubMed] [Google Scholar]
- 13.Begić D, Hotujac L, Jokić-Begić N. Quantitative EEG in schizophrenic patients before and during pharmacotherapy. Neuropsychobiology. 2000;41:166–170. doi: 10.1159/000026650. [DOI] [PubMed] [Google Scholar]
- 14.Nagase Y, Okubo Y, Toru M. Electroencephalography in schizophrenic patients: comparison between neuroleptic-naive state and after treatment. Biol Psychiatry. 1996;40:452–456. doi: 10.1016/0006-3223(96)00304-6. [DOI] [PubMed] [Google Scholar]
- 15.Kemali D, Galderisi S, Maj M, Mucci A, Di Gregorio M, Bucci P. Computerized EEG topography findings in schizophrenic patients before and after haloperidol treatment. Int J Psychophysiol. 1992;13:283–290. doi: 10.1016/0167-8760(92)90078-p. [DOI] [PubMed] [Google Scholar]
- 16.Saletu B, Küfferle B, Anderer P, Grünberger J, Steinberger K. EEG-brain mapping in schizophrenics with predominantly positive and negative symptoms. Comparative studies with remoxipride/haloperidol. Eur Neuropsychopharmacol. 1990;1:27–36. doi: 10.1016/0924-977x(90)90007-w. [DOI] [PubMed] [Google Scholar]
- 17.Miller A, Fox NA, Cohn JF, Forbes EE, Sherrill JT, Kovacs M. Regional patterns of brain activity in adults with a history of childhood-onset depression: gender differences and clinical variability. Am J Psychiatry. 2002;159:934–940. doi: 10.1176/appi.ajp.159.6.934. [DOI] [PubMed] [Google Scholar]
- 18.Li Y, Tong S, Liu D, Gai Y, Wang X, Wang J, et al. Abnormal EEG complexity in patients with schizophrenia and depression. Clin Neurophysiol. 2008;119:1232–1241. doi: 10.1016/j.clinph.2008.01.104. [DOI] [PubMed] [Google Scholar]
- 19.World Health Organization. International Statistical Classification of Diseases and Related Health Problems (ICD) 10th Revision, Volume 2, Instruction Manual. Geneva: WHO; 2010. [Google Scholar]
- 20.Coulthard J. QuikGrid 3-D rendering of a surface represented by scattered data points, V5.4. 2009. [cited Jan 21, 2012]. Available from http://www.galiander.ca/quikgrid/index.html.
- 21.Boutros NN, Arfken C, Galderisi S, Warrick J, Pratt G, Iacono W. The status of spectral EEG abnormality as a diagnostic test for schizophrenia. Schizophr Res. 2008;99:225–237. doi: 10.1016/j.schres.2007.11.020. [DOI] [PMC free article] [PubMed] [Google Scholar]
- 22.Centorrino F, Price BH, Tuttle M, Bahk WM, Hennen J, Albert MJ, et al. EEG abnormalities during treatment with typical and atypical antipsychotics. Am J Psychiatry. 2002;159:109–115. doi: 10.1176/appi.ajp.159.1.109. [DOI] [PubMed] [Google Scholar]
- 23.Beasley CM, Jr, Tollefson GD, Tran PV. Safety of olanzapine. J Clin Psychiatry. 1997;58(Suppl 10):13–17. [PubMed] [Google Scholar]
- 24.Wyderski RJ, Starrett WG, Abou-Saif A. Fatal status epilepticus associated with olanzapine therapy. Ann Pharmacother. 1999;33:787–789. doi: 10.1345/aph.18399. [DOI] [PubMed] [Google Scholar]
- 25.Guenther W, Davous P, Godet JL, Guillibert E, Breitling D, Rondot P. Bilateral brain dysfunction during motor activation in type II schizophrenia measured by EEG mapping. Biol Psychiatry. 1988;23:295–311. doi: 10.1016/0006-3223(88)90040-6. [DOI] [PubMed] [Google Scholar]
- 26.Itil TM, Saletu B, Davis S. EEG findings in chronic schizophrenics based on digital computer period analysis and analog power spectra. Biol Psychiatry. 1972;5:1–13. [PubMed] [Google Scholar]
- 27.Joutsiniemi SL, Gross A, Appelberg B. Marked clozapine-induced slowing of EEG background over frontal, central, and parietal scalp areas in schizophrenic patients. J Clin Neurophysiol. 2001;18:9–13. doi: 10.1097/00004691-200101000-00003. [DOI] [PubMed] [Google Scholar]
- 28.Umbricht D, Kane JM. Medical complications of new antipsychotic drugs. Schizophr Bull. 1996;22:475–483. doi: 10.1093/schbul/22.3.475. [DOI] [PubMed] [Google Scholar]
- 29.Czobor P, Volavka J. Quantitative electroencephalogram examination of effects of risperidone in schizophrenic patients. J Clin Psychopharmacol. 1993;13:332–342. [PubMed] [Google Scholar]
- 30.Hyun J, Baik MJ, Kang UG. Effects of psychotropic drugs on quantitative EEG among patients with schizophrenia-spectrum disorders. Clin Psychopharmacol Neurosci. 2011;9:78–85. doi: 10.9758/cpn.2011.9.2.78. [DOI] [PMC free article] [PubMed] [Google Scholar]
- 31.Fink M. EEG and behavior: Association or dissociation in man? Integrative Psychiatry. 1993;9:108–113. [Google Scholar]
- 32.Baldessarini RJ. Drugs and the treatment of psychiatric disorders: depression and anxiety disorders. In: Goodman LS, Hardman JG, Limbird LE, Gilman AG, editors. Goodman & Gilman's the pharmacological basis of therapeutics. 10th ed. New York: McGraw-Hill; 2001. pp. 447–483. [Google Scholar]
- 33.Yamadera H, Kato M, Ueno T, Tsukahara Y, Okuma T. Pharmaco-EEG mapping of diazepam effects using different references and absolute and relative power. Pharmacopsychiatry. 1993;26:254–258. doi: 10.1055/s-2007-1014363. [DOI] [PubMed] [Google Scholar]
- 34.McCarley RW, Nakamura M, Shenton ME, Salisbury DF. Combining ERP and structural MRI information in first episode schizophrenia and bipolar disorder. Clin EEG Neurosci. 2008;39:57–60. doi: 10.1177/155005940803900206. [DOI] [PMC free article] [PubMed] [Google Scholar]
- 35.Sponheim SR, Clementz BA, Iacono WG, Beiser M. Clinical and biological concomitants of resting state EEG power abnormalities in schizophrenia. Biol Psychiatry. 2000;48:1088–1097. doi: 10.1016/s0006-3223(00)00907-0. [DOI] [PubMed] [Google Scholar]
- 36.Knyazeva MG, Jalili M, Meuli R, Hasler M, De Feo O, Do KQ. Alpha rhythm and hypofrontality in schizophrenia. Acta Psychiatr Scand. 2008;118:188–199. doi: 10.1111/j.1600-0447.2008.01227.x. [DOI] [PubMed] [Google Scholar]
- 37.Vuga M, Fox NA, Cohn JF, George CJ, Levenstein RM, Kovacs M. Long-term stability of frontal electroencephalographic asymmetry in adults with a history of depression and controls. Int J Psychophysiol. 2006;59:107–115. doi: 10.1016/j.ijpsycho.2005.02.008. [DOI] [PubMed] [Google Scholar]


