

Background: Biased agonism is an incompletely understood phenomenon describing the unequal activation of different signal transduction pathways by a G protein-coupled receptor (GPCR).
Results: A cell-free approach using GPCR-transducer fusion proteins (G-protein or β-arrestin) quantifies signaling in vitro to elucidate the molecular basis of biased agonism.
Conclusion: Differences in ligand-receptor-transducer coupling account for biased agonism in cells.
Significance: Biased agonism is a bona fide molecular property of GPCR ligands.
Keywords: Angiotensin II, Drug Discovery, G Protein-coupled Receptors (GPCR), Molecular Pharmacology, Signal Transduction
Abstract
The concept of “biased agonism” arises from the recognition that the ability of an agonist to induce a receptor-mediated response (i.e. “efficacy”) can differ across the multiple signal transduction pathways (e.g. G protein and β-arrestin (βarr)) emanating from a single GPCR. Despite the therapeutic promise of biased agonism, the molecular mechanism(s) whereby biased agonists selectively engage signaling pathways remain elusive. This is due in large part to the challenges associated with quantifying ligand efficacy in cells. To address this, we developed a cell-free approach to directly quantify the transducer-specific molecular efficacies of balanced and biased ligands for the angiotensin II type 1 receptor (AT1R), a prototypic GPCR. Specifically, we defined efficacy in allosteric terms, equating shifts in ligand affinity (i.e. KLo/KHi) at AT1R-Gq and AT1R-βarr2 fusion proteins with their respective molecular efficacies for activating Gq and βarr2. Consistent with ternary complex model predictions, transducer-specific molecular efficacies were strongly correlated with cellular efficacies for activating Gq and βarr2. Subsequent comparisons across transducers revealed that biased AT1R agonists possess biased molecular efficacies that were in strong agreement with the signaling bias observed in cellular assays. These findings not only represent the first measurements of the thermodynamic driving forces underlying differences in ligand efficacy between transducers but also support a molecular mechanism whereby divergent transducer-specific molecular efficacies generate biased agonism at a GPCR.
Introduction
G protein-coupled receptors (GPCRs),3 also known as 7 transmembrane spanning receptors or 7TMRs, are attractive therapeutic targets as they regulate the majority of physiological processes in humans by binding and transducing signals from a wide variety of endogenous and exogenous ligands. Ligands that bind and activate GPCRs, termed agonists, initiate highly conserved signaling and regulatory cascades. These are marked by receptor interactions with heterotrimeric G proteins which promote second messenger generation, G protein-coupled receptor kinases (GRKs) which phosphorylate the activated receptors, and β-arrestins (βarrs) which bind to the phosphorylated receptors and attenuate signaling (1).
Recently, however, two interrelated and dramatic paradigm shifts have changed our understanding of how GPCRs function. In the first it has been appreciated that interaction of the receptors with βarr1 and βarr2 leads not only to desensitization of their G protein-mediated actions and endocytosis via clathrin-coated pits but also to activation of numerous recently appreciated signaling pathways by virtue of their ability to serve as multifunctional scaffolds and adaptors (2–4). In fact this appears to be a general mechanism through which βarrs interact with numerous signaling molecules to coordinate a wide variety of cellular processes (5).
In the second paradigm shift, the “two state” model of receptor action that postulates an inactive (R) conformation of the receptor in equilibrium with a unitary active (R*) conformation has given way to models in which receptors exist in multiple ligand-specific active (R*n) conformations (6–9), each of which is thought to possess varying abilities to activate downstream signaling pathways (10–14). It is now generally accepted that the ability of an agonist to induce a receptor-mediated response (i.e. efficacy) can vary across the distinct signaling pathways emanating from a single GPCR, a phenomenon conceptualized within the frameworks of biased agonism (15) and “functional selectivity” (16). In the limit case, completely biased agonists antagonize one arm of signaling (e.g. G protein-mediated) while simultaneously activating another (e.g. βarr-mediated). Peptide analogs of angiotensin II (AngII), which serves as the endogenous agonist for the angiotensin II type 1 receptor (AT1R), represent some of the most striking examples of completely biased agonists to date (17). Interestingly, some of these βarr-biased ligands (e.g. TRV120023 and TRV120027) exhibit unique beneficial properties in vivo, which are consistent with their complete bias for βarr2 versus Gq-mediated signaling in cellular assays (18–21). More generally, biased GPCR agonists have immense therapeutic potential by virtue of their abilities to favor signaling pathways required for therapeutic effects over those responsible for deleterious side effects (22, 23).
Despite this, the molecular mechanism(s) by which biased agonists selectively engage distinct signaling pathways such as those mediated by G proteins and βarrs remain elusive. This is due in large part to the complexities of tissue and cellular assays that alter the apparent efficacies of agonists and confound their accurate quantification (17, 24). Various qualitative and quantitative methods have emerged to overcome issues arising from differences in receptor density, the relative stoichiometry of signaling elements, and receptor coupling efficiencies. These include calculating reversals in the rank order of potencies and efficacies (25, 26), making “equimolar” (27) and “equiactive” comparisons (28), and estimating coupling efficiency (17) and transduction coefficients (29) using the operational model (30). However, the best approach remains controversial (31, 32). Alternatively, defining efficacy in precise chemical terms would bypass these limitations and permit the accurate quantitation of ligand efficacy at distinct transducer pathways in vitro, thereby facilitating investigation of the molecular basis of biased agonism.
Accordingly, we developed a cell-free approach to quantify the molecular efficacies of balanced and biased AT1R agonists for activating G protein and βarr pathways (i.e. “transducer-specific molecular efficacies”). This allowed us to test the hypothesis that biased agonism arises from differences in ligand-receptor-transducer ternary complex (LRT) interactions. Our approach was based on the following fundamental tenets: 1) GPCRs are prototypic allosteric proteins (33, 34); 2) efficacy, as it is conceived to reside within the LRT ternary complex (35, 36), can be defined in precise chemical terms as the allosteric effect that a receptor-bound ligand exerts on the coupling and consequent activation of a signal transduction protein (i.e. molecular efficacy); 3) the allosteric effect exerted by a given agonist-receptor interaction at one transducer protein is not of equal magnitude to that at another transducer, suggesting that molecular efficacies can be biased for different signaling pathways (34, 37). Based on these assumptions we equated shifts in the binding affinities (i.e. KLo/KHi) of ligands at AT1R-Gq and AT1R-βarr2 fusion proteins with their molecular efficacies for activating Gq and βarr2, respectively. The transducer-specific molecular efficacies reported here represent the first attempt to quantify the thermodynamic driving forces underlying differences in ligand efficacy between transducers.
EXPERIMENTAL PROCEDURES
Generation of AT1R-Gq and AT1R-βarr2 Fusion Constructs
AT1R-Gq and AT1R-βarr2 fusion proteins containing a cleavable N-terminal Hemophilus influenza hemagglutinin membrane insertion signal sequence and N-terminal FLAG epitope tag were generated via overlapping PCR. For the AT1R-Gq fusion protein, PCR amplicons of full-length human AT1R cDNA (NM_009585) and full-length human Gq cDNA (NM_002072) were digested with DpnI, gel-purified, and combined at a ratio of 1:1. The mixture was digested with T4 DNA polymerase and quenched with dCTP before ligation with T7 DNA ligase. A 17-amino acid linker (GGGGSAEAAAKAGGGGSM) was subsequently introduced via insertional mutagenesis (Stratagene, La Jolla, CA). For the AT1R-βarr2 fusion protein, PCR amplicons of full-length human AT1R cDNA and full-length rat βarr2 cDNA (NM_012911) were ligated according to the above procedure. A stop codon was subsequently inserted at amino acid 395 to generate a truncated, phosphorylation-independent βarr2. The resulting AT1R (1152 bp, 44 kDa), AT1R-Gq (2280 bp, 87 kDa), and AT1R-βarr2 (2334 bp, 88 kDa) constructs were subcloned into pcDNA3 and sequenced (Duke DNA Analysis Facility, Durham, NC) before use.
Cell Culture
HEK 293 cells were cultured at 37 °C in a humidified environment (5% CO2) using standard minimum Eagle's growth medium supplemented with 10% FBS, 100 units/ml penicillin, and 100 μg/ml streptomycin. Monoclonal cell lines stably expressing high levels of AT1R (clone #15), AT1R-Gq (clone #15), or AT1R-βarr2 (clone #23) were selected from a pool of HEK 293 cells transiently transfected with 2 μg of AT1R, AT1R-Gq, or AT1R-βarr2 cDNA. Selection was initiated and maintained with 500 μg/ml G418. HEK 293 cells stably expressing the human AT1R were cultured for inositol monophosphate (IP1) accumulation assays as previously described (18). U2OS cells were cultured for internalization assays as described by the manufacturer (DiscoveRx, Fremont, CA).
Immunoprecipitation and Immunoblotting
AT1R, AT1R-Gq, and AT1R-βarr2 receptor proteins were immunoprecipitated from stable cell lines using standard procedures. Briefly, cells were solubilized in cold lysis buffer (5 mm HEPES, pH 7.5, 250 mm NaCl, 0.5% Nonidet P-40, 10% glycerol, 2 mm EDTA, 0.01% n-dodecyl-β-d-maltoside, and EDTA-free protease inhibitor mixture). After centrifugation, the cleared lysate was incubated overnight at 4 °C with anti-M2 FLAG-agarose beads. Receptors bound to beads were washed extensively with cold lysis buffer, deglycosylated with peptide N-glycosidase F, and eluted with lysis buffer containing 400 μm FLAG peptide (Sigma). Immunoprecipitated receptors were resolved on 4–20% SDS-PAGE gels and immunoblotted using standard procedures. Immunoreactive bands representing the AT1R (polyclonal α-FLAG, Sigma), the AT1R-Gq fusion protein (polyclonal α-Gq, Santa Cruz Biotechnology, Inc., Dallas, TX), and the AT1R-βarr2 fusion protein (polyclonal α-βarr2, A1CT (38)) were visualized using GeneSnap Imaging software (Syngene, Frederick, MD).
Membrane Purification
To quantify Gq molecular efficacy, a single large batch of purified membrane was prepared from AT1R (clone #15)- or AT1R-Gq (clone #15)-expressing cells. High levels of receptor expression were achieved by co-transfecting stable lines (FuGENE 6, Roche Applied Science) with additional receptor cDNA and the pAdvantage vector (ratio of 4:1, Promega, Madison, WI) as well as culturing in the presence of 2% DMSO. Cells were harvested in cold wash buffer (20 mm Tris-HCl and 150 mm NaCl, pH 7.4) and Dounce-homogenized (100 strokes) in cold homogenization buffer (20 mm Tris-HCl and EDTA-free protease inhibitor mixture, pH 7.4). Following differential centrifugation, the P2 microsomal membrane fraction was resuspended in cold buffer (50 mm Tris-HCl, protease inhibitor mixture, 150 mm NaCl, 12.5 mm MgCl2, 0.2% BSA, and 10% glycerol, pH 7.4), aliquoted, and stored at −80 °C until use. To quantify βarr2 molecular efficacy, a modified version of the aforementioned procedure was used to prepare a single large batch of purified membrane from AT1R (clone #15)- or AT1R-βarr2 (clone #23)-expressing cells. Specifically, cells were co-transfected with a membrane-targeted GRK2 mutant (i.e. CAAX GRK2) to promote receptor phosphorylation and βarr2 coupling (39). Consequently, phosphatase inhibitors (5 nm microcystin LF, 10 nm calyculin A, 10 mm sodium fluoride, 1 mm tetrasodium pyrophosphate, and 1 mm β-glycerophosphate) were added to homogenization and resuspension buffers.
Ligands
Angiotensin II was synthesized by GenScript USA Inc. (Piscataway, NJ). TRV120023, TRV120026, TRV120034, TRV120044, TRV120045, TRV120055, and TRV120056 were developed and supplied by Trevena, Inc. (King of Prussia, PA). SII was synthesized by the Molecular Biotechnology Core Laboratory of the Lerner Research Institute (Cleveland Clinic Foundation, Cleveland, OH). Telmisartan was obtained from Toronto Research Chemicals (Ontario, Canada). PerkinElmer Life Sciences (Waltham, MA) supplied both 125I-Sar1,Ile8-AngII, 2200 Ci/mmol) and 125I-angiotensin II (125I-AngII, 2200 Ci/mmol).
Radioligand Binding Assays
Competition radioligand binding assays using unfused and transducer-fused AT1R-expressing membranes were conducted in parallel to facilitate rigorous analysis (see “Experimental Procedures”). Competition binding assays measuring Gq molecular efficacy were performed in a Gq assay buffer (50 mm Tris-HCl, pH 7.4, 150 mm NaCl, 12.5 mm MgCl2, and 0.2% BSA) containing 50 pm 125I-Sar1,Ile8-AngII, AT1R (0.5 μg) or AT1R-Gq (0.25 μg) membranes, and a serial dilution of test ligand. Binding assays measuring βarr2 molecular efficacy were performed in βarr2 assay buffer (50 mm Tris-HCl, pH 7.4, 50 mm potassium acetate, 150 mm NaCl, 5 mm MgCl2, and 0.2% BSA) containing 50 pm 125I-Sar1,Ile8-AngII, AT1R + CAAX GRK2 (1 μg) or AT1R-βarr2 + CAAX GRK2 (0.4 μg) membranes, and a serial dilution of test ligand. Nonspecific binding was determined in the presence of 10 μm telmisartan, whereas total binding was determined in the absence of a competitor. To ensure accurate low affinity determination, binding assays on unfused AT1R membranes included a non-hydrolyzable GTP analog 5′-guanylyl imidodiphosphate (GPP(NH)P) at 1 μm for Gq assay and 100 μm for βarr2 assay. After a 1.5-h incubation at 25 °C, bound radioactivity was collected on 0.3% polyethyleneimine-treated GF/C filters using cold Gq wash buffer (50 mm Tris-HCl, pH 7.4) or cold βarr2 wash buffer (50 mm Tris-HCl, pH 7.4, and 50 mm potassium acetate). Bound radioactivity was quantified on a Packard Cobra gamma counter (GMI, Ramsey, MN). Saturation binding assays were performed on AT1R-Gq and AT1R-βarr2 membranes as described above except that serial dilutions of 125I-AngII (5 pm to 1 nm) and 125I-Sar1,Ile8-AngII (5 pm to 2 nm) were used to label transducer-coupled and total AT1R populations, respectively.
IP1 Accumulation
IP1 accumulation was measured using the IP-One Tb HTRF kit (Cisbio, Bedford, MA) as described previously (18).
AT1R Internalization Assays
βarr-dependent AT1R internalization was measured using the activated endocytosis assay (DiscoveRx, Fremont, CA). Briefly, the human AT1R was transiently expressed in U2OS cells stably expressing an Enzyme Acceptor-tagged βarr2 and an endosome-localized ProLink tag. Cells (20,000 cells/well) were incubated in 96-well plates for 24 h and stimulated with test ligand (100 μm to 0.1 nm) for 30 min or 3 h at 37 °C. AT1R internalization was detected as luminescence resulting from the complementation of β-galactosidase fragments (Enzyme Acceptor and ProLink) within endosomes. Luminescence was detected on a NOVOstar plate reader (BMG Labtech Inc., Cary, NC) using the PathHunter Detection kit (DiscoveRx, Fremont, CA).
βarr2 Recruitment Assays
The PathHunter βarr assay from DiscoveRx (Fremont, CA) measured recruitment of βarr2 to the AT1R for cellular bias calculations as described previously (17, 18).
ERK1/2 Phosphorylation Assays
ERK1/2 phosphorylation was measured using the Cellul'erk HTRF kit (Cisbio, Bedford, MA). HEK 293 cells (50,000 cells/well) transiently expressing the unfused AT1R, AT1R-Gq, or AT1R-βarr2 fusion proteins were stimulated with 1 μm AngII for 10 min at 37 °C. Plates were read on a PheraStar reader using a time-resolved fluorescence ratio of 665 nm/615 nm. ERK1/2 phosphorylation was reported as -fold over base-line response.
Quantification of Ligand-transducer Free-energy Coupling
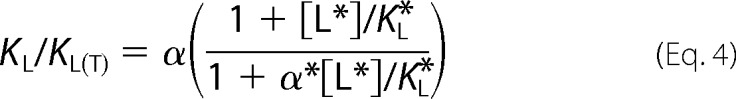
The simplest quantity describing the differential efficacy of ligands at the molecular level is the ligand-induced allosteric effect that governs receptor coupling to the transduction protein (i.e. molecular efficacy; Ref. 36). According to linkage thermodynamics (40, 41), the simultaneous binding of ligand and transduction protein to distinct sites on a receptor permits measurement of the allosteric coupling (i.e. α) between agonist and transduction protein by calculating the ratio of “unconditional” and “conditional” binding constants,
where KL or KT are the dissociation constants for the ligand (L) or the transducer (T) when each binds to the receptor in the absence of the other, and KL(T) or KT(L) are the dissociation constants when each binds to a receptor already saturated by the other. Because α itself represents an equilibrium constant (i.e. describing the disproportionation reaction: [LRT] + [R] = [LR] + [TR]), this ratio has the connotation of a difference of free-energy changes (ΔΔG) (41),
where R = the ideal gas constant, and T = thermodynamic temperature. Thus, α provides an overall physical measure of agonist molecular efficacy independent of the underlying microscopic mechanisms. It was on this theoretical background that the ternary complex model (TCM) of receptor-G protein interaction was originally proposed to explain the correlation between GTP effects on ligand binding and ligand efficacy (35).
It is also clear that this measurement of α or molecular efficacy directly leads to an accurate assessment of the molecular source of ligand bias. In fact, if the allosteric coupling of an agonist can be determined at receptor ternary complexes consisting of two different transducers (T1 and T2), molecular bias is defined as the ratio,
A molecular bias of ≈1 indicates a balanced agonist, whereas values above or below unity would indicate that the agonist has greater efficacy for the first or the second transducer, respectively.
According to the TCM, approximate values of ligand efficacies can be determined by measuring the GTP-induced shift of agonist affinities in different transduction proteins. However, this approach cannot be used for transduction proteins such as arrestins, which are neither resident in the membrane nor regulated by guanine nucleotides. To bypass the problem, we adopted an alternative strategy. As shown previously, chimeric proteins consisting of receptors fused to different transduction proteins are functionally coupled and maintain the same efficacy profiles of the native receptor (42). Under such conditions, it is assumed that the presence of a covalently tethered transducer on the receptor can emulate the situation in which a transduction protein is expressed in the membrane at large stoichiometric excess over receptor. Thus, the shift in agonist binding affinity between free and transducer-linked receptors can assess the free-energy coupling of that agonist for that transducer as presented in Equation 2. Here, comparing agonist allosteric effects on AT1R fused to Gq or to βarr2 permits us to evaluate the molecular bias of AT1R agonists for the two transduction proteins.
In the case of GPCRs where agonist dissociation constants are typically determined from competition curves using a radioligand, the ratio of agonist binding constants is
 |
where KL and KL(T) are the respective agonist binding constants from competition curves in free and transducer-fused receptor, and the starred parameters, [L*], KL*, and α*, indicate the concentration, dissociation constant, and the coupling constant of the radioligand, respectively. If the radiotracer is a neutral antagonist (i.e. α* = 1), the ratio of competition binding constants (commonly referred to as KLo/KHi) equals the agonist molecular efficacy, α. Moreover, the effect of small deviations in radioligand efficacy from unity (e.g. 2 ≥ α* ≥ 0.5) are minimized if the radioligand concentration is below its dissociation constant.
Curve Fitting and Computation of ‘α’
Transducer-fused GPCRs in membranes display biphasic competition curves (42). This is typical of a situation in which there is roughly an equimolar mix of binding sites having high and lower affinity for the agonist. Various factors (42), including those related to the heterogeneity of plasma membrane topology and/or to the supramolecular organization of receptor/transduction proteins, could be responsible for the apparent sequestration of a large fraction of receptor in an uncoupled, low affinity form. A pragmatic solution is to fit the data with a two-site binding model to deconvolute the high affinity component from biphasic competition curves, calculating α values under the constraint that the fraction of coupled receptor is a constant shared by all ligands. Such a curve-fitting procedure, however, can only work for ligands with high α values, because as the ratio of dissociation constants drops close to 10, two-site binding isotherms become indistinguishable from a one-site binding curve with slope factor ≪1.
To address the inaccuracy with which α is computed from weakly shifted binding curves, we adopted a two-step fitting protocol (using the Solver Add-in for Excel, Microsoft, Redmond, WA). First, all the pairs of competition binding curves obtained in membranes expressing transducer-fused or unfused receptors for each ligand were fitted using the single-site binding model,
where B is radioligand binding in the absence (B0) and presence (Bn) of saturating unlabeled ligand, K0.5 is the concentration of agonist at half-maximal binding inhibition, [A]T is the total concentration of competing ligand, and s is the slope factor at K0.5. Using the best-fitting parameters computed above, the experimental data points of each pair of curves were rescaled on both the y axis, as fractional binding (i.e. B/B0 = (B − Bn)/(B0 − Bn)), and the x axis, as log-unit change about the K0.5 value of the unfused receptor (i.e. Δx = log[A]T − log K0.5-unfused). Effectively, this normalization subtracts from the data the individual differences in Kd values across ligands without altering the shape of the binding isotherms. As a result, all ligand curves can be re-fitted simultaneously in the subsequent analysis using a reduced set of unknown parameters.
In the second step, all normalized competition curves obtained at both transducer fusion proteins (along with the corresponding unfused receptor controls) were globally fitted using the following two-site binding function,
 |
where F is the fraction of high affinity binding (i.e. fraction of transducer-coupled receptor, F = 0 for the unfused receptor), and s1 and s2 are the slope factors of the two binding components. Simultaneous fitting of competition binding curves for all 10 ligands at both transducer fusion proteins (together with the matching curves of the unfused receptor) was accomplished by sharing the parameter F among all ligands. Of the two slope factors, s1 was set = 1 for all ligands, whereas s2 was a freely adjustable fitting parameter. Separate tests in which s1 was varied for each ligand showed that the values of this parameter have a negligible influence on the overall goodness of fit and the final α values, as determined by F-tests based on the extra sum of squares principle (43). The validity of the fundamental assumption that F can be shared across the two fusion proteins was statistically and experimentally verified. First, we found that in three independent experiments the fractions of coupled receptors were not significantly different when the sets of binding curves obtained in the two fusion proteins were fitted separately (means ± S.D. were 40 ± 4% at AT1R-Gq and 41 ± 5% at AT1R-βarr2, p = 0.35 by F-test). Second, direct binding studies with 125I-AngII and 125I-Sar1,Ile8-AngII to measure the maximal fraction of high affinity binding accessible to the agonist indicated no significant difference between membranes expressing AT1R-Gq or AT1R-βarr2 (means ± S.E. were 49 ± 2% at AT1R-Gq and 48 ± 5% at AT1R-βarr2; n = 3; p = 0.78 by F-test).
Calculating the Area between Two Binding Curves (Δ Integral)
To verify that the above assumptions (particularly the sharing of the parameter F across ligands) do not introduce a systematic error in the assessment of ligand α values, we also used a model-free approach to quantify the shift in agonist binding upon transducer coupling. For each agonist we measured the area of the region bounded by the unfused and transducer-fused displacement curves. Ligand binding curves from paired experiments on unfused and transducer-fused AT1R were normalized as described above and numerically integrated with respect to the same range of Δx units (−5,3). The area of the bounded region was calculated by taking the difference of the two integral values (unfused minus transducer-fused AT1R, Δ integral).
Data Analysis
Functional experiments were analyzed using the nonlinear iterative curve-fitting computer program Graphpad Prism 5 (GraphPad Software Inc., La Jolla, CA). AT1R internalization and IP1 accumulation data were fit to a three-parameter log concentration-response curve to generate potency (log EC50) and maximal response (Emax) values. To account for differences in assay amplification, efficacy values for IP1 accumulation (log τIP1 accumulation) and AT1R internalization (log τinternalization) were calculated according to the procedure of Rajagopal et al. (17). The resulting τ values are a true estimation of ligand efficacy given the constraint imposed by setting the low affinity value constant. Briefly, published (17) and unpublished data were fit to the operational model of Black and Leff (30), setting the Log KD of each ligand equal to its low affinity log Ki determined at the unfused AT1R. Bias factors (β) were calculated for published (17) and unpublished data according to the operational approach of Rajagopal et al. (17). Molecular bias was calculated from transducer-specific molecular efficacies using Equation 3 (see “Quantification of Ligand-transducer Free-energy Coupling” under “Experimental Procedures”). Radioligand binding experiments, except those used to quantify molecular efficacy (see “Curve Fitting and Computation of α” under “Experimental Procedures”), were analyzed using GraphPad Prism 5.
Statistics
Standard statistical tests (i.e. two-tailed Pearson correlation, one-way ANOVA, two-way ANOVA, and F tests) were performed using the GraphPad Prism package. A threshold significance level of p < 0.05 was used for all tests.
RESULTS
Quantification of the Transducer-specific Molecular Efficacies of GPCR Agonists in Vitro
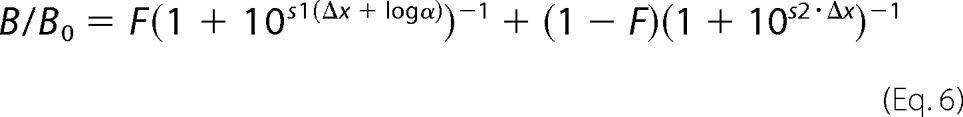
To quantify the transducer-specific molecular efficacies of different GPCR ligands and investigate the molecular basis of biased agonism, we developed a cell-free approach that discriminates between the allosteric effects that different transducers exert upon the binding of a ligand to a GPCR (see “Experimental Procedures” for a detailed discussion). As originally theorized in the TCM (35, 36), the molecular efficacy of an agonist is quantified by the coupling free-energy α that can be measured from the shift in apparent ligand affinity (i.e. KLo/KHi), which results from the formation of the receptor-transducer protein complex. This leftward shift represents the ratio of the dissociation constant of the ligand for the uncoupled receptor (i.e. low affinity, KLo) to that for the transducer-coupled receptor (i.e. high affinity, KHi). A graphic illustration of α quantification is shown in Fig. 1A.
FIGURE 1.
Quantifying the transducer-specific molecular efficacies (αT) of a GPCR ligand in vitro using GPCR-transducer fusion proteins. A, diagram illustrating how αT is calculated from the competitive displacement of a radiolabeled tracer by the binding of a ligand to an unfused receptor (solid line) and a transducer-fused receptor (dashed line). Plotted is the fraction of the radiolabeled antagonist tracer bound as a function of increasing concentrations of a competing ligand, both of which are normalized to facilitate simultaneous curve fitting (see “Curve Fitting and Computation of α” under “Experimental Procedures”). Relative to the low affinity value (KLo) that is shared between unfused and transducer-fused GPCRs, the magnitude of the leftward shift to a higher affinity (KHi) at the GPCR-transducer fusion protein equals the molecular efficacy for activating the fused transducer (i.e. KLo/KHi = αT). Competition binding isotherms were generated in Prism 5.0 (Graphpad) by fitting simulated data to one-site (fraction coupled = 0) and two-site (fraction coupled = 0.5) competition binding models. The highlighted area between the curves (gray) represents Δ integral, which is a model-free quantification of molecular efficacy (see “Calculating the Area between Two Binding Curves” under “Experimental Procedures”). B, the affinity shift of a balanced ligand is predicted to be of similar magnitude across GPCR-transducer fusion proteins (αA = 220 and αB = 300). C, the affinity shift of a biased ligand is predicted to be of greater magnitude at one GPCR-transducer fusion protein over another (αA = 2.2 and αB = 300). D, the competition binding isotherms of an antagonist are unaffected by transducer coupling, with affinity shifts approaching unity at both GPCR-transducer fusion proteins (αA = 2.2 and αB = 1.5).
We accomplished this for G protein and βarr signaling pathways by exploiting the unique properties of genetically encoded fusion constructs containing a GPCR and a C-terminally fused Gq or βarr2. More specifically, we chose the AT1R fused to either Gq or βarr2 as our model system based on the recent identification of a large panel of Gq- and βarr2-biased AT1R agonists (17). To accurately quantify KLo/KHi shifts at AT1R-transducer fusion proteins, we adopted two complementary but independent approaches. In the first approach we computed KLo/KHi or α by fitting the curves with a two-site binding model, which assumes the existence of two fractions of the same receptor, only one of which can couple to the signal transduction protein (see “Curve Fitting and Computation of α” under “Experimental Procedures” for a detailed discussion). Note that α here represents the overall amount of free-energy change involved in the conformational perturbation that produces the active LRT ternary complex (36). Thus, the difference in α values of an agonist for two transducers quantifies the extent of bias of that agonist on the free-energy scale. Graphic illustrations of the predicted differences between balanced agonists, biased agonists, and antagonists are shown in Fig. 1, B, C, and D, respectively.
The second approach was derived from the empirical observation that transducer coupling to a receptor results in a leftward translation in agonist competition curves (i.e. to a higher affinity) relative to the uncoupled receptor (35, 44). Thus, we computed the area between the unfused and transducer-fused competition curves to quantify the transducer effect, taking advantage of the fact that all measurements were performed in parallel throughout the study. This is represented by the shaded region in Fig. 1A, hereafter referred to as Δ integral (see “Calculating the Area between Two Binding Curves” under “Experimental Procedures”). Although this quantity provides information equivalent to the KLo/KHi ratio, it was obtained from a model-free approach and is thus independent of the assumptions used for the computation of α.
Generation and Validation of AT1R-Gq and AT1R-βarr2 Fusion Proteins
We generated functional AT1R-Gq and AT1R-βarr2 fusion proteins to quantify transducer-specific molecular efficacies in vitro. As detailed in Fig. 2A, the AT1R-Gq fusion protein consisted of the human Gq protein fused via a linker to the extreme C terminus of the human AT1R, and the AT1R-βarr2 fusion protein consisted of the truncated rat βarr2 fused to the extreme C terminus of the human AT1R. Control immunoblots showed that, relative to the unfused AT1R, both AT1R-Gq and AT1R-βarr2 constructs were stably overexpressed as intact fusion proteins in HEK 293 cell membranes (arrows, Fig. 2, B–D). Saturation binding analysis of the same purified membranes confirmed that unfused and transducer-fused constructs were indeed overexpressed (Bmax ± S.E. was 7.1 ± 0.1pmol/mg for AT1R membranes, 15.1 ± 0.2 pmol/mg for AT1R-Gq membranes, and 10.7 ± 0.3 pmol/mg for AT1R-βarr2 membranes; n = 3) and properly folded (Kd ± S.E. for antagonist 125I-Sar1,Ile8-AngII binding to the AT1R was 212 ± 12 pm, to AT1R-Gq was 242 ± 10 pm, and to the AT1R-βarr2 was 271 ± 28 pm; n = 3) (Fig. 2E).
FIGURE 2.

Construction (A) and validation (B–G) of AT1R-Gq and AT1R-βarr2 fusion constructs used for the in vitro quantification of ligand molecular efficacy at Gq and βarr2 signaling pathways, respectively. A, schematic depicting how the full-length human AT1R was fused to either the full-length human Gq or truncated rat βarr2. B, anti-FLAG immunoblot (IB) confirming the overexpression and appropriate processing of all three receptor constructs in HEK 293 cells (AT1R molecular mass = 44 kDa, AT1R-Gq molecular mass = 87 kDa, and AT1R-βarr2 molecular mass = 88 kDa; arrows). IP, immunoprecipitation. C, anti-Gq immunoblot confirming the overexpression and appropriate processing of the AT1R-Gq fusion protein (arrow) in HEK 293 cells. D, anti-βarr2 immunoblot confirming the overexpression and appropriate processing of the AT1R-βarr2 fusion protein (arrow) in HEK 293 cells. E, saturation binding analysis of HEK 293 cell membranes overexpressing AT1R (●), AT1R-Gq (■), or AT1R-βarr2 (□) proteins. Saturation binding of the radiolabeled antagonist 125I-Sar1,Ile8-AngII revealed that all three constructs were overexpressed and bound the antagonist with characteristic high affinity. AT1R Bmax = 7.1 ± 0.1pmol/mg, and Kd = 212 ± 12 pm; AT1R-Gq Bmax = 15.1 ± 0.2pmol/mg and Kd = 242 ± 10 pm; AT1R-βarr2 Bmax = 10.7 ± 0.3pmol/mg, and Kd = 271 ± 28 pm. Data represent the mean ± S.E. of three independent experiments. F, validating AT1R-Gq fusion protein function by assessing AngII high affinity binding. The AT1R-Gq fusion was functional as the high affinity binding of AngII (▴) could be blocked by 500 μm GPP(NH)P (▾). Data represent the mean ± S.E. of three independent experiments. G, validating AT1R-βarr2 fusion protein function by assessing AngII high affinity binding. The AT1R-βarr2 fusion protein was functional because the high affinity binding of AngII (▴) was insensitive to 500 μm GPP(NH)P (▾). Data represent the mean ± S.E. of three independent experiments.
Experiments assessing the ability for the endogenous agonist AngII to compete with high affinity against the antagonist radioligand 125I-Sar1,Ile8-AngII were used to verify the functionality of AT1R-Gq and AT1R-βarr2 fusion proteins. Consistent with functional coupling between the AT1R and its fused Gq (Fig. 1A), high affinity AngII binding at the AT1R-Gq fusion protein was blocked by the non-hydrolyzable GTP analog GPP(NH)P (Fig. 2F). Conversely, high affinity AngII binding remained largely intact at the AT1R-βarr2 fusion protein in the presence of high concentrations of GPP(NH)P, indicative of functional coupling between the AT1R and its fused βarr2 (Fig. 2G). We further confirmed that each fusion protein was competent to signal by testing the ability of AngII to induce ERK1/2 phosphorylation in HEK 293 cells transfected with AT1R, AT1R-Gq, or AT1R-βarr2. Consistent with normal AT1R function (45), a 10-min treatment with 1 μm AngII resulted in significant increases in ERK1/2 phosphorylation that were similar across unfused and transducer-fused AT1R cell lines (-fold increase ± S.E. was 1.95 ± 0.17 for AT1R, 1.80 ± 0.17 for AT1R-Gq, and 1.5 ± 0.03 for AT1R-βarr2; n = 4; p < 0.05 by one-way ANOVA comparing responses to AngII-stimulated control cells). Untransfected HEK 293 cells were unresponsive to AngII (-fold increase ± S.E. was 0.93 ± 0.03; n = 4), confirming that ERK1/2 phosphorylation was mediated exclusively by exogenously expressed AT1Rs.
Quantifying the Molecular Efficacies of AT1R Ligands at Two Distinct Transducer Pathways in Vitro
The allosteric nature of ligand efficacy permitted us to equate shifts in ligand binding affinities (i.e. KLo/KHi) at AT1R-Gq and AT1R-βarr2 fusion proteins with their molecular efficacies for activating Gq and βarr2, respectively (see “Experimental Procedures” for a detailed discussion). To demonstrate this and ultimately investigate the molecular basis of biased agonism at the AT1R, we quantified the molecular efficacies of AT1R ligands which exhibit a wide range of cellular efficacies for Gq and βarr2 signaling. These included: 1) the balanced, endogenous full agonist AngII (17); 2) the βarr2-biased agonists SII, TRV120023, TRV120026, TRV120034, TRV120044, and TRV120045 (17, 18, 46); 3) the Gq-biased agonists TRV120055 and TRV120056 (17); 4) the antagonist telmisartan (47).
In close agreement with previous studies assessing agonist binding at GPCR-transducer fusions in cell membranes (42), a fraction (∼40%) of receptors was available for formation of high affinity ternary complexes containing Gq or βarr2. Qualitatively, the coupling of Gq or βarr2 to the AT1R had wide-ranging effects on ligand affinities that could be classified according to their reported activation of Gq and βarr2 in cells (Fig. 3).
FIGURE 3.

Shifts in binding affinities at AT1R-Gq and AT1R-βarr2 fusion proteins quantify the transducer-specific molecular efficacies of a series of AT1R ligands. Ligands were grouped according to their previously reported efficacies in cells (17, 18, 46, 47). Plotted for each ligand are 125I-Sar1,Ile8-AngII competition radioligand binding isotherms performed on purified HEK 293 cell membranes overexpressing the unfused AT1R (●, ■), the AT1R-Gq fusion protein (○), or the AT1R-βarr2 fusion protein (□). Both the x axis and y axis were normalized for simultaneous nonlinear regression curve fitting (see “Curve Fitting and Computation of α” under “Experimental Procedures”), yielding an average value of 40% for AT1R in the high affinity state. The plotted isotherms represent the global fits of at least three independent experiments, and data points represent the mean of one representative experiment performed in duplicate. The highlighted area between the curves (Δ integral, see “Calculating the Area between Two Binding Curves” under “Experimental Procedures”) represents the magnitude of the curve-shift and is proportional to the molecular efficacy for Gq (blue) or βarr2 (red). A, 125I-Sar1,Ile8-AngII competition binding isotherms for the balanced agonist AngII. Similar shifts were observed at each transducer fusion protein. B, 125I-Sar1,Ile8-AngII competition binding isotherms for the βarr2-biased agonists SII, TRV120023, TRV120026, TRV120034, TRV120044, and TRV120045. Shifts at the βarr2 fusion protein were larger than those detected at the Gq fusion protein. C, 125I-Sar1,Ile8-AngII competition binding isotherms for the Gq-biased agonists TRV120055 and TRV120056. Large affinity shifts were observed at the Gq fusion protein compared with more modest shifts observed at the βarr2 fusion protein. D, 125I-Sar1,Ile8-AngII competition binding isotherms for the antagonist telmisartan. Affinity shifts were undetectable at either transducer fusion protein.
Quantification of these affinity shifts as α, free-energy (i.e. ΔΔG), or Δ integral values revealed a wide range of molecular efficacies for activating Gq and βarr2 signaling pathways (Table 1). First, consistent with the prediction made for balanced activation of two distinct signaling pathways (Fig. 1B), AngII possessed molecular efficacies of roughly equal magnitude for both transducers (Fig. 3A). Second, consistent with the prediction made for biased activation of βarr2 over Gq (Fig. 1C), the molecular efficacies of previously identified βarr2-biased agonists SII, TRV120023, TRV120026, TRV120034, TRV120044, and TRV120045 were larger at the AT1R-βarr2 fusion protein relative to the AT1R-Gq fusion protein (Fig. 3B). In fact, the Gq molecular efficacies of completely βarr2-biased ligands such as TRV120026, TRV120034, and TRV120044 were small and approached that of the antagonist telmisartan. This is in good agreement with the ability of the structurally related βarr2-biased peptide TRV120027 to function as an antagonist of Gq signaling in cells (18). Third, consistent with the prediction made for biased activation of Gq over βarr2 (Fig. 1C), the molecular efficacies of Gq-biased agonists TRV120055 and TRV120056 were 10-fold larger at the AT1R-Gq fusion protein compared with the AT1R-βarr2 fusion protein (Fig. 3C). The Gq molecular efficacies of TRV120055 and TRV120056 were, in fact, the largest of any ligand tested (Table 1). This is consistent with their extremely high efficacy values for activating Gq in cells (17). Fourth, as predicted (Fig. 1D), the antagonist telmisartan lacked detectable molecular efficacy at either transducer (Fig. 3D).
TABLE 1.
Transducer-specific molecular efficacies of AT1R ligands for Gq and βarr2 signaling pathways
| Ligand | Peptide sequencea | AT1R-Gq |
AT1R-βarr2 |
||||||
|---|---|---|---|---|---|---|---|---|---|
| LogαGq (mean ± S.E.)b | αGqb | ΔΔG (mean ± S.E.)c | Δ Integral (mean ± S.E.)d | Log αβarr2 (mean ± S.E.)b | αβarr2b | ΔΔG (mean ± S.E.)c | Δ Integral (mean ± S.E.)d | ||
| AngIIe,f | Asp-Arg-Val-Tyr-Ile-His-Pro-Phe | 1.63 ± 0.02 | 43.0 | −3.76 ± 0.05 | 0.69 ± 0.01 | 1.47 ± 0.03 | 29.6 | −3.39 ± 0.07 | 0.59 ± 0.02 |
| SIIe,f | Sar-Arg-Val-Ile-Ile-His-Pro-Ile | 0.57 ± 0.07 | 3.7 | −1.31 ± 0.16 | 0.20 ± 0.02 | 0.77 ± 0.03 | 5.9 | −1.77 ± 0.06 | 0.30 ± 0.01 |
| TRV120023 | Sar-Arg-Val-Tyr-Lys-His-Pro-Ala | 0.28 ± 0.04 | 1.9 | −0.64 ± 0.08 | 0.10 ± 0.01 | 1.14 ± 0.08 | 13.8 | −2.63 ± 0.18 | 0.44 ± 0.02 |
| TRV120026 | Sar-Arg-Val-Tyr-Tyr-His-Pro-NH2 | 0.20 ± 0.02 | 1.6 | −0.45 ± 0.06 | 0.08 ± 0.01 | 1.26 ± 0.08 | 18.1 | −2.90 ± 0.19 | 0.52 ± 0.03 |
| TRV120034 | N-Methyl-l-Ala-Arg-Val-Tyr-Ile-His-Pro-Ala | 0.35 ± 0.08 | 2.3 | −0.81 ± 0.19 | 0.14 ± 0.03 | 1.11 ± 0.04 | 13.0 | −2.56 ± 0.10 | 0.43 ± 0.02 |
| TRV120044 | N-Methyl-l-Ala-Arg-Val-Tyr-Ile-His-Pro-d-Ala | 0.17 ± 0.06 | 1.5 | −0.40 ± 0.13 | 0.07 ± 0.02 | 1.11 ± 0.16 | 12.8 | −2.55 ± 0.36 | 0.43 ± 0.09 |
| TRV120045f | N-Methyl-d-Ala-Arg-Val-Tyr-Ile-His-Pro-Ala | 0.54 ± 0.11 | 3.5 | −1.24 ±0.25 | 0.19 ± 0.03 | 1.09 ± 0.08 | 12.3 | −2.51 ± 0.19 | 0.44 ± 0.04 |
| TRV120055 | Gly-Val-Tyr-Ile-His-Pro-Phe | 2.62 ± 0.02 | 412.7 | −6.02 ± 0.06 | 0.93 ± 0.03 | 1.51 ± 0.02 | 32.3 | −3.48 ± 0.06 | 0.57 ± 0.02 |
| TRV120056 | Asp-Arg-Gly-Val-Tyr-Ile-His-Pro-Phe | 2.59 ± 0.04 | 391.7 | −5.97 ± 0.10 | 0.91 ± 0.03 | 1.35 ± 0.09 | 22.3 | −3.10 ± 0.20 | 0.54 ± 0.04 |
| Telmisartane | −0.02 ± 0.05 | 1.0 | 0.04 ± 0.10 | 0.00 ± 0.01 | −0.12 ± 0.01 | 0.8 | 0.28 ± 0.01 | −0.04 ± 0.00 | |
a Peptide sequences are corrected from a previous report (17).
b Molecular efficacies for activating Gq(αGq) and βarr2(αβarr2) in vitro. Calculated from KLo/KHi affinity shifts at AT1R-Gq and AT1R-βarr2 fusion proteins, respectively (see “Experimental Procedures”).
c Difference of free-energy changes expressed as RT units. Provides overall physical measure of ligand molecular efficacy for activating Gq and βarr2 (see “Experimental Procedures”).
d The area bounded by unfused and transducer-fused curves. Provides a model-free quantification of ligand molecular efficacy for activating Gq and βarr2 (see “Experimental Procedures”).
e Small differences between log αGq and logαβarr2 were significantly different according to two-way ANOVA and Bonferroni post-tests, p < 0.05. The antagonist telmisartan failed to reach statistical significance by the same test; p > 0.05.
f The bias factors of both TRV120045 and SII were significantly different from that of the antagonist telmisartan which lacked molecular efficacy at either transducer (p < 0.05 by one-way ANOVA and Tukey-Kramer post-tests). By this criterion, AngII is balanced (p > 0.05 by one-way ANOVA and Tukey-Kramer post-tests).
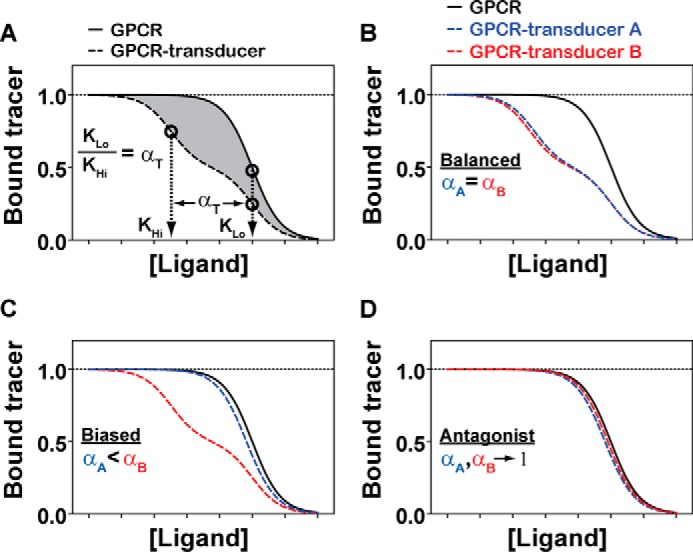
We also observed that the computation of Δ integral values yielded estimates that could explain 99% of the variance in molecular efficacies calculated from KLo/KHi values in vitro (Gq r2 = 0.9911, p < 0.0001 and βarr2 r2 = 0.9942, p < 0.0001 by two-tailed Pearson correlation) (Fig. 4). This strong agreement in molecular efficacies using two independent analytical approaches highlights the accuracy and robustness of our curve-fitting procedure.
FIGURE 4.
Comparisons between transducer-specific molecular efficacies (α) calculated using a two-site binding model and the area between unfused and transducer-fused AT1R binding isotherms (Δ integral). A, correlation analysis of molecular efficacies for activating Gq (Log αGq) and Δ integral values calculated from shifts in ligand affinity at the AT1R-Gq fusion protein. Both methods were highly correlated and yielded nearly identical results (p < 0.0001 by two-tailed Pearson correlation analysis). B, correlation analysis of molecular efficacies for activating βarr2 (log αβarr2) and Δ integral values calculated from shifts in ligand affinity at the AT1R-βarr2 fusion protein. Both methods were highly correlated and yielded nearly identical results (p < 0.0001 by two-tailed Pearson correlation analysis). Data represent the mean ± S.E. of at least three independent experiments.
Investigating the Relationship between Apparent Ligand Efficacies Calculated in Cellular Assays and Molecular Efficacies Calculated in Vitro
To test the TCM prediction that free-energy values account for variations in biological effects, we determined if the efficacies for activating Gq and βarr2 in cells (i.e. log τ according to Ref. 17) correlated with molecular efficacies calculated at fusion proteins in vitro (i.e. log α). Consistent with TCM predictions, the efficacies of AT1R ligands for activating Gq and promoting IP1 accumulation in cells (Fig. 5A) were significantly correlated with their molecular efficacies calculated at the AT1R-Gq fusion protein (r2 = 0.9189, p = 0.0007 by two-tailed Pearson correlation; Fig. 5B).
FIGURE 5.

Investigating the relationship between apparent ligand efficacies calculated in cellular assays and transducer-specific molecular efficacies calculated at fusion proteins in vitro. A, concentration-response curves showing the relative abilities of AT1R ligands of varying efficacy (i.e. AngII, TRV120055, TRV120056, TRV120045, TRV120026, TRV120023, and SII) to promote IP1 accumulation in HEK 293 cells stably expressing the human AT1R. Data (mean ± S.E. of at least four independent experiments) were normalized to maximal AngII response and analyzed via nonlinear regression curve fitting in Prism 5.0 (Graphpad). B, correlation analysis of efficacies for activating Gq in cells (log τIP1 accumulation (17)) and molecular efficacies for activating Gq in vitro (log αGq). The varying abilities of AngII, TRV120055, TRV120056, SII, TRV120023, TRV120026, and TRV120045 to activate Gq in cells were significantly correlated with log αGq values (r2 = 0.9189, p = 0.0007 by two-tailed Pearson correlation). Data represent the mean ± S.E. of at least three independent experiments. C, concentration-response curves showing the relative abilities of ligands with varying molecular efficacies (i.e. AngII, TRV120055, TRV120056, TRV120023, and SII) to promote βarr2-dependent AT1R internalization in U2OS cells transiently expressing the human AT1R. Data (mean ± S.E. of at least three independent experiments) were normalized to maximal AngII response and analyzed via nonlinear regression curve fitting in Prism 5.0 (Graphpad). Changing the incubation time from 3 h to 30 min at 37 °C did not change the rank order of ligand responses. D, correlation analysis of efficacies for promoting βarr2-mediated AT1R internalization in cells (log τinternalization (17)) and molecular efficacies for activating βarr2 in vitro (log αβarr2). The varying abilities of AngII, TRV120055, TRV120056, SII, and TRV120023 to promote AT1R internalization in cells were significantly correlated with log αβarr2 values (r2 = 0.7909, p = 0.0435 by two-tailed Pearson correlation). Data represent the mean ± S.E. of at least three independent experiments.
A similar relationship was observed for βarr2. Efficacies corresponding to the abilities of AngII, TRV120055, TRV120056, TRV120023, and SII to promote AT1R internalization in cells (i.e. a classic βarr-dependent process (4); Fig. 5C) were significantly correlated with their βarr2 molecular efficacies calculated at the AT1R-βarr2 fusion protein (r2 = 0.7909, p = 0.0435 by two-tailed Pearson correlation; Fig. 5D). Because of the low level of amplification in the internalization assay, strong agreement was also observed between maximal cellular responses (Emax) and βarr2 molecular efficacies (r2 = 0.9140, p = 0.011 by two-tailed Pearson correlation). Rank orders of potency and efficacy (calculated as τ and Emax values) were conserved in a shorter internalization assay (30 min), alleviating concerns that cellular contributions over the 3-h incubation period confounded internalization measurements.
Analysis of Biased Molecular Efficacy at the AT1R
Strong correlations between transducer-specific molecular efficacies and the biased activation of Gq or βarr2 signaling pathways in cells (Fig. 5, B and D) suggested that biased AT1R agonists possess biased molecular efficacies. To determine if biased agonism arises from differences in LRT ternary complex interactions, we computed molecular bias as the difference in log α values across Gq and βarr2 transducers (i.e. log(αGq/αβarr2)). This index resulted in positive values for Gq-biased agonists (blue) and negative values for βarr2-biased agonists (red). As shown in Fig. 6A, our ligand panel revealed striking examples of diametrically opposite biased molecular efficacies. Specifically, the peptides TRV120056 and TRV120055 showed a large degree of bias for Gq, whereas TRV120045, TRV120034, TRV120023, TRV120044, and TRV120026 displayed an equally large, yet opposite bias for βarr2. A lower level of βarr2 bias was observed for SII, whereas the “balanced” agonist AII and antagonist telmisartan displayed small levels of bias toward Gq. Note that despite the small bias factor, the βarr2 bias of SII was significantly different from that of the antagonist telmisartan, which lacked molecular efficacy at either transducer (p < 0.05 by one-way ANOVA and Tukey-Kramer post-tests). By this criterion, AngII appeared balanced (p > 0.05 by one-way ANOVA and Tukey-Kramer post tests).
FIGURE 6.

Investigating biased agonism at the level of the LRT ternary complex. A, bias factors (log(αGq/αβarr2)) calculated from molecular efficacies at AT1R-Gq (αGq) and AT1R-βarr2 (αβarr2) fusion proteins. Positive bias values (blue) denote Gq-biased molecular efficacies, whereas negative values (red) denote βarr2-biased molecular efficacies. B, correlation analysis of molecular bias values calculated in vitro (Log(αGq/αβarr2) relative to AngII) and bias values calculated in cells (β) according to the operational approach of Rajagopal et al. (17). Bias at the level of transducer-specific molecular efficacies was significantly correlated with cellular indices of bias (r2 = 0.8605, p = 0.003 by two-tailed Pearson correlation), suggesting that biased molecular efficacies generate signaling bias in cells. Data represent the mean ± S.E. of at least three independent experiments. C, plotting molecular efficacy at each transducer (log αGq and log αβarr2) versus the molecular bias between transducers (log αGq/αβarr2)) uncovers a potential mechanism for generating bias at the AT1R. βarr2-biased ligands (lower left) and Gq-biased ligands (upper right) clustered according to their transducer preferences. Trends in the vertical distances between log αGq (blue) and log αβarr2 (red) suggest that βarr2 bias arises from a reciprocal loss in Gq molecular efficacy and gain in βarr2 efficacy, whereas Gq bias results from an increase in Gq molecular efficacy with no concomitant loss in βarr2 efficacy.
A test of our ability to identify biologically relevant bias at the molecular level is presented in Fig. 6B. We found that biased molecular efficacies were strongly correlated with bias factors calculated in cells using an operational model of agonism (17) (r2 = 0.8605, p = 0.003 by two-tailed Pearson correlation). This supports a mechanism whereby biased molecular efficacies generate signaling bias in cellular assays.
To understand how transducer bias might arise for each ligand, we plotted molecular efficacy (i.e. log αGq and log αβarr2) as a function of the molecular bias between these transducers (i.e. log(αGq/αβarr2)). Driven by their transducer preferences, βarr2-biased ligands clustered in the lower left quadrant, whereas Gq-biased ligands clustered in the upper right quadrant (Fig. 6C). The extent to which these ligands were biased was represented not only by their displacement from 0 along the x axis but also by the vertical distance between Gq and βarr2 molecular efficacies. Trends in the vertical distances between transducers for each ligand revealed that the mechanism producing βarr2 bias differed from that generating Gq bias. For βarr2 bias, there was a loss in Gq molecular efficacy that was almost exactly compensated by a gain in βarr2 efficacy (e.g. see TRV120026). By contrast, Gq bias appeared to result from an increase in Gq molecular efficacy with no concomitant loss in efficacy for βarr2 (e.g. see TRV120056).
DISCUSSION
The molecular mechanism(s) underlying biased agonism remain elusive given the challenges associated with quantifying ligand efficacy in cells (17). In the alternate approach described here, we bypassed the need for cellular assays by equating shifts in ligand affinity at GPCR-transducer fusion proteins with the activation of different transducers (i.e. transducer-specific molecular efficacies). These studies with balanced and biased AT1R agonists provide the most direct test of TCM predictions, revealing that 1) transducer-specific molecular efficacies are strongly correlated with cellular efficacies for activating Gq and βarr2, and 2) biased agonists possess biased molecular efficacies. These findings support a molecular mechanism whereby differences in the allosteric effect that each ligand propagates to different transducers can generate biased agonism at a GPCR.
Current cell-based approaches measure efficacy, however imperfectly, using complex biological responses as a caliper to indirectly measure the allosteric effect that a ligand exerts on different transducer proteins (37). By contrast, calculating KLo/KHi ratios at different GPCR-transducer fusion proteins (i.e. at different LRT ternary complexes) directly quantifies these allosteric effects. This represents a key technical advance as receptor-transducer interactions occur within covalently tethered scaffolds of defined stoichiometry in fusion proteins, thereby overcoming differences in receptor expression and efficiency of signal transduction (17), as well as the issue that receptor-transducer interactions differ vastly in timing and cellular location (37). GPCR-transducer fusion proteins also equalize differences in the unconditional affinity constants that govern the bimolecular interactions between the empty receptor and the two transduction proteins, thus ensuring that the ΔΔG values measured for free-energy coupling are not affected by large differences in such constants and accurately represent the net allosteric effect of each ligand. Although it is well known that fused GPCR constructs can interact with endogenous G proteins of the membrane (48), we found that resident G protein had a negligible effect on βarr2 coupling (see Fig. 2G). In addition, because our experimental protocol was based on the comparison of binding curves recorded on transducer-fused and unfused receptor in paired determinations, the potential effects of additional interacting proteins present in the membrane are largely canceled. Thus, the measured KLo/KHi ratios (and the closely correlated Δ integral values) truly represent the net allosteric effect that each ligand has on the fused transduction protein.
Perhaps the most significant advantage is our ability to accurately measure the thermodynamic driving forces (i.e. free-energy coupling) underlying the stabilization of different active LRT ternary complexes, thereby permitting direct comparisons across transducers. This is made possible because the allosteric effects existing between ligands and transducers are based on exactly the same energy scale. Therefore, unlike conventional cellular assays, the quantification of transducer-specific molecular efficacies does not rely on normalized data with respect to an arbitrarily chosen reference ligand or with respect to an apparently “maximal” cellular response.
Previous work has shown that the KLo/KHi ratios of GPCR agonists measured in the presence and absence of GTP are strongly correlated with the efficacy of the ligand in signaling assays (35, 49, 50). Our data extend such findings by showing that a similar correlation also exists between the ratios of high and low affinity states and agonist efficacy for non-GTP-binding transduction proteins such as βarrs. Thus, this study represents the most direct demonstration of the tight correspondence that exists between the empirical concept of ligand efficacy of Stephenson's receptor theory (51) and the allosteric coupling constant defined by the TCM.
The key observation that a tight correlation exists between the free-energy associated with bias (i.e. biased molecular efficacies) and bias indices measured in cellular assays provides a significant conceptual advance in understanding the molecular mechanism(s) underlying biased agonism. It suggests that the differential activation of Gq and βarr2 by the biased AT1R agonists studied here is accounted for by the difference in allosteric effects that they propagate to Gq and βarr2. This has important implications with regard to the current conceptualization that biased agonism results from differences arising at two molecular loci, one situated proximally at the level of LRT ternary complex formation (i.e. “ligand” or “efficacy” bias) and the other located distally within the signal amplification machinery (i.e. “system” bias) (52). Unlike system bias where the process of unequal amplification of distinct signaling pathways yields biased signaling profiles (17), unequivocal support for the mechanism underlying ligand bias is lacking. This is primarily a technical limitation, reflecting the challenges associated with measuring ligand effects at distinct LRT ternary complexes in cells. Here we directly investigated ligand effects on the formation of different LRT ternary complexes in isolation, observing that both Gq and βarr2-biased AT1R agonists possess biased molecular efficacies. These findings not only provide the most direct support for ligand bias but they also represent the most proximal evidence of biased agonism to date. More broadly, these findings extend our current conceptualization of the LRT ternary complex by merging classic pharmacological theory with the realization that ligand bias is an important feature of many receptor systems.
Within the limits of the small number of peptides investigated, it was apparent that the property of biased agonism at the AT1R, especially when directed toward βarr2, appears to be quite frequent and robust (Fig. 6A). The reason for such profound bias is unknown. However, it is interesting to speculate that the tight interactions of βarr2 with the AT1R, thus making it a class B receptor (53), may explain the abundance of βarr2-biased agonists. In support of this, many receptors for which βarr-biased ligands have been identified show class B behavior (54, 55).
On comparing the molecular efficacies of Gq and βarr2 by scaling their values over the extent of transducer bias (Fig. 6C), two distinct mechanisms emerged to potentially explain how bias develops at the AT1R. The βarr2 bias of ligands such as TRV120026 and TRV120044 appeared to result from a reciprocal change in transducer-specific molecular efficacies, where the loss of Gq efficacy is associated with an equivalent gain of βarr2 efficacy. The G protein bias of ligands such as TRV120055 and TRV120056, instead, occurred as a net increase of efficacy at Gq with no loss of βarr2 efficacy. This might suggest that within the series of peptides showing enhanced βarr2 bias, the change in molecular structure of the ligand alters the overall balance of subsite interactions between receptor and peptide residues. This may result in a progressive shift from interactions that are cooperatively linked to the G protein-binding interface to those that are connected to the βarr interface. In contrast, for Gq-biased ligands it seems that the change in peptide structure can selectively boost the cooperative effects that favor Gq binding without changing the allosteric effects on βarr2 binding. Although such speculation is limited by the small number of biased agonists tested, this notion that topographically distinct structural elements move independently to produce bias is consistent with the allosteric nature of GPCRs (56) and the existence of ligand-specific receptor conformations (9). Direct support for this comes from the observation that functionally similar ligands produce distinct patterns of amino acid side chain reactivity at the β2 adrenergic receptor (7).
A limitation to our approach is the observation that free-energy values associated with bias represent a small percentage (2–20%) of the overall binding energy of each ligand, potentially making it difficult to accurately determine the bias factors of ligands. Despite this, the weak bias of a ligand like SII was strongly correlated with the biologically derived index of biased efficacy (Fig. 6, A and B). It is particularly interesting to note that even a free-energy difference between Gq and βarr2, which is below one RT unit, such as that measured for SII, is nonetheless sufficient to generate a clear impact on biased signaling in cells as documented in several previous studies (45, 46, 57). This raises the question as to whether differences that entail such very small changes of energy can ever be detected when inspecting the atomic configurations of ligand-bound receptor structures. Although this has yet to be adequately addressed, a recent comparison of x-ray crystal structures of the 5-HT1B and 5-HT2B serotonin receptors bound to the biased agonist ergotamine offers initial insight into the structural changes underlying biased agonism (13).
GRKs are thought to differentially regulate GPCR function by producing distinct patterns of phosphorylation (i.e. phosphorylation “‘bar codes”), which alter βarr2 conformation and function (58). A potential limitation is that we did not account for these phosphorylation-driven effects. However, the relationship between βarr2 activation in cells and in vitro (Fig. 5D) suggests that phosphorylation bar codes do not play major roles in the βarr2 signaling of the ligands tested here. Nonetheless, GPCR-βarr2 fusion proteins with defined phosphorylation patterns could represent a powerful approach for quantifying the extent to which phosphorylation bar codes modulate agonist efficacy.
The key observation that biased molecular efficacies strongly correlate with biased agonism in cells (Fig. 6B) has significant implications for drug discovery. Unlike conventional drugs, which target multiple GPCR signaling pathways, biased agonists potentially represent a novel class of drugs with enhanced efficacy given their abilities to engage specific therapeutic pathways (22, 57). It is clear that biased agonists with therapeutically relevant signaling profiles at several GPCRs can be developed (57, 59–62); however, the therapeutic potential of biased agonists has yet to be realized in the clinic. In this regard, the concept of biased molecular efficacies is of considerable importance as the bias observed at the level of the LRT ternary complex (i.e. ligand bias) is system-independent and expected to carry over into useful therapeutic bias in various cells and tissues (52). Indeed, biased ligands at several receptors, which were first characterized in biochemical assays, have shown the cellular and in vivo pharmacology predicted from earlier studies of the underlying G protein and βarr pathways (57, 62). Here we provide direct support for this by showing that the βarr2-biased molecular efficacy of TRV120023 correlates with both its extreme βarr2 bias in cells (17, 18) and βarr2-mediated enhancement of cardiac performance in vivo (18, 20, 21). Moreover, the closely related peptide TRV120027, which exhibits a similar efficacy profile, is now in clinical trials for the treatment of acute heart failure (63). More broadly, our study suggests that using GPCR-transducer fusion proteins or alternative approaches to quantify ligand molecular efficacy could identify biased agonists with a well defined in vivo pharmacology.
The use of GPCR-transducer fusion proteins has permitted us to accurately quantify transducer-specific molecular efficacies in vitro. When determined for a panel of balanced and biased AT1R ligands, it is apparent that ligand efficacy resides at the level of LRT ternary complex interactions. Comparisons across transducers reveal that biased AT1R agonists possess biased molecular efficacies, correlating with the bias determined in cellular assays. These findings represent the first quantification of the thermodynamic driving forces underlying differences in ligand efficacy between transducers and suggest that, at least for the AT1R, biased agonism can originate at the level of LRT ternary complex interactions. These results have broad implications not only for understanding the molecular mechanisms underlying biased agonism but also for the development of safer and more efficacious therapeutics.
Acknowledgments
We thank Dr. Sudarshan Rajagopal and Dr. Laura Wingler for critical review of the manuscript and Dr. Bryan Roth for supplying the pAdvantage expression vector. Scott Klayner's kind assistance with TR-FRET assays was greatly appreciated.
This work was supported, in whole or in part, by National Institutes of Health Grants HL16037 and HL70631. R. J. L. is a co-founder of Trevena, Inc., a privately held clinical stage pharmaceutical company dedicated to the discovery and development of biased GPCR ligands. J. D. V. and D. H. R. are both employed by Trevena, Inc.
- GPCR
- G protein-coupled receptor
- βarr2
- β-arrestin2
- AT1R
- angiotensin II type 1 receptor
- GRK
- G protein-coupled receptor kinase
- AngII
- angiotensin II
- LRT
- ligand-receptor-transducer ternary complex
- TCM
- ternary complex model
- GPP(NH)P
- 5′-guanylyl imidodiphosphate
- IP1
- inositol monophosphate
- ANOVA
- analysis of variance.
REFERENCES
- 1. Pierce K. L., Premont R. T., Lefkowitz R. J. (2002) Seven-transmembrane receptors. Nat. Rev. Mol. Cell Biol. 3, 639–650 [DOI] [PubMed] [Google Scholar]
- 2. Lefkowitz R. J., Shenoy S. K. (2005) Transduction of receptor signals by β-arrestins. Science 308, 512–517 [DOI] [PubMed] [Google Scholar]
- 3. Shukla A. K., Xiao K., Lefkowitz R. J. (2011) Emerging paradigms of β-arrestin-dependent seven transmembrane receptor signaling. Trends Biochem. Sci. 36, 457–469 [DOI] [PMC free article] [PubMed] [Google Scholar]
- 4. Luttrell L. M., Gesty-Palmer D. (2010) Beyond desensitization: physiological relevance of arrestin-dependent signaling. Pharmacol. Rev. 62, 305–330 [DOI] [PMC free article] [PubMed] [Google Scholar]
- 5. Xiao K., McClatchy D. B., Shukla A. K., Zhao Y., Chen M., Shenoy S. K., Yates J. R., 3rd, Lefkowitz R. J. (2007) Functional specialization of β-arrestin interactions revealed by proteomic analysis. Proc. Natl. Acad. Sci. U.S.A. 104, 12011–12016 [DOI] [PMC free article] [PubMed] [Google Scholar]
- 6. Yao X., Parnot C., Deupi X., Ratnala V. R., Swaminath G., Farrens D., Kobilka B. (2006) Coupling ligand structure to specific conformational switches in the β2-adrenoceptor. Nat. Chem. Biol. 2, 417–422 [DOI] [PubMed] [Google Scholar]
- 7. Kahsai A. W., Xiao K., Rajagopal S., Ahn S., Shukla A. K., Sun J., Oas T. G., Lefkowitz R. J. (2011) Multiple ligand-specific conformations of the β2-adrenergic receptor. Nat. Chem. Biol. 7, 692–700 [DOI] [PMC free article] [PubMed] [Google Scholar]
- 8. Katritch V., Cherezov V., Stevens R. C. (2013) Structure-function of the G protein-coupled receptor superfamily. Annu. Rev. Pharmacol. Toxicol. 53, 531–556 [DOI] [PMC free article] [PubMed] [Google Scholar]
- 9. Kobilka B. K., Deupi X. (2007) Conformational complexity of G-protein-coupled receptors. Trends Pharmacol. Sci. 28, 397–406 [DOI] [PubMed] [Google Scholar]
- 10. Rahmeh R., Damian M., Cottet M., Orcel H., Mendre C., Durroux T., Sharma K. S., Durand G., Pucci B., Trinquet E., Zwier J. M., Deupi X., Bron P., Banères J. L., Mouillac B., Granier S. (2012) Structural insights into biased G protein-coupled receptor signaling revealed by fluorescence spectroscopy. Proc. Natl. Acad. Sci. U.S.A. 109, 6733–6738 [DOI] [PMC free article] [PubMed] [Google Scholar]
- 11. Mary S., Damian M., Louet M., Floquet N., Fehrentz J. A., Marie J., Martinez J., Banères J. L. (2012) Ligands and signaling proteins govern the conformational landscape explored by a G protein-coupled receptor. Proc. Natl. Acad. Sci. U.S.A. 109, 8304–8309 [DOI] [PMC free article] [PubMed] [Google Scholar]
- 12. Liu J. J., Horst R., Katritch V., Stevens R. C., Wüthrich K. (2012) Biased signaling pathways in β2-adrenergic receptor characterized by 19F NMR. Science 335, 1106–1110 [DOI] [PMC free article] [PubMed] [Google Scholar]
- 13. Wacker D., Wang C., Katritch V., Han G. W., Huang X. P., Vardy E., McCorvy J. D., Jiang Y., Chu M., Siu F. Y., Liu W., Xu H. E., Cherezov V., Roth B. L., Stevens R. C. (2013) Structural features for functional selectivity at serotonin receptors. Science 340, 615–619 [DOI] [PMC free article] [PubMed] [Google Scholar]
- 14. Wootten D., Simms J., Miller L. J., Christopoulos A., Sexton P. M. (2013) Polar transmembrane interactions drive formation of ligand-specific and signal pathway-biased family B G protein-coupled receptor conformations. Proc. Natl. Acad. Sci. U.S.A. 110, 5211–5216 [DOI] [PMC free article] [PubMed] [Google Scholar]
- 15. Reiter E., Ahn S., Shukla A. K., Lefkowitz R. J. (2012) Molecular mechanism of β-arrestin-biased agonism at seven-transmembrane receptors. Annu. Rev. Pharmacol. Toxicol. 52, 179–197 [DOI] [PMC free article] [PubMed] [Google Scholar]
- 16. Kenakin T. (2011) Functional selectivity and biased receptor signaling. J. Pharmacol. Exp. Ther. 336, 296–302 [DOI] [PubMed] [Google Scholar]
- 17. Rajagopal S., Ahn S., Rominger D. H., Gowen-MacDonald W., Lam C. M., Dewire S. M., Violin J. D., Lefkowitz R. J. (2011) Quantifying ligand bias at seven-transmembrane receptors. Mol. Pharmacol. 80, 367–377 [DOI] [PMC free article] [PubMed] [Google Scholar]
- 18. Violin J. D., DeWire S. M., Yamashita D., Rominger D. H., Nguyen L., Schiller K., Whalen E. J., Gowen M., Lark M. W. (2010) Selectively engaging β-arrestins at the angiotensin II type 1 receptor reduces blood pressure and increases cardiac performance. J. Pharmacol. Exp. Ther. 335, 572–579 [DOI] [PubMed] [Google Scholar]
- 19. Boerrigter G., Lark M. W., Whalen E. J., Soergel D. G., Violin J. D., Burnett J. C., Jr. (2011) Cardiorenal actions of TRV120027, a novel β-arrestin-biased ligand at the angiotensin II type I receptor, in healthy and heart failure canines: a novel therapeutic strategy for acute heart failure. Circ. Heart Fail. 4, 770–778 [DOI] [PubMed] [Google Scholar]
- 20. Monasky M. M., Taglieri D. M., Henze M., Warren C. M., Utter M. S., Soergel D. G., Violin J. D., Solaro R. J. (2013) The β-arrestin-biased ligand TRV120023 inhibits angiotensin II-induced cardiac hypertrophy while preserving enhanced myofilament response to calcium. Am. J. Physiol. Heart Circ. Physiol. 305, H856–H866 [DOI] [PMC free article] [PubMed] [Google Scholar]
- 21. Kim K. S., Abraham D., Williams B., Violin J. D., Mao L., Rockman H. A. (2012) β-Arrestin-biased AT1R stimulation promotes cell survival during acute cardiac injury. Am. J. Physiol. Heart Circ. Physiol. 303, H1001–H1010 [DOI] [PMC free article] [PubMed] [Google Scholar]
- 22. Whalen E. J., Rajagopal S., Lefkowitz R. J. (2011) Therapeutic potential of β-arrestin- and G protein-biased agonists. Trends Mol. Med. 17, 126–139 [DOI] [PMC free article] [PubMed] [Google Scholar]
- 23. Kenakin T. (2012) The potential for selective pharmacological therapies through biased receptor signaling. BMC Pharmacol Toxicol. 13, 3. [DOI] [PMC free article] [PubMed] [Google Scholar]
- 24. Kenakin T., Christopoulos A. (2013) Signalling bias in new drug discovery: detection, quantification, and therapeutic impact. Nat. Rev. Drug Discov. 12, 205–216 [DOI] [PubMed] [Google Scholar]
- 25. Berg K. A., Maayani S., Goldfarb J., Scaramellini C., Leff P., Clarke W. P. (1998) Effector pathway-dependent relative efficacy at serotonin type 2A and 2C receptors: evidence for agonist-directed trafficking of receptor stimulus. Mol. Pharmacol. 54, 94–104 [PubMed] [Google Scholar]
- 26. Strachan R. T., Sciaky N., Cronan M. R., Kroeze W. K., Roth B. L. (2010) Genetic deletion of p90 ribosomal S6 kinase 2 alters patterns of 5-hydroxytryptamine 2A serotonin receptor functional selectivity. Mol. Pharmacol. 77, 327–338 [DOI] [PMC free article] [PubMed] [Google Scholar]
- 27. Gregory K. J., Hall N. E., Tobin A. B., Sexton P. M., Christopoulos A. (2010) Identification of orthosteric and allosteric site mutations in M2 muscarinic acetylcholine receptors that contribute to ligand-selective signaling bias. J. Biol. Chem. 285, 7459–7474 [DOI] [PMC free article] [PubMed] [Google Scholar]
- 28. Figueroa K. W., Griffin M. T., Ehlert F. J. (2009) Selectivity of agonists for the active state of M1 to M4 muscarinic receptor subtypes. J. Pharmacol. Exp. Ther. 328, 331–342 [DOI] [PMC free article] [PubMed] [Google Scholar]
- 29. Kenakin T., Watson C., Muniz-Medina V., Christopoulos A., Novick S. (2012) A simple method for quantifying functional selectivity and agonist bias. ACS Chem. Neurosci. 3, 193–203 [DOI] [PMC free article] [PubMed] [Google Scholar]
- 30. Black J. W., Leff P. (1983) Operational models of pharmacological agonism. Proc. R. Soc. Lond. B Biol. Sci. 220, 141–162 [DOI] [PubMed] [Google Scholar]
- 31. Kenakin T., Christopoulos A. (2013) Measurements of ligand bias and functional affinity. Nat. Rev. Drug Discov. 12, 483. [DOI] [PubMed] [Google Scholar]
- 32. Rajagopal S. (2013) Quantifying biased agonism: understanding the links between affinity and efficacy. Nat. Rev. Drug Discov. 12, 483. [DOI] [PubMed] [Google Scholar]
- 33. Onaran H. O., Costa T. (1997) Agonist efficacy and allosteric models of receptor action. Ann. N.Y. Acad. Sci. 812, 98–115 [DOI] [PubMed] [Google Scholar]
- 34. Kenakin T. P. (2012) Biased signalling and allosteric machines: new vistas and challenges for drug discovery. Br. J. Pharmacol. 165, 1659–1669 [DOI] [PMC free article] [PubMed] [Google Scholar]
- 35. De Lean A., Stadel J. M., Lefkowitz R. J. (1980) A ternary complex model explains the agonist-specific binding properties of the adenylate cyclase-coupled β-adrenergic receptor. J. Biol. Chem. 255, 7108–7117 [PubMed] [Google Scholar]
- 36. Samama P., Cotecchia S., Costa T., Lefkowitz R. J. (1993) A mutation-induced activated state of the β2-adrenergic receptor. Extending the ternary complex model. J. Biol. Chem. 268, 4625–4636 [PubMed] [Google Scholar]
- 37. Onaran H. O., Costa T. (2012) Where have all the active receptor states gone? Nat. Chem. Biol. 8, 674–677 [DOI] [PubMed] [Google Scholar]
- 38. Kohout T. A., Lin F. S., Perry S. J., Conner D. A., Lefkowitz R. J. (2001) β-Arrestin 1 and 2 differentially regulate heptahelical receptor signaling and trafficking. Proc. Natl. Acad. Sci. U.S.A. 98, 1601–1606 [DOI] [PMC free article] [PubMed] [Google Scholar]
- 39. Inglese J., Koch W. J., Caron M. G., Lefkowitz R. J. (1992) Isoprenylation in regulation of signal transduction by G-protein-coupled receptor kinases. Nature 359, 147–150 [DOI] [PubMed] [Google Scholar]
- 40. Fenton A. W. (2008) Allostery: an illustrated definition for the “second secret of life.” Trends Biochem. Sciences 33, 420–425 [DOI] [PMC free article] [PubMed] [Google Scholar]
- 41. Weber G. (1972) Ligand binding and internal equilibria in proteins. Biochemistry 11, 864–878 [DOI] [PubMed] [Google Scholar]
- 42. Seifert R., Wenzel-Seifert K., Kobilka B. K. (1999) GPCR-Gα fusion proteins: molecular analysis of receptor-G-protein coupling. Trends Pharmacol. Sci. 20, 383–389 [DOI] [PubMed] [Google Scholar]
- 43. DeLean A., Munson P. J., Rodbard D. (1978) Simultaneous analysis of families of sigmoidal curves: application to bioassay, radioligand assay, and physiological dose-response curves. Am. J. Physiol. 235, E97–E102 [DOI] [PubMed] [Google Scholar]
- 44. Gurevich V. V., Pals-Rylaarsdam R., Benovic J. L., Hosey M. M., Onorato J. J. (1997) Agonist-receptor-arrestin, an alternative ternary complex with high agonist affinity. J. Biol. Chem. 272, 28849–28852 [DOI] [PubMed] [Google Scholar]
- 45. Wei H., Ahn S., Shenoy S. K., Karnik S. S., Hunyady L., Luttrell L. M., Lefkowitz R. J. (2003) Independent β-arrestin 2 and G protein-mediated pathways for angiotensin II activation of extracellular signal-regulated kinases 1 and 2. Proc. Natl. Acad. Sci. U.S.A. 100, 10782–10787 [DOI] [PMC free article] [PubMed] [Google Scholar]
- 46. Holloway A. C., Qian H., Pipolo L., Ziogas J., Miura S., Karnik S., Southwell B. R., Lew M. J., Thomas W. G. (2002) Side-chain substitutions within angiotensin II reveal different requirements for signaling, internalization, and phosphorylation of type 1A angiotensin receptors. Mol. Pharmacol. 61, 768–777 [DOI] [PubMed] [Google Scholar]
- 47. Burnier M., Brunner H. R. (2000) Angiotensin II receptor antagonists. Lancet 355, 637–645 [DOI] [PubMed] [Google Scholar]
- 48. Molinari P., Ambrosio C., Riitano D., Sbraccia M., Grò M. C., Costa T. (2003) Promiscuous coupling at receptor-Gα fusion proteins. The receptor of one covalent complex interacts with the α-subunit of another. J. Biol. Chem. 278, 15778–15788 [DOI] [PubMed] [Google Scholar]
- 49. Kent R. S., De Lean A., Lefkowitz R. J. (1980) A quantitative analysis of β-adrenergic receptor interactions: resolution of high and low affinity states of the receptor by computer modeling of ligand binding data. Mol. Pharmacol. 17, 14–23 [PubMed] [Google Scholar]
- 50. Ehlert F. J. (1985) The relationship between muscarinic receptor occupancy and adenylate cyclase inhibition in the rabbit myocardium. Mol. Pharmacol. 28, 410–421 [PubMed] [Google Scholar]
- 51. Stephenson R. P. (1956) A modification of receptor theory. Br. J. Pharmacol. Chemother. 11, 379–393 [DOI] [PMC free article] [PubMed] [Google Scholar]
- 52. Kenakin T. (2013) New concepts in pharmacological efficacy at 7TM receptors: IUPHAR review 2. Br. J. Pharmacol. 168, 554–575 [DOI] [PMC free article] [PubMed] [Google Scholar]
- 53. Oakley R. H., Laporte S. A., Holt J. A., Caron M. G., Barak L. S. (2000) Differential affinities of visual arrestin, β arrestin1, and β arrestin2 for G protein-coupled receptors delineate two major classes of receptors. J. Biol. Chem. 275, 17201–17210 [DOI] [PubMed] [Google Scholar]
- 54. Violin J. D., Lefkowitz R. J. (2007) β-Arrestin-biased ligands at seven-transmembrane receptors. Trends Pharmacol. Sci. 28, 416–422 [DOI] [PubMed] [Google Scholar]
- 55. DeWire S. M., Ahn S., Lefkowitz R. J., Shenoy S. K. (2007) β-Arrestins and cell signaling. Annu. Rev. Physiol. 69, 483–510 [DOI] [PubMed] [Google Scholar]
- 56. Kenakin T., Miller L. J. (2010) Seven transmembrane receptors as shapeshifting proteins: the impact of allosteric modulation and functional selectivity on new drug discovery. Pharmacol. Rev. 62, 265–304 [DOI] [PMC free article] [PubMed] [Google Scholar]
- 57. DeWire S. M., Violin J. D. (2011) Biased ligands for better cardiovascular drugs: dissecting G-protein-coupled receptor pharmacology. Circ. Res. 109, 205–216 [DOI] [PubMed] [Google Scholar]
- 58. Nobles K. N., Xiao K., Ahn S., Shukla A. K., Lam C. M., Rajagopal S., Strachan R. T., Huang T. Y., Bressler E. A., Hara M. R., Shenoy S. K., Gygi S. P., Lefkowitz R. J. (2011) Distinct phosphorylation sites on the β2-adrenergic receptor establish a barcode that encodes differential functions of β-arrestin. Sci. Signal. 4, ra51. [DOI] [PMC free article] [PubMed] [Google Scholar]
- 59. Violin J. D., Soergel D. G., Boerrigter G., Burnett J. C., Jr., Lark M. W. (2013) GPCR biased ligands as novel heart failure therapeutics. Trends Cardiovasc. Med. 23, 242–249 [DOI] [PubMed] [Google Scholar]
- 60. Bohinc B. N., Gesty-Palmer D. (2012) Biased agonism at the parathyroid hormone receptor: a demonstration of functional selectivity in bone metabolism. Mini Rev. Med. Chem. 12, 856–865 [DOI] [PubMed] [Google Scholar]
- 61. Allen J. A., Yost J. M., Setola V., Chen X., Sassano M. F., Chen M., Peterson S., Yadav P. N., Huang X. P., Feng B., Jensen N. H., Che X., Bai X., Frye S. V., Wetsel W. C., Caron M. G., Javitch J. A., Roth B. L., Jin J. (2011) Discovery of β-arrestin-biased dopamine D2 ligands for probing signal transduction pathways essential for antipsychotic efficacy. Proc. Natl. Acad. Sci. U.S.A. 108, 18488–18493 [DOI] [PMC free article] [PubMed] [Google Scholar]
- 62. DeWire S. M., Yamashita D. S., Rominger D. H., Liu G., Cowan C. L., Graczyk T. M., Chen X. T., Pitis P. M., Gotchev D., Yuan C., Koblish M., Lark M. W., Violin J. D. (2013) A G protein-biased ligand at the mu-opioid receptor is potently analgesic with reduced gastrointestinal and respiratory dysfunction compared with morphine. J. Pharmacol. Exp. Ther. 344, 708–717 [DOI] [PubMed] [Google Scholar]
- 63. Soergel D. G., Subach R. A., Cowan C. L., Violin J. D., Lark M. W. (2013) First clinical experience with TRV027: pharmacokinetics and pharmacodynamics in healthy volunteers. J. Clin. Pharmacol. 53, 892–899 [DOI] [PubMed] [Google Scholar]