

Background: Increased glucose uptake is essential for carcinogenesis.
Results: RasV12-induced epigenetic inactivation of RRAD promotes glucose uptake and tumor formation.
Conclusion: RRAD might act as a functional tumor suppressor by inhibiting glucose uptake.
Significance: Down-regulation of RRAD in tumor tissues might be associated with the Warburg effect.
Keywords: DNA Methylation, Metabolism, Ovarian Cancer, Ras, Tumor Suppressor Gene, Oncogenic Transformation, RRAD
Abstract
RRAD (Ras-related associated with diabetes) is a small Ras-related GTPase that is frequently inactivated by DNA methylation of the CpG island in its promoter region in cancer tissues. However, the role of the methylation-induced RRAD inactivation in tumorigenesis remains unclear. In this study, the Ras-regulated transcriptome and epigenome were profiled by comparing T29H (a RasV12-transformed human ovarian epithelial cell line) with T29 (an immortalized but non-transformed cell line) through reduced representation bisulfite sequencing and digital gene expression. We found that RasV12-mediated oncogenic transformation was accompanied by RRAD promoter hypermethylation and a concomitant loss of RRAD expression. In addition, we found that the RRAD promoter was hypermethylated, and its transcription was reduced in ovarian cancer versus normal ovarian tissues. Treatment with the DNA methyltransferase inhibitor 5-aza-2′-deoxycytidine resulted in demethylation in the RRAD promoter and restored RRAD expression in T29H cells. Additionally, treatment with farnesyltransferase inhibitor FTI277 resulted in restored RRAD expression and inhibited DNA methytransferase expression and activity in T29H cells. By employing knockdown and overexpression techniques in T29 and T29H, respectively, we found that RRAD inhibited glucose uptake and lactate production by repressing the expression of glucose transporters. Finally, RRAD overexpression in T29H cells inhibited tumor formation in nude mice, suggesting that RRAD is a tumor suppressor gene. Our results indicate that RasV12-mediated oncogenic transformation induces RRAD epigenetic inactivation, which in turn promotes glucose uptake and may contribute to ovarian cancer tumorigenesis.
Introduction
Ras, a small 21-kDa GTPase that regulates cell proliferation and differentiation, plays a critical role in cancer initiation and progression. Mutations in genes of the human Ras family (H-Ras, K-Ras, and N-Ras) have been detected in ∼30% of human cancers (1, 2). As a membrane protein, Ras serves as a molecular switch that mediates signal transduction across the membrane. Dysregulation of Ras signaling ultimately leads to oncogenesis (1, 3–6). Although multiple Ras effectors have been identified, the precise role of Ras in oncogenic transformation remains unclear. Dissection of Ras and other oncogene-mediated signal transduction networks is currently incomplete, probably due to lack of an appropriate human cancer model (7). Malignant epithelial carcinomas are the most common ovarian cancers and the most lethal gynecological malignancies. Although incidence of Ras mutation was observed in a subset of ovarian carcinomas (8, 9), Ras-mediated oncogenic signal transduction pathways have only recently been characterized in ovarian cancer (10–12).
T29 cells were derived from primary human ovarian surface epithelial cells by stable transfection with SV40 T/t antigens and hTERT. The immortalized but non-oncogenic T29 cells were further transformed by introducing oncogenic HRasV12 to generate the T29H cell line, which resembles natural ovarian cancer in several aspects (10, 12). Functional proteomics analysis of Ras-mediated transformation in these cell lines enabled the identification of proteins targeted by Ras that mediate cellular metabolism, apoptosis, and the methylation pathways (10). Taking advantage of the Ras-T29H ovarian epithelial cell model, Cheng's group also found that the OPCML (opioid-binding protein/cell adhesion molecule-like) gene is epigenetically regulated by Ras in oncogenic transformation (11). However, the genetic and epigenetic mechanisms underlying Ras involvement in oncogenic transformation remain poorly understood.
80 years ago, Otto Warburg proposed that to overcome nutrient limitations for uncontrolled cell proliferation, tumor cells exhibit an altered metabolism characterized by elevated aerobic glycolysis. This hypothesis is supported by the observation of increased glucose uptake in tumor cells (13, 14). Although aerobic glycolysis is an inefficient way to generate ATP, the ratios of ATP/ADP and ADH/NAD+ are high in proliferating cells, especially when they are provided with an abundant nutrient supply in the circulating blood (13, 15, 16). When tumor cells undergo aerobic glycolysis, glucose is converted to lactate and other intermediates for biosynthesis of fatty acids, nonessential amino acids, and nucleotides (13). Numerous studies examining cancer metabolism have revealed that the genes involved in glycolysis are up-regulated in 70% of all human cancers (14, 17); however, the precise mechanisms underlying the up-regulation of aerobic glycolysis in tumor cells remain unclear.
RRAD is a member of the Ras GTPase superfamily and was first identified by its association with insulin resistance in type II diabetes mellitus (18). Accumulating evidence suggests that the RRAD promoter is hypermethylated in human cancers, such as nasopharyngeal carcinoma, breast cancer, malignant mesotheliomas, prostate cancer, cervical carcinoma, and lung cancer, and its promoter hypermethylation is associated with reduced RRAD expression in tumor tissues (19–25). Overexpression of RRAD in cultured adipocytes and muscle cells shows a reduction in insulin-stimulated glucose uptake (26). Ilany et al. (27) generated mice that overexpress RRAD in muscle and found that on a high fat diet, the transgenic mice developed more severe glucose intolerance than wild-type mice due to increased insulin resistance, and there was a further reduction in plasma triglyceride levels in the transgenic mice, which was associated with increased levels of lipoprotein lipase. These observations led us to speculate that RRAD may be involved in cancer aerobic glycolysis by regulating glucose uptake.
DNA methylation changes are integral to all aspects of cancer genomics and have been shown to have important associations with gene expression (28). In this study, the Ras-regulated transcriptome and epigenome were profiled using the RasV12-induced human ovarian cancer model. We found that RasV12-mediated oncogenic transformation was accompanied by RRAD promoter hypermethylation and a concomitant loss of RRAD expression. We also investigated the role of RRAD in glucose uptake and the oncogenic potential of Ras in ovarian epithelial cells.
EXPERIMENTAL PROCEDURES
Cell Culture, Transfection, and Stable Cell Lines
The human ovarian epithelial cell lines T29 and T29H were generous gifts from Dr. Jinsong Liu (10, 12). 293T and HEK293 cells were obtained from the American Tissue Culture Collection (Manassas, VA). The stable cell lines T29H-G7 and T29H-G8 were established by co-transfecting T29H cells with pCMV6-XL5 RRAD (OriGene, Rockville, MD) and pTK-hyg (10:1; Clontech) followed by selection in hygromycin-containing medium (100 μg/ml). The pCMV-RasV12 plasmid was purchased from Clontech. Plasmid transfection was performed using Lipofectamine 2000 (Invitrogen) according to the manufacturer's instructions. RRAD overexpression in stable clones was validated by real-time RT-PCR and Western blot. Cells were maintained in high glucose Dulbecco's modified Eagle's medium (DMEM) supplemented with 10% fetal bovine serum (FBS) and 1% penicillin-streptomycin and were cultured in an incubator in a 5% CO2 humidified atmosphere at 37 °C.
Bisulfite Treatment and Promoter DNA Methylation Analysis
Genomic DNA was extracted using the genomic DNA extraction kit (TIANGEN, Beijing, China). Genomic DNA (750 ng) is used as the starting material and was converted by sodium bisulfite using the EZ DNA Methylation Kit (Zymo Research, Irvine, CA). The RRAD promoter region (+5 to −315 upstream of the TSS) was amplified from the modified DNA using Nest1 and Nest2 primers. The primer sequences are as follows: Nest1, 5′-GGGGTTTTAGGGTGTGTTGT-3′ (sense) and 5′-AATTCTTCTCCAAAAAACAATTAC-3′ (antisense); Nest2, 5′-GTATTGGGTTTTGGTTTTAGAGT-3′ (sense) and 5′-ACTTTTAACTAATTAAATTTACCCC-3′ (antisense). The Nest1 PCR was performed in a total volume of 20 μl using 100 ng of bisulfite-converted DNA as a template with an initial 95 °C denaturation for 5 min, followed by 32 cycles of 1-min denaturation at 95 °C, 30-s annealing at 56 °C, and 45-s extension at 72 °C. The Nest2 PCR was performed in a total volume of 35 μl containing 4.5 μl of the 10-fold diluted Nest1 PCR product under the same PCR conditions for 36 cycles. The PCR product was gel-purified, ligated into pGEM-T (Promega, Madison, WI), sequenced, and analyzed with the PUMA software program.
Human Ovarian Cancer and Normal Specimens
42 ovarian tumors and 10 normal tissues were collected from subjects who underwent surgery in The General Hospital of the People's Liberation Army (Beijing, China). Informed consent was obtained from all subjects. The protocol was approved by the Scientific Ethics Committees of The General Hospital of the People's Liberation Army. All ovarian tumors and control tissues were confirmed by the hospital's clinical pathology department. The classification and features of the ovarian tissues were as listed in Tables 1 and 2. None of the patients received chemotherapy before surgery. Tissue samples were frozen immediately in liquid nitrogen and stored at −80 °C.
TABLE 1.
Classification of clinical and pathologic features
| Characteristic | No. of patients (42 total) | No. of controls (10 total) |
|---|---|---|
| Age | ||
| <50 | 9 | 4 |
| 50–60 | 22 | 5 |
| >60 | 11 | 1 |
| Differentiation | ||
| Well | 7 | |
| Moderately | 13 | |
| Poorly | 22 | |
| TNM stage | ||
| I | 4 | |
| II | 4 | |
| III | 28 | |
| IV | 6 | |
| Type | ||
| Serous | 31 | |
| Mucinous | 5 | |
| Endometrioid | 4 | |
| Others | 2 | |
TABLE 2.
Individual clinical and pathologic features
| Patient no. | Age | Typea | Clinical stage | Differentiationb | Control no. | Age |
|---|---|---|---|---|---|---|
| 1 | 57 | s | III | W | 1 | 63 |
| 2 | 73 | s | III | M | 2 | 55 |
| 3 | 55 | s | III | M | 3 | 48 |
| 4 | 64 | s | III | M | 4 | 46 |
| 5 | 55 | s | III | M | 5 | 47 |
| 6 | 54 | s | III | M | 6 | 52 |
| 7 | 54 | s | III | M | 7 | 55 |
| 8 | 53 | s | III | M | 8 | 45 |
| 9 | 52 | s | I | P | 9 | 52 |
| 10 | 48 | s | II | P | 10 | 56 |
| 11 | 37 | s | III | P | ||
| 12 | 55 | s | III | P | ||
| 13 | 53 | s | III | P | ||
| 14 | 58 | s | III | P | ||
| 15 | 45 | s | III | P | ||
| 16 | 53 | s | III | P | ||
| 17 | 68 | s | III | P | ||
| 18 | 58 | s | III | P | ||
| 19 | 38 | s | IV | P | ||
| 20 | 56 | s | IV | P | ||
| 21 | 40 | s | IV | P | ||
| 22 | 53 | s | III | W | ||
| 23 | 67 | s | III | M | ||
| 24 | 50 | s | III | M | ||
| 25 | 50 | s | III | P | ||
| 26 | 65 | s | III | M | ||
| 27 | 52 | s | III | M | ||
| 28 | 58 | s | IV | P | ||
| 29 | 47 | s | III | W | ||
| 30 | 57 | s | III | P | ||
| 31 | 63 | s | III | P | ||
| 32 | 62 | m | III | P | ||
| 33 | 47 | m | II | W | ||
| 34 | 48 | m | I | W | ||
| 35 | 47 | m | I | W | ||
| 36 | 66 | m | III | W | ||
| 37 | 64 | e | II | M | ||
| 38 | 78 | e | III | M | ||
| 39 | 66 | e | IV | P | ||
| 40 | 51 | e | II | P | ||
| 41 | 51 | o | I | P | ||
| 42 | 51 | o | IV | P |
a s, serous; m, mucinous; e, endometrioid; o, others.
b W, well; M, moderately; P, poorly.
Demethylation Treatment with 5-aza-dC3
T29H cells were placed in a 10-cm plate, incubated to 50% confluence, and then treated with 5-aza-dC. Growth medium was changed every 24 h. Cells were harvested after 4 days for RNA and DNA extraction, which was carried out using the TIANGEN kit (Beijing, China). The extracted RNA and DNA were then used for RRAD expression and promoter methylation analysis, respectively. Differences were analyzed by the paired t test using SPSS version 17.0 software. All samples were normalized to β-actin.
RNA Interference
T29 or T29H cells were seeded in 6-well plates at 2.5 × 10⁵ cells/well 1 h before transfection with siRNA and siPORTTM NeoFXTM agent (Invitrogen) according to the manufacturer's instructions. The cells were collected 72 h later. The small interfering RNAs siRRAD and the negative control siCONT were obtained from Invitrogen. HRasV12 siRNAs were purchased from Ambion (Austin, TX).
Real-time Reverse Transcription PCR (RT-PCR)
RNA was prepared using TRIzol reagent (Invitrogen) and treated with RNase-free DNase I (Fermentas, Glen Burnie, MD) for 30 min. The DNA-free RNA was reverse-transcribed using the Moloney murine leukemia virus reverse transcription kit (Promega, Madison, WI). A sample prepared in the absence of reverse transcriptase served as a negative control. SYBR Green real-time PCR was performed on an ABI PRISM 7300 sequence detection system (Applied Biosystems). Differences between samples were analyzed by independent sample t test using SPSS version 17.0 software. All samples were normalized to β-actin. The primer sequences for the glucose transporter have been described previously (29). The sequences of other primers used are listed in Table 3.
TABLE 3.
The siRNA target sequences and RT-PCR primer sequences
| siRNA target nucleotide sequences | |
|---|---|
| siCONT | Sense: 5′-UAACGACGCGACGACGUAATT-3′ |
| Antisense: 5′-UUACGUCGUCGCGUCGUUATT-3′ | |
| siRRAD | Sense: 5′-GCCGCAUCGUAGCUCGUAAtt-3′ |
| Antisense: 5′-UUACGAGCUACGAUGCGGCcc-3′ | |
| siHRasV12 | Sense: 5′-GGCGCCGUCGGUGUGGGCAAGtt-3′ |
| Antisense: 5′-AAAAAGGGCGCCGUCGGUGUGGGCAAGtt-3′ | |
| RT-PCR primer sequences | |
| RRAD | Sense: 5′-CCTGGTGCGCTCTCGTGAGGT-3′ |
| Antisense: 5′-GTGCCTGCTTGCCGTCGTG-3′ | |
| HRasV12 | Sense: 5′-GGGCGCCGTCGGTGTG-3′ |
| Antisense: 5′-TCCTGAGCCTGCCGAGATTCC-3′ | |
| HRas | Sense: 5′-GCACGCACTGTGGAATCTC-3′ |
| Antisense: 5′-CGGATCTCACGCACCAAC-3′ | |
| β-actin | Sense: 5′-GAGCTACGAGCTGCCTGACG-3′ |
| Antisense: 5′-GTAGTTTCGTGGATGCCACAG-3′ | |
| DNMT1 | Sense: 5′-CCGAGTTGGTGATGGTGTGTAC-3′ |
| Antisense: 5′-AGGTTGATGTCTGCGTGGTAGC-3′ | |
| DNMT3A | Sense: 5′-TATTGATGAGCGCACAAGAGAGC-3′ |
| Antisense: 5′-GGGTGTTCCAGGGTAACATTGAG-3′ | |
| DNMT3B | Sense: 5′-GACTTGGTGATTGGCGGAA-3′ |
| Antisense: 5′-GGCCCTGTGAGCAGCAGA-3′ | |
Western Blotting
Cells were collected and lysed as described (20). Lysates (80 μg) were separated by SDS-PAGE and immunoblotted with anti-RRAD antibody (Sigma). β-Actin was used as the loading control.
DNA Methytransferase (DNMT) Activity Assay
The nuclear extracts were prepared using the Nuclear Extraction kit (Epigentek), and then aliquotted and stored at −80 °C until the assay was performed. DNMT activity was measured using the DNMT Activity/Inhibition Assay Ultra kit (Epigentek), as described previously (30, 31). Briefly, 5-μg nuclear extracts for each assay were used as the start material, and the procedure was according to the manufacturer's instructions.
Glucose Uptake
Glucose uptake was determined as the accumulation of 2-deoxy-d-[3H]glucose (PerkinElmer Life Sciences). Briefly, cells were rinsed twice with PBS and incubated with insulin at 37 °C for 30 min. The cells were washed twice again with PBS and incubated with 2-deoxy-d-[3H]glucose (200 μm in PBS, 1 μCi/well) at 37 °C for 15 min. Cytochalasin B was used as a negative control. The reaction was terminated with three rapid washes in ice-cold PBS. The cells were lysed with 1% SDS and prepared for scintillation counting (MicroBeta-1450, PerkinElmer Life Sciences). Differences between samples were analyzed by independent sample Student's t test using SPSS version 17.0 software.
Lactate Production
Lactate was quantified as described previously (32). Briefly, overnight cultures were harvested and resuspended in phosphate buffer containing 1 mm EDTA and sonicated to disrupt the cells. The cell debris was removed, and serial dilutions of the suspension were assayed for lactate, using the lactate assay kit from BioVision (Milpitas, CA). Lactate production was normalized to cell number. Differences between samples were analyzed by independent sample t test using SPSS version 17.0 software.
Library Preparation and Sequencing of RRBS-seq
RRBS libraries were constructed for T29 and T29H cell lines, as described previously (33). Briefly, 500 ng of genomic DNA was digested with 20 units of MspI (New England Biolabs) in a 20-μl reaction for 20 h at 37 °C. After purification, the digested products were blunt-ended, and then dA was added, followed by methylated adapter (Illumina) ligation. To obtain DNA fractions in the 40–120 and 120–220 bp range of MspI-digested products, two ranges (160–240 and 240–340 bp) of adapter-ligated fractions were excised from 2% agarose gel. The size-selected DNA was bisulfite-treated for two rounds using the EpiTect bisulfite kit (Qiagen, Venlo, The Netherlands) following the manufacturer's standard protocol. The final libraries were generated by amplification with HiFi HotStart Uracil+ ReadyMix (Kapa Biosystems, Boston, MA), and Illumina Multiplexing PCR Primers. The quality and quantity of RRBS libraries were analyzed by an Agilent 2100 Bioanalyzer (Agilent Technologies, Santa Clara, CA) and RT-PCR, respectively. Finally, Illumina HiSeq 2000 was used to sequence the libraries according to the manufacturer's protocol.
RRBS-seq Data Analysis
For sequencing reads produced by HiSeq 2000, the low quality reads and adapter sequences were first removed from the raw reads. The quality of resulted clean reads was checked by FastQC (available on the World Wide Web). All bisulfite-treated short reads and human reference genome sequence were then converted to three-letter alphabet. The software SOAP2 (34) was used for the alignment of the transformed reads to the transformed reference genome sequence with two mismatches allowed in the seed (40 bp) (35). To identify the position of methylcytosines and the methylation pattern of each methylcytosine, BSMAP was used to process the alignment results to identify the methylcytosines where at least three reads were covered. The detailed annotation of methylcytosines was performed using RRBS-Analyzer software (36). The cytosine methylation pattern in CpG islands across T29 and T29H sequences was determined from the mapping reads of each sample. Based on the CpG methylation pattern, the differential methylation regions (DMRs) were then identified by RRBS-Analyzer (supplemental Table S1). Two biological replicates were carried out for each cell line, and about 3.50- and 4.40-Gb 100-bp paired-end data were generated for T29 and T29H in each replicate, respectively, of which about 80% can be uniquely mapped to the human genome (supplemental Table S2). The efficiency of bisulfite treatment was evaluated by calculating the C to T conversion rate for all cytosines in the CpH context (CpA, CpC, or CpT dinucleotides). It was shown that the bisulfite conversion rates of both libraries were at least 99.80% even if we assumed that all 5mC in CpH dinucleotides were due to conversion failure, which maintained the false positive rate below 0.5%. In addition, we observed that the Pearson correlations were about ∼0.95 within intrareplicate from both cell lines, indicating the high quality of our RRBS procedures (data not shown).
DGE Library Preparation and Sequencing
DGE libraries from both T29 and T29H cells were prepared by using the Illumina Gene Expression Sample Prep kit. Briefly, mRNA for each sample was reverse-transcripted to cDNA. Then the resulting cDNAs were ligated to sequencing adapters, and the products were purified and enriched with PCR to create the final cDNA libraries, which were then sequenced using the Illumina GAII System.
DGE Data Analysis
The raw data were initially filtered by removing adapters, empty reads, and low quality tags. All clean tags were then mapped to the human reference sequences using Bowtie (37) with a maximum 1-bp mismatch allowed. The clean tags that mapped to multiple sites of reference sequences were filtered, and the remaining clean tags were designated as unambiguous clean tags. The number of unambiguous clean tags for each gene was calculated and then normalized to number of transcripts per million clean tags (38). To compare the gene expression between T29 and T29H cells statistically, the false discovery rate was used to determine the statistical significance in multiple tests. An absolute value of the log2 ratio >1 and a false discovery rate <0.0001 were used as the thresholds to determine significant differences in gene expression (39). The differentially expressed genes were chosen for the KEGG pathway and GO enrichment analyses by using the ClueGO plugin in Cytossape. A Bonferroni corrected p value of <0.05 based on right-sided hypergeometric tests was selected as the threshold for significant pathway/GO enrichment of the gene sets.
Tumor Growth Assay
All animal experiments were approved by the Animal Care and Use Committee at the Institute of Psychology, Chinese Academy of Sciences (Beijing, China) and were conducted in accordance with the standard animal operating procedures by following the animal welfare guidelines. Cells (2.5 × 10⁶; T29H-G7, T29H-G8, T29, and T29H) were harvested and resuspended in 0.1 ml of PBS. The suspensions were then injected subcutaneously into the abdomen of 5-week-old male nude mice. Each treatment group contained five mice. Tumors were measured with calipers in three dimensions once a week. The entire experiment was halted 6 weeks later when all T29H-injected mice had a visible tumor (>15 mm) in a single dimension. Differences between groups of cells or between sets of in vitro experiments were analyzed by one-way analysis of variance and then by Student's t test.
Statistical Analysis
Expression differences in clinical tissue samples were analyzed by the non-parametric Mann-Whitney U test, using SPSS version 17.0 software. Data are displayed as means ± S.E. Statistical significance was accepted at p < 0.05 when compared with the corresponding control or as specifically indicated.
RESULTS
RRAD DNA Methylation Is Inversely Correlated with Expression in Cultured Ovarian Cell Models
To profile the Ras-regulated epigenome, we performed RRBS-seq, which allows quantitative measurement of the DNA methylation levels at single-base resolution in the T29 and T29H cell lines. It was revealed that our RRBS-seq data have covered 14.17 and 14.90% of all of the 56.33 million CpG in the whole human genome for T29 and T29H, respectively. For the CpG locating in the CpG islands, 46.91 and 47.35% of them have been covered.
DNA methylation changes within the promoter region of a given gene are likely to regulate its expression level. We then measured the mRNA expression profiles of T29 and T29H using the DGE method (40). Initially, a total of 6,341,442 and 5,747,842 raw sequence reads were produced for T29 and T29H, respectively. To determine the expression level of each gene, the counts of reads aligned to the human genome were calculated and normalized by the total reads of each cell line and standardized to reads per million. In comparison with T29, 1,963 differentially expressed genes, including 1,354 up-regulated genes and 609 down-regulated genes, were identified in T29H with at least 2-fold differences in expression level and false discovery rate value less than 0.0001 (supplemental Table S3). In addition, functional annotation of differentially expressed genes showed that they are enriched in multiple pathways (supplemental Table S4), most of which are involved in cancer and metabolism, including focal adhesion pathway (hsa04510), ribosome pathway (hsa03010), MAPK signaling pathway (hsa04010), PI3K-Akt signaling pathway (hsa04151), VEGF signaling pathway (hsa04370), and pathways in cancer (hsa05200), ECM-receptor interaction (hsa04512), glycosaminoglycan biosynthesis (hsa00532), and N-glycan biosynthesis (hsa00510). Our data suggest that Ras transformation affects diversified cancer-related signaling, which may contribute to the carcinogenesis of ovarian cancer.
Subsequently, we investigated the association between DNA methylation and gene expression by integrating the differentially expressed genes and DMRs occurring in the promoter (Fig. 1, A and B). Interestingly, we observed that the expression level of the RRAD gene was inversely correlated with DNA methylation level most significantly. In comparison with T29, the RRAD promoter region was ∼3.9-fold increased in methylation level and ∼7.5-fold decreased in gene expression level in T29H. By employing the bisulfite sequencing and RT-PCR, we confirmed that the RRAD CpG island in the promoter was highly methylated in T29H cells and hypomethylated in T29 cells (Fig. 1C). Consistent with these results, RRAD mRNA and its encoded protein levels were dramatically reduced in T29H versus T29 by 20-fold (Fig. 1, D and E).
FIGURE 1.

RRAD DNA methylation is inversely correlated with expression in cultured ovarian epithelial cells. A, starburst plot showing the association between DMRs in the promoter and the gene expression level. B, detailed view of DMR of RRAD from the RRBS-seq data. C, DNA methylation status of the RRAD promoter in T29 and T29H cells (***, p < 0.001). D, reduced RRAD mRNA levels in T29H versus T29 cells. E, reduced RRAD protein levels in T29H cells. Data are shown as means ± S.E. (error bars) (**, p < 0.01); β-actin was used as an internal control.
Epigenetic Inactivation of RRAD in Human Ovarian Cancer Tissues
We then characterized the RRAD promoter methylation status and the expression level in 42 human ovarian cancers and 10 normal ovarian tissues. As shown in Fig. 2A, RRAD promoter methylation was significantly increased in ovarian cancer versus normal ovarian tissues (p = 0.0045). The overall RRAD transcript levels were significantly reduced in tumor versus normal ovarian tissues (Fig. 2B). Because corresponding normal tissue could not be obtained from these 42 cancer patients, RRAD transcription was quantified in a mixture of 10 normal ovarian tissues and used as the reference (41). As shown in Fig. 2C, the majority (32 of 42) of the cancer tissues tested showed dramatically reduced RRAD transcription compared with that in the normal ovarian tissues. These observations suggest that RRAD is epigenetically inactivated in ovarian cancer tissues.
FIGURE 2.

RRAD promoter methylation is inversely correlated with expression in epithelial ovarian carcinoma. A, methylation status of the RRAD promoter region in normal tissues and epithelial ovarian carcinoma. Each filled bar represents the percentage of DNA methylation per CpG site, and the open bar represents the percentage of demethylated CpG at each corresponding site (**, p = 0.0045). B, overall comparison of relative RRAD mRNA levels in ovarian cancer (n = 42) and normal tissues (n = 10). Data are shown as means ± S.E. (error bars) (*, p < 0.05, Mann-Whitney U test). C, RRAD mRNA levels in individual cancer tissues and the reference tissue sample, which was mixed from 10 normal tissues.
RasV12-mediated Oncogenic Transformation Induces Promoter Hypermethylation and Represses RRAD Expression
To confirm that RRAD down-regulation in T29H cells was due to promoter hypermethylation, we treated T29H cells with the demethylating agent 5-aza-dC. Indeed, our results revealed that several “hot spots” in the RRAD promoter could be remarkably demethylated (at 68, 76, and 86 bp in our bisulfite sequencing region, Fig. 3A). Simultaneously, RRAD transcription and its protein levels were dramatically increased (Fig. 3, B and C). These results suggest that promoter hypermethylation represses RRAD expression in T29H cells. Moreover, the expression and activity in DNMTs were significantly increased in T29H cells compared with in T29 cells via RT-PCR and the DNMT activity assay (Fig. 3, D and F). Consistently, treatment with FTI-277, a specific Ras inhibitor, down-regulated the mRNA levels (Fig. 3E) and activities (Fig. 3F) of DNMTs, which was concomitant with an up-regulation of RRAD expression (Fig. 3G).
FIGURE 3.

Demethylation of RRAD in T29H by 5-aza-dC results in RRAD gene derepression. A, DNA methylation status of the RRAD promoter in 5-aza-dC-treated T29H cells. The red box marks the “hot spots” that are demethylated upon 5-aza-dC treatment (*, p = 0.027). B, relative RRAD mRNA levels after 5-aza-dC treatment. C, RRAD protein levels after treatment with 20 μm 5-aza-dC. D, DNMT mRNA levels in T29H. E, relative DNMT mRNA levels after FTI277 treatment. F, relative DNMT activity following FTI277 treatment. G, relative mRNA levels of RRAD following FTI277 treatment. β-Actin was used as a loading control. Data are shown as means ± S.E. (error bars) (*, p < 0.05; **, p < 0.01; ***, p < 0.001).
T29H cells are derived from T29 cells by introducing an oncogenic HRasV12. To exclude the possibility that the difference in promoter methylation and expression of RRAD is due to clonal variation, we transiently transfected T29 cells with pCMV-RasV12. As expected, RRAD transcript and protein levels were dramatically reduced upon overexpression of HRasV12 in comparison with the empty vector control by more than 3-fold (Fig. 4, A–C). A similar effect was observed in other cell lines (data not shown). In addition, Ras knockdown in T29H increased RRAD expression (Fig. 4, D–F).
FIGURE 4.

RRAD expression is regulated by HRasV12. A–C, overexpression of HRasV12 in T29 cells. A, HRasV12 transfection efficiency in T29 cells, measured by real-time RT-PCR. B and C, reduced protein (B) and mRNA (C) levels of RRAD in HRasV12-overexpressing T29 cells. D–F, siRNA knockdown of HRasV12 in T29H cells. D, transfection efficiency of HRasV12 siRNA in T29H cells. E and F, up-regulation of RRAD in HRasV12 knockdown T29H cells. E, protein level; F, relative RRAD transcript level. Data are shown as means ± S.E. (error bars) (**, p < 0.01).
RRAD Down-regulates Glucose Uptake and Lactate Production
In contrast to normal differentiated cells, which primarily rely on mitochondrial oxidative phosphorylation to generate the energy needed for cellular processes, most cancer cells rely on aerobic glycolysis, a phenomenon termed “the Warburg effect” (13). Aerobic glycolysis, which breaks down glucose to lactate, is an inefficient way to generate ATP. In general, cancer cells consume more glucose than normal cells to generate sufficient amounts of ATP, and increased glucose uptake and lactate production are hallmarks of cancer cells (13, 14). Therefore, we measured glucose uptake and lactate production in T29 and T29H cells. Our results revealed that RasV12-mediated oncogenic transformation led to an increase in glucose uptake and lactate production (Fig. 5A).
FIGURE 5.

RRAD inhibits glucose uptake and lactate production in ovarian epithelial cells. A, reduced glucose uptake and lactate production in T29 cells versus T29H cells that express lower levels of RRAD. B–D, increased glucose uptake and lactate production in siRRAD knockdown T29 cells. B, relative glucose and lactate levels. C, relative RRAD transcript level. D, RRAD protein expression level. E–G, significantly decreased glucose uptake and lactate production upon RRAD overexpression in T29H cells. E, relative glucose and lactate levels. F, relative RRAD transcript level. G, RRAD protein expression level. Data are means ± S.E. (error bars) (*, p < 0.05; **, p < 0.01).
Previous studies have shown that overexpression of RRAD in cultured adipocytes and muscle cells results in diminished insulin-stimulated glucose uptake (26), and overexpression of RRAD in muscle tissues of transgenic mice worsens diet-induced insulin resistance and glucose intolerance and reduces plasma triglyceride levels (27). We speculated that increased glucose uptake and lactate production are the consequences of RRAD down-regulation. To test this hypothesis, we knocked down RRAD in T29 cells and found that glucose uptake and lactate production were significantly increased (Fig. 5, B–D). Accordingly, overexpression of RRAD in T29H cells, which express relatively low levels of RRAD, led to a significant decrease in glucose uptake and lactate production (Fig. 5, E–G), suggesting that RRAD negatively influences aerobic glycolysis.
RRAD Suppresses the Expression of Glucose Transporters
Insulin positively regulates glucose uptake by inducing the expression of glucose transporters (42) and may also up-regulate RRAD (43, 44). Therefore, we addressed whether RRAD regulates the expression of glucose transporters. As shown in Fig. 6A, the expression levels of most glucose transporters were decreased in RRAD-overexpressing T29H cells. Consistent with the observation that RRAD was down-regulated in T29H cells as compared with T29 cells, we found that the expression levels of most glucose transporters were increased in T29H cells as compared with T29 cells (Fig. 6B). These results suggest that increased glucose consumption in RasV12-transformed ovarian epithelial cells is probably the consequence of up-regulation of glucose transporters induced by down-regulation of RRAD.
FIGURE 6.
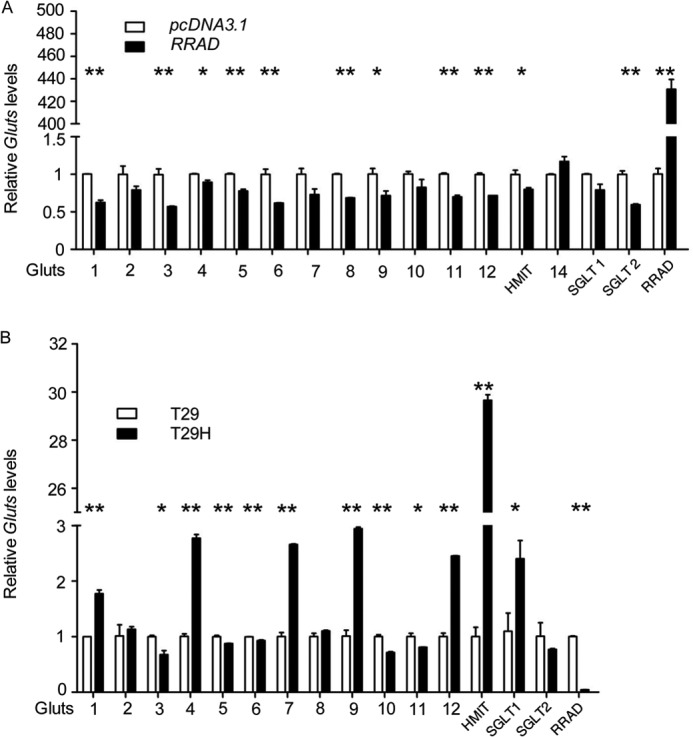
Glucose transporter expression in T29, T29H, and RRAD-overexpressing T29H cells. A, T29H cells were transfected with pCMV6-XL5 RRAD or pcDNA3.1, and the levels of glucose transporters were determined by real-time RT-PCR 48 h after transfection. B, real-time RT-PCR quantification of glucose transporters in T29 and T29H cells. Data are means ± S.E. (error bars) (*, p < 0.05; **, p < 0.01).
Overexpression of RRAD in T29H Cells Represses the Oncogenic Potential of RasV12
Aerobic glycolysis in cancer cells may facilitate the uptake and incorporation of nutrients into the biomass that are necessary for producing a new cell (13). We demonstrated that RasV12-mediated oncogenic transformation increased glucose uptake and lactate production by down-regulating RRAD expression. Therefore, RRAD derepression may inhibit the oncogenic potential of RasV12. To test this hypothesis, we generated two stable RRAD-overexpressing T29H cell lines, T29H-G7 and T29H-G8 (Fig. 7, A and B). As shown in Fig. 7C, glucose uptake and lactate production were inhibited in RRAD-overexpressing versus control T29H cells. We then inoculated T29, T29H, T29H-G7, and T29H-G8 cells into nude mice to examine the effect of RRAD on tumor formation. As reported previously (12), no tumors were observed in mice injected with T29 cells. However, tumor size was significantly smaller in mice inoculated with T29H-G7 and T29H-G8 cells than that in T29H-injected mice (Fig. 7, D–F). These results indicated that overexpression of RRAD in T29H cells inhibited the oncogenic potential of RasV12.
FIGURE 7.

RRAD reduces ovarian tumor growth in vivo. A, relative RRAD transcript levels in T29H and its stable RRAD-overexpressing derivatives G7 and G8. B, RRAD protein expression in T29H and its stable RRAD-overexpressing derivatives. C, reduced lactate production in stable RRAD-overexpressing T29H derivatives. D, representative images of mice in T29/T29H mouse models 6 weeks after subcutaneous injection. T29 did not form visible tumors; however, mice injected with T29H, T29H-G7, T29H-G8 all formed visible tumors. Due to image quality, images of only 3 mice per treatment are shown. E, quantification of tumor volume from subcutaneous injected athymic nude mice, n = 5. F, representative images of autopsied tumors from T29H, G7, and G8 subcutaneously injected athymic nude mice. Data are means ± S.E. (error bars) (**, p < 0.01).
DISCUSSION
Using a well defined human ovarian cancer model, we have demonstrated that RRAD expression was lower in T29H than in T29 cells due to promoter hypermethylation (Fig. 1). Knockdown of RasV12 in T29H cells resulted in up-regulation of the RRAD gene (Fig. 4). In addition, we found that DNMTs were up-regulated by RasV12 and that treatment with FTI-277, a specific Ras inhibitor, led to down-regulation of DNMTs in T29H cells (Fig. 3). Taken together, our data suggest that activation of the Ras pathway up-regulates the expression of DNMTs, and Ras-responsive transcription factors may recruit DNMTs to the RRAD promoter to induce DNA methylation.
We demonstrated that RRAD inhibited glucose uptake in ovarian epithelial cells (Fig. 5). Consistently, we showed that RRAD repressed lactate production. In addition, we showed that RRAD suppressed the expression of glucose transporters. Previous studies have demonstrated that RRAD is associated with calmodulin-dependent protein kinase II, cAMP-dependent protein kinase (PKA), protein kinase C (PKC), and casein kinase II and is phosphorylated by these protein kinases (45, 46). Interestingly, most of these protein kinases are involved in glucose metabolism. Activation of PKA and PKC increased the activity of the Na+-glucose cotransporter SGLT2 (47), and calmodulin-dependent protein kinase II positively regulates glucose uptake by affecting the GLUT4 (glucose transporter 4) expression level (48, 49). Therefore, it is tempting to speculate that RRAD may function downstream for these protein kinases and repress glucose uptake by inhibiting the expression or activities of glucose transporters.
It has been postulated that proliferating and cancer cells could choose glycolysis to efficiently prepare nutrients for fast cell growth (13, 14). Hirabayashi et al. (50) reported that a carbohydrate-rich diet promoted Ras/Src-mediated transformation in Drosophila and that transformed tumor tissues exhibit diet-mediated insulin sensitivity, increased glucose uptake activity, and resist apoptosis. They also demonstrated that acarbose and AD81 induce tumor cell apoptosis by targeting glucose uptake and Ras/Src AD81, respectively (50). We showed here that RasV12-transformed T29H cells could take up more glucose due to RRAD down-regulation, and overexpression of RRAD in T29H cells inhibited glucose uptake and hence reduced glycolysis (Fig. 5), which displayed a disadvantage for tumor growth. Consistent with this, we found that two stable RRAD-overexpressing T29H cells, T29H-G7 and T29H-G8, took up less glucose and produced less lactate than those T29H did (Fig. 6, A–C). In addition, they formed smaller tumors after injection into nude mice (Fig. 6, D–F). Considering that RRAD inhibited cell migration in vascular smooth muscle cells (51) and lung cancers (25) and that disruption of RRAD resulted in cell cycle arrest and senescence (20, 52), we propose that RRAD is a tumor suppressor gene, which may be a potential new anti-tumor target through regulating RRAD activity.
We also found that RRAD was epigenetically inactivated in ovarian cancer tissues (Fig. 2). The fact that the Ras mutation is found only in a certain subset of ovarian cancers (53) and ∼30% of other human cancers (1, 2) suggested that Ras mutation was not the only cause for RRAD epigenetic inactivation in cancer. Indeed, Hsiao et al. recently demonstrated that RRAD was a direct transcriptional target of p53 and that activation of p53 leads to up-regulation of RRAD (25). Considering the fact that p53 is frequently mutated in cancer cells, we speculate that loss of p53 function is another cause for RRAD down-regulation in tumor tissues. Further efforts should investigate whether mutation of other tumor suppressor genes or oncogenes regulates RRAD expression.
Additionally, we present the first methylome induced by oncogenic Ras through RRBS-seq analysis. 7,567 DMRs were identified (χ2 test, p < 0.01, Fold change ≥ 2) between T29 and T29H through comparison of the methylation levels. We found 1,737 genes, of which promoters were overlapped with DMRs. ClueGO analysis revealed that those genes were enriched in multiple pathways (Table 4), such as the neuroactive ligand-receptor interaction pathway (hsa04080), the calcium signaling pathway (hsa04020), the o-glycan biosynthesis pathway (hsa00512), the melanogenesis pathway (hsa04916), the basal cell carcinoma pathway (hsa05217), the fructose and mannose metabolism pathway (hsa00051), the Wnt signaling pathway (hsa04310), the MAPK signaling pathway (hsa04010), the hedgehog signaling pathway (hsa04340), and pathways in cancer (hsa05200; Table 5). Most of them were related to cancer and metabolism. Some of these pathways were reported in ovarian cancers by Huang et al. (54). Further, the comparison of the methylation level between T29 and T29H revealed that T29H had slight decrease in the methylation level of C and CpG (Fig. 8A), which has been confirmed by the global DNA methylation analysis by the LC-MS/MS method (Fig. 8B). The global hypomethylated status in T29H cells was consistent with previous studies in cancers (55), and it further indicated that T29H is a well defined model for human ovarian cancer study.
TABLE 4.
The distribution of identified DMRs in different genomic features in T29 and T29H
| Genomic feature | Hypomethylated (T29 > T29H) | Hypermethylated (T29 < T29H) |
|---|---|---|
| Total DMRs | 5,416 | 2,989 |
| 3′-UTR | 84 | 94 |
| 5′-UTR | 581 | 686 |
| CDS | 699 | 649 |
| Intron | 1,002 | 1,147 |
| Promoter | 707 | 1,030 |
| CGI | 1,773 | 1,867 |
| CGI shore | 2,056 | 1,716 |
| Pseudogene | 142 | 32 |
| Intergenic | 1,489 | 1,439 |
| SINE | 1,396 | 506 |
| LINE | 214 | 99 |
| LTR | 325 | 67 |
| Satellite | 97 | 12 |
| Low complexity | 1,044 | 1,054 |
| Simple repeat | 531 | 448 |
TABLE 5.
The enriched KEGG term of genes associated with DMRs in the promoter region in T29 and T29H
| ID | KEGG term | Gene count | Percentage | p value |
|---|---|---|---|---|
| % | ||||
| hsa05032 | Morphine addiction | 25 | 26.88 | 3.57E−08 |
| hsa04080 | Neuroactive ligand-receptor interaction | 45 | 16.36 | 2.10E−06 |
| hsa05033 | Nicotine addiction | 13 | 32.50 | 7.45E−06 |
| hsa05217 | Basal cell carcinoma | 15 | 27.27 | 1.66E−05 |
| hsa04015 | Rap1 signaling pathway | 34 | 15.96 | 6.44E−05 |
| hsa05205 | Proteoglycans in cancer | 35 | 15.56 | 8.66E−05 |
| hsa04010 | MAPK signaling pathway | 38 | 14.79 | 1.31E−04 |
| hsa05412 | ARVC | 16 | 21.62 | 1.87E−04 |
| hsa04727 | GABAergic synapse | 18 | 20.00 | 2.16E−04 |
| hsa04340 | Hedgehog signaling pathway | 12 | 23.53 | 5.23E−04 |
| hsa04724 | Glutamatergic synapse | 20 | 17.24 | 7.65E−04 |
| hsa04916 | Melanogenesis | 18 | 17.82 | 9.30E−04 |
| hsa05034 | Alcoholism | 27 | 15.00 | 9.78E−04 |
| hsa04390 | Hippo signaling pathway | 24 | 15.58 | 0.001073 |
| hsa04723 | Retrograde endocannabinoid signaling | 18 | 17.48 | 0.001178 |
| hsa05030 | Cocaine addiction | 11 | 22.00 | 0.001605 |
| hsa04810 | Regulation of actin cytoskeleton | 30 | 13.95 | 0.00172 |
| hsa04950 | Maturity onset diabetes of the young | 7 | 28.00 | 0.00268 |
| hsa05200 | Pathways in cancer | 40 | 12.23 | 0.003976 |
| hsa04310 | Wnt signaling pathway | 20 | 14.39 | 0.006861 |
| hsa04725 | Cholinergic synapse | 17 | 15.04 | 0.007869 |
| hsa04726 | Serotonergic synapse | 17 | 14.91 | 0.008587 |
| hsa00512 | Mucin type O-Glycan biosynthesis | 7 | 22.58 | 0.009653 |
| hsa04144 | Endocytosis | 26 | 12.81 | 0.01052 |
| hsa05414 | Dilated cardiomyopathy | 14 | 15.56 | 0.011398 |
| hsa04151 | PI3K-Akt signaling pathway | 39 | 11.27 | 0.016555 |
| hsa03320 | PPAR signaling pathway | 11 | 15.94 | 0.01981 |
| hsa04713 | Circadian entrainment | 14 | 14.43 | 0.021138 |
| hsa04020 | Calcium signaling pathway | 22 | 12.15 | 0.030355 |
| hsa05410 | Hypertrophic cardiomyopathy | 12 | 14.46 | 0.031031 |
| hsa04510 | Focal adhesion | 24 | 11.65 | 0.038 |
| hsa04014 | Ras signaling pathway | 26 | 11.45 | 0.038046 |
| hsa05031 | Amphetamine addiction | 10 | 14.71 | 0.042124 |
| hsa04360 | Axon guidance | 16 | 12.60 | 0.044801 |
| hsa05166 | HTLV-I infection | 29 | 11.03 | 0.0455 |
FIGURE 8.
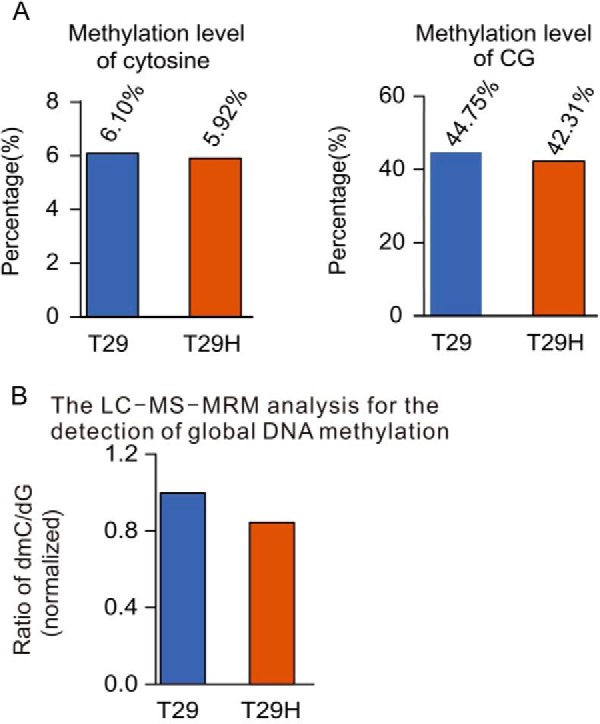
Genomic landscape of DNA methylation in T29 and T29H determined by RRBS-seq. A, the overall methylated level of C and CG in T29 and T29H. B, global DNA methylation analysis of methylated level in T29 and T29H using the LC-MS/MS method.
In summary, we showed that RasV12-mediated oncogenic transformation caused epigenetic inactivation of the RRAD gene and that down-regulation of RRAD led to an increase in glucose uptake, which may be associated with the unique metabolic feature of tumor cells, aerobic glycolysis. Overexpression of RRAD in RasV12-transformed ovarian epithelial cells repressed their oncogenic potential. Therefore, our results suggest that down-regulation of RRAD confers advantages to the proliferation of RasV12-transformed ovarian epithelial cells.
Acknowledgments
We thank Drs. Jinsong Liu (University of Texas M.D. Anderson Cancer Center) and Jie Du (Beijing Anzhen Hospital, Chinese Capital Medical University) for providing T29 and T29H cell lines. We thank Prof. Zhihai Qin and Dr. Jizhou Lv (Institute of Biophysics, Chinese Academy of Sciences) for expert help in the [3H]glucose uptake assay and Dr. Yi-Ping Li (University of Alabama at Birmingham) and Dr. Scott Edmunds (Beijing Genomics Institute) for critical review of the manuscript.
This work was supported by Natural Science Foundation of China (NSFC)-Canadian Institutes of Health Research Collaborative Research Project Grant 81161120541, National High-tech R&D Program Grant 2012AA02A202, NSFC Grants 31171236/C060503 and 31200976, Zhejiang Provincial Natural Science Foundation of China Grant Z2110521, and the Innovation Center China of AstraZeneca.

This article contains supplemental Tables S1–S4.
- 5-aza-dC
- 5-aza-2′-deoxycytidine
- RRBS-seq
- reduced representation bisulfite sequencing
- DNMT
- DNA methytransferase
- DGE
- digital gene expression
- DMR
- differential methylation region.
REFERENCES
- 1. Bos J. L. (1989) ras oncogenes in human cancer: a review. Cancer Res. 49, 4682–4689 [PubMed] [Google Scholar]
- 2. Wittinghofer A. (1998) Signal transduction via Ras. Biol. Chem. 379, 933–937 [PubMed] [Google Scholar]
- 3. Shiraha H., Yamamoto K., Namba M. (2013) Human hepatocyte carcinogenesis (review). Int. J. Oncol. 42, 1133–1138 [DOI] [PMC free article] [PubMed] [Google Scholar]
- 4. Murati A., Brecqueville M., Devillier R., Mozziconacci M. J., Gelsi-Boyer V., Birnbaum D. (2012) Myeloid malignancies: mutations, models and management. BMC Cancer 12, 304. [DOI] [PMC free article] [PubMed] [Google Scholar]
- 5. Rusconi P., Caiola E., Broggini M. (2012) RAS/RAF/MEK inhibitors in oncology. Curr. Med. Chem. 19, 1164–1176 [DOI] [PubMed] [Google Scholar]
- 6. Tartaglia M., Gelb B. D. (2010) Disorders of dysregulated signal traffic through the RAS-MAPK pathway: phenotypic spectrum and molecular mechanisms. Ann. N.Y. Acad. Sci. 1214, 99–121 [DOI] [PMC free article] [PubMed] [Google Scholar]
- 7. Young T. W., Mei F. C., Yang G., Thompson-Lanza J. A., Liu J., Cheng X. (2004) Activation of antioxidant pathways in ras-mediated oncogenic transformation of human surface ovarian epithelial cells revealed by functional proteomics and mass spectrometry. Cancer Res. 64, 4577–4584 [DOI] [PubMed] [Google Scholar]
- 8. Singer G., Oldt R., 3rd, Cohen Y., Wang B. G., Sidransky D., Kurman R. J., Shih I. M. (2003) Mutations in BRAF and KRAS characterize the development of low-grade ovarian serous carcinoma. J. Natl. Cancer Inst. 95, 484–486 [DOI] [PubMed] [Google Scholar]
- 9. Varras M. N., Sourvinos G., Diakomanolis E., Koumantakis E., Flouris G. A., Lekka-Katsouli J., Michalas S., Spandidos D. A. (1999) Detection and clinical correlations of ras gene mutations in human ovarian tumors. Oncology 56, 89–96 [DOI] [PubMed] [Google Scholar]
- 10. Young T., Mei F., Liu J., Bast R. C., Jr., Kurosky A., Cheng X. (2005) Proteomics analysis of H-RAS-mediated oncogenic transformation in a genetically defined human ovarian cancer model. Oncogene 24, 6174–6184 [DOI] [PMC free article] [PubMed] [Google Scholar]
- 11. Mei F. C., Young T. W., Liu J., Cheng X. (2006) RAS-mediated epigenetic inactivation of OPCML in oncogenic transformation of human ovarian surface epithelial cells. FASEB J. 20, 497–499 [DOI] [PubMed] [Google Scholar]
- 12. Liu J., Yang G., Thompson-Lanza J. A., Glassman A., Hayes K., Patterson A., Marquez R. T., Auersperg N., Yu Y., Hahn W. C., Mills G. B., Bast R. C., Jr. (2004) A genetically defined model for human ovarian cancer. Cancer Res. 64, 1655–1663 [DOI] [PubMed] [Google Scholar]
- 13. Vander Heiden M. G., Cantley L. C., Thompson C. B. (2009) Understanding the Warburg effect: the metabolic requirements of cell proliferation. Science 324, 1029–1033 [DOI] [PMC free article] [PubMed] [Google Scholar]
- 14. Hirschhaeuser F., Sattler U. G., Mueller-Klieser W. (2011) Lactate: a metabolic key player in cancer. Cancer Res. 71, 6921–6925 [DOI] [PubMed] [Google Scholar]
- 15. DeBerardinis R. J., Lum J. J., Hatzivassiliou G., Thompson C. B. (2008) The biology of cancer: metabolic reprogramming fuels cell growth and proliferation. Cell Metab. 7, 11–20 [DOI] [PubMed] [Google Scholar]
- 16. Christofk H. R., Vander Heiden M. G., Harris M. H., Ramanathan A., Gerszten R. E., Wei R., Fleming M. D., Schreiber S. L., Cantley L. C. (2008) The M2 splice isoform of pyruvate kinase is important for cancer metabolism and tumour growth. Nature 452, 230–233 [DOI] [PubMed] [Google Scholar]
- 17. Altenberg B., Greulich K. O. (2004) Genes of glycolysis are ubiquitously overexpressed in 24 cancer classes. Genomics 84, 1014–1020 [DOI] [PubMed] [Google Scholar]
- 18. Reynet C., Kahn C. R. (1993) Rad: a member of the Ras family overexpressed in muscle of type II diabetic humans. Science 262, 1441–1444 [DOI] [PubMed] [Google Scholar]
- 19. Mo Y., Midorikawa K., Zhang Z., Zhou X., Ma N., Huang G., Hiraku Y., Oikawa S., Murata M. (2012) Promoter hypermethylation of Ras-related GTPase gene RRAD inactivates a tumor suppressor function in nasopharyngeal carcinoma. Cancer Lett. 323, 147–154 [DOI] [PubMed] [Google Scholar]
- 20. Tseng Y. H., Vicent D., Zhu J., Niu Y., Adeyinka A., Moyers J. S., Watson P. H., Kahn C. R. (2001) Regulation of growth and tumorigenicity of breast cancer cells by the low molecular weight GTPase Rad and nm23. Cancer Res. 61, 2071–2079 [PubMed] [Google Scholar]
- 21. Suzuki M., Shigematsu H., Shames D. S., Sunaga N., Takahashi T., Shivapurkar N., Iizasa T., Minna J. D., Fujisawa T., Gazdar A. F. (2007) Methylation and gene silencing of the Ras-related GTPase gene in lung and breast cancers. Ann. Surg. Oncol. 14, 1397–1404 [DOI] [PubMed] [Google Scholar]
- 22. Suzuki M., Toyooka S., Shivapurkar N., Shigematsu H., Miyajima K., Takahashi T., Stastny V., Zern A. L., Fujisawa T., Pass H. I., Carbone M., Gazdar A. F. (2005) Aberrant methylation profile of human malignant mesotheliomas and its relationship to SV40 infection. Oncogene 24, 1302–1308 [DOI] [PubMed] [Google Scholar]
- 23. Suzuki M., Shigematsu H., Shivapurkar N., Reddy J., Miyajima K., Takahashi T., Gazdar A. F., Frenkel E. P. (2006) Methylation of apoptosis related genes in the pathogenesis and prognosis of prostate cancer. Cancer Lett. 242, 222–230 [DOI] [PubMed] [Google Scholar]
- 24. Sova P., Feng Q., Geiss G., Wood T., Strauss R., Rudolf V., Lieber A., Kiviat N. (2006) Discovery of novel methylation biomarkers in cervical carcinoma by global demethylation and microarray analysis. Cancer Epidemiol. Biomarkers Prev. 15, 114–123 [DOI] [PubMed] [Google Scholar]
- 25. Hsiao B. Y., Chen C. C., Hsieh P. C., Chang T. K., Yeh Y. C., Wu Y. C., Hsu H. S., Wang F. F., Chou T. Y. (2011) Rad is a p53 direct transcriptional target that inhibits cell migration and is frequently silenced in lung carcinoma cells. J. Mol. Med. 89, 481–492 [DOI] [PubMed] [Google Scholar]
- 26. Moyers J. S., Bilan P. J., Reynet C., Kahn C. R. (1996) Overexpression of Rad inhibits glucose uptake in cultured muscle and fat cells. J. Biol. Chem. 271, 23111–23116 [DOI] [PubMed] [Google Scholar]
- 27. Ilany J., Bilan P. J., Kapur S., Caldwell J. S., Patti M. E., Marette A., Kahn C. R. (2006) Overexpression of Rad in muscle worsens diet-induced insulin resistance and glucose intolerance and lowers plasma triglyceride level. Proc. Natl. Acad. Sci. U.S.A. 103, 4481–4486 [DOI] [PMC free article] [PubMed] [Google Scholar]
- 28. Weisenberger D. J. (2014) Characterizing DNA methylation alterations from The Cancer Genome Atlas. J. Clin. Invest. 124, 17–23 [DOI] [PMC free article] [PubMed] [Google Scholar]
- 29. Pyla R., Poulose N., Jun J. Y., Segar L. (2013) Expression of conventional and novel glucose transporters, GLUT1, -9, -10, and -12, in vascular smooth muscle cells. Am. J. Physiol. Cell Physiol. 304, C574–C589 [DOI] [PMC free article] [PubMed] [Google Scholar]
- 30. Gao F., Liu X., Wu X. P., Wang X. L., Gong D., Lu H., Xia Y., Song Y., Wang J., Du J., Liu S., Han X., Tang Y., Yang H., Jin Q., Zhang X., Liu M. (2012) Differential DNA methylation in discrete developmental stages of the parasitic nematode Trichinella spiralis. Genome Biol. 13, R100. [DOI] [PMC free article] [PubMed] [Google Scholar]
- 31. Yang J., Corsello T. R., Ma Y. (2012) Stem cell gene SALL4 suppresses transcription through recruitment of DNA methyltransferases. J. Biol. Chem. 287, 1996–2005 [DOI] [PMC free article] [PubMed] [Google Scholar]
- 32. Marbach E. P., Weil M. H. (1967) Rapid enzymatic measurement of blood lactate and pyruvate: use and significance of metaphosphoric acid as a common precipitant. Clin. Chem. 13, 314–325 [PubMed] [Google Scholar]
- 33. Gu H., Bock C., Mikkelsen T. S., Jäger N., Smith Z. D., Tomazou E., Gnirke A., Lander E. S., Meissner A. (2010) Genome-scale DNA methylation mapping of clinical samples at single-nucleotide resolution. Nat. Methods 7, 133–136 [DOI] [PMC free article] [PubMed] [Google Scholar]
- 34. Li R., Li Y., Kristiansen K., Wang J. (2008) SOAP: short oligonucleotide alignment program. Bioinformatics 24, 713–714 [DOI] [PubMed] [Google Scholar]
- 35. Li Y., Zhu J., Tian G., Li N., Li Q., Ye M., Zheng H., Yu J., Wu H., Sun J., Zhang H., Chen Q., Luo R., Chen M., He Y., Jin X., Zhang Q., Yu C., Zhou G., Sun J., Huang Y., Zheng H., Cao H., Zhou X., Guo S., Hu X., Li X., Kristiansen K., Bolund L., Xu J., Wang W., Yang H., Wang J., Li R., Beck S., Wang J., Zhang X. (2010) The DNA methylome of human peripheral blood mononuclear cells. PLoS Biol. 8, e1000533. [DOI] [PMC free article] [PubMed] [Google Scholar]
- 36. Wang T., Liu Q., Li X., Wang X., Li J., Zhu X., Sun Z. S., Wu J. (2013) RRBS-Analyser: a comprehensive web server for reduced representation bisulfite sequencing data analysis. Hum. Mutat. 34, 1606–1610 [DOI] [PubMed] [Google Scholar]
- 37. Langmead B., Trapnell C., Pop M., Salzberg S. L. (2009) Ultrafast and memory-efficient alignment of short DNA sequences to the human genome. Genome Biol. 10, R25. [DOI] [PMC free article] [PubMed] [Google Scholar]
- 38. Morrissy A. S., Morin R. D., Delaney A., Zeng T., McDonald H., Jones S., Zhao Y., Hirst M., Marra M. A. (2009) Next-generation tag sequencing for cancer gene expression profiling. Genome Res. 19, 1825–1835 [DOI] [PMC free article] [PubMed] [Google Scholar]
- 39. Audic S., Claverie J. M. (1997) The significance of digital gene expression profiles. Genome Res. 7, 986–995 [DOI] [PubMed] [Google Scholar]
- 40. Noushmehr H., Weisenberger D. J., Diefes K., Phillips H. S., Pujara K., Berman B. P., Pan F., Pelloski C. E., Sulman E. P., Bhat K. P., Verhaak R. G., Hoadley K. A., Hayes D. N., Perou C. M., Schmidt H. K., Ding L., Wilson R. K., Van Den Berg D., Shen H., Bengtsson H., Neuvial P., Cope L. M., Buckley J., Herman J. G., Baylin S. B., Laird P. W., Aldape K., and Cancer Genome Atlas Research Network (2010) Identification of a CpG island methylator phenotype that defines a distinct subgroup of glioma. Cancer Cell 17, 510–522 [DOI] [PMC free article] [PubMed] [Google Scholar]
- 41. Wei S. H., Chen C. M., Strathdee G., Harnsomburana J., Shyu C. R., Rahmatpanah F., Shi H., Ng S. W., Yan P. S., Nephew K. P., Brown R., Huang T. H. (2002) Methylation microarray analysis of late-stage ovarian carcinomas distinguishes progression-free survival in patients and identifies candidate epigenetic markers. Clin. Cancer Res. 8, 2246–2252 [PubMed] [Google Scholar]
- 42. Cormont M., Le Marchand-Brustel Y. (2001) The role of small G-proteins in the regulation of glucose transport (review). Mol. Membr. Biol. 18, 213–220 [DOI] [PubMed] [Google Scholar]
- 43. Laville M., Auboeuf D., Khalfallah Y., Vega N., Riou J. P., Vidal H. (1996) Acute regulation by insulin of phosphatidylinositol-3-kinase, Rad, Glut 4, and lipoprotein lipase mRNA levels in human muscle. J. Clin. Invest. 98, 43–49 [DOI] [PMC free article] [PubMed] [Google Scholar]
- 44. Ducluzeau P. H., Perretti N., Laville M., Andreelli F., Vega N., Riou J. P., Vidal H. (2001) Regulation by insulin of gene expression in human skeletal muscle and adipose tissue. Evidence for specific defects in type 2 diabetes. Diabetes 50, 1134–1142 [DOI] [PubMed] [Google Scholar]
- 45. Moyers J. S., Zhu J., Kahn C. R. (1998) Effects of phosphorylation on function of the Rad GTPase. Biochem. J. 333, 609–614 [DOI] [PMC free article] [PubMed] [Google Scholar]
- 46. Zhu J., Reynet C., Caldwell J. S., Kahn C. R. (1995) Characterization of Rad, a new member of Ras/GTPase superfamily, and its regulation by a unique GTPase-activating protein (GAP)-like activity. J. Biol. Chem. 270, 4805–4812 [DOI] [PubMed] [Google Scholar]
- 47. Ghezzi C., Wright E. M. (2012) Regulation of the human Na+-dependent glucose cotransporter hSGLT2. Am. J. Physiol. Cell Physiol. 303, C348–C354 [DOI] [PMC free article] [PubMed] [Google Scholar]
- 48. Ojuka E. O., Goyaram V., Smith J. A. (2012) The role of CaMKII in regulating GLUT4 expression in skeletal muscle. Am. J. Physiol. 303, E322–E331 [DOI] [PubMed] [Google Scholar]
- 49. Ozcan L., Wong C. C., Li G., Xu T., Pajvani U., Park S. K., Wronska A., Chen B. X., Marks A. R., Fukamizu A., Backs J., Singer H. A., Yates J. R., 3rd, Accili D., Tabas I. (2012) Calcium signaling through CaMKII regulates hepatic glucose production in fasting and obesity. Cell Metab. 15, 739–751 [DOI] [PMC free article] [PubMed] [Google Scholar]
- 50. Hirabayashi S., Baranski T. J., Cagan R. L. (2013) Transformed Drosophila cells evade diet-mediated insulin resistance through wingless signaling. Cell 154, 664–675 [DOI] [PMC free article] [PubMed] [Google Scholar]
- 51. Fu M., Zhang J., Tseng Y. H., Cui T., Zhu X., Xiao Y., Mou Y., De Leon H., Chang M. M., Hamamori Y., Kahn C. R., Chen Y. E. (2005) Rad GTPase attenuates vascular lesion formation by inhibition of vascular smooth muscle cell migration. Circulation 111, 1071–1077 [DOI] [PubMed] [Google Scholar]
- 52. Lee I., Yeom S. Y., Lee S. J., Kang W. K., Park C. (2010) A novel senescence-evasion mechanism involving Grap2 and cyclin D interacting protein inactivation by Ras associated with diabetes in cancer cells under doxorubicin treatment. Cancer Res. 70, 4357–4365 [DOI] [PubMed] [Google Scholar]
- 53. Kalamanathan S., Bates V., Lord R., Green J. A. (2011) The mutational profile of sporadic epithelial ovarian carcinoma. Anticancer Res. 31, 2661–2668 [PubMed] [Google Scholar]
- 54. Huang R. L., Gu F., Kirma N. B., Ruan J., Chen C. L., Wang H. C., Liao Y. P., Chang C. C., Yu M. H., Pilrose J. M., Thompson I. M., Huang H. C., Huang T. H., Lai H. C., Nephew K. P. (2013) Comprehensive methylome analysis of ovarian tumors reveals hedgehog signaling pathway regulators as prognostic DNA methylation biomarkers. Epigenetics 8, 624–634 [DOI] [PMC free article] [PubMed] [Google Scholar]
- 55. Zeimet A. G., Fiegl H., Goebel G., Kopp F., Allasia C., Reimer D., Steppan I., Mueller-Holzner E., Ehrlich M., Marth C. (2011) DNA ploidy, nuclear size, proliferation index and DNA-hypomethylation in ovarian cancer. Gynecol. Oncol. 121, 24–31 [DOI] [PMC free article] [PubMed] [Google Scholar]