

Abstract
Ancillary investigations are the backbone of uveitis workup for posterior segment inflammations. They help in establishing the differential diagnosis and making certain diagnosis by ruling out certain pathologies and are a useful aid in monitoring response to therapy during follow-up. These investigations include fundus photography including ultra wide field angiography, fundus autofluorescence imaging, fluorescein angiography, optical coherence tomography and multimodal imaging. This review aims to be an overview describing the role of these retinal investigations for posterior uveitis.
Keywords: Retina, Uveitis, Imaging, Differential diagnosis
Introduction
Retinal imaging is very useful in diagnosing pathologies and monitoring inflammatory diseases of the posterior segment. The most commonly used retinal imaging techniques in uveitis include fundus photography, fundus fluorescein angiography (FFA), fundus autofluorescence (FAF), optical coherence tomography (OCT) and ultrasonography for posterior segment inflammatory conditions.
The current review aims to be an overview describing the role of each of these ancillary ocular imaging in the posterior segment uveitis diagnosis, evaluation and progression monitoring.
Color fundus photography
Color fundus photographs help in documenting the retinal and/or choroidal lesions and serves as a useful permanent document for monitoring the progression or regression of the disease by thumb nailing the images of different visits. Parnell et al.1 showed a good agreement between the retina specialists for interpretation of retinal photographs distinguishing presumed ocular histoplasmosis and multifocal choroiditis without the need for any additional ancillary tests. However, a recent study reported a limited utility of fundus imaging alone in distinguishing different conditions in uveitis, using open software source.2
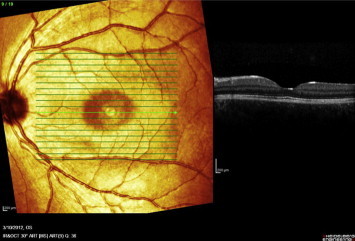
Nevertheless, fundus photography is routinely useful in most of the cases of posterior uveitides for documenting the lesions at baseline and follow up (Fig. 1). Stereo photographs may be useful in cases with exudative retinal detachment, optic disk edema, macular and choroidal neovascularization. The documentation by color photography is particularly useful in monitoring retinitis, choroiditis, macular edema, epiretinal membranes, parasitic infections like toxocariasis, cysticercosis, onchocerciasis; masquerade syndromes, retinal vasculitis, and also for assessing media clarity in eyes with vitritis.3
Figure 1.
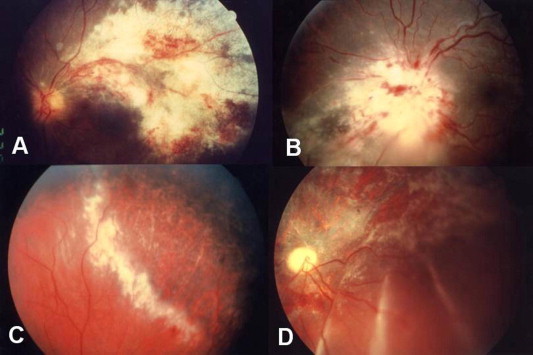
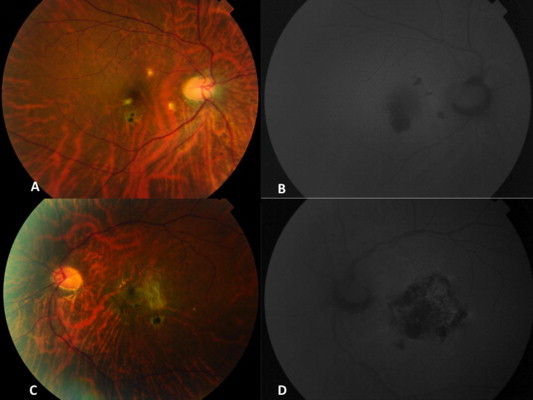
Cytomegalovirus (CMV) retinitis is characterized by a necrotizing retinitis with superficial hemorrhages and absent or mild intraocular inflammation. (A) Along the vascular arcades. (B) At the optic disk. (C) At the periphery of the retina. (D) Healed CMV retinitis associated with retinal detachment.
Fundus fluorescein angiography
Fundus fluorescein angiography (FFA) is useful in differentiating active from inactive uveitis and also confirming the diagnosis of co-existent pathologies like cystoid macular edema, choroidal neovascularization, subtle retinal vasculitis, to monitor response to therapy, and identifying the areas of capillary non-perfusion as well as retinal neovascularization.
The small molecules of free unbound fluorescein dye leak out even from minimally inflamed retinal vessels including capillaries, thus making it an investigation of choice for retinitis and retinal vasculitis.4 Illjima et al.5 reported following characteristics of acute ocular toxoplasmic retinochoroiditis that include a hyperfluorescent lesion with central hypofluorescence (double ring sign); the arterial occlusion passing through the necrotic lesion showing a dark silhouette; venous dilation and leakage and optic disk staining with dye leak.
Staining and leakage of dye from retinal vasculature (arteries, veins or capillaries) either focal or diffuse indicating active retinal vasculitis occurs in several inflammatory conditions including syphilis, toxoplasmosis, tuberculosis, sarcoidosis, systemic lupus erythematosis, Behçet’s disease, Birdshot chorioretinopathy, acute retinal necrosis, idiopathic retinal vasculitis, aneurysms and neuroretinitis (IRVAN), frosted branch angiitis, and Eales’ disease (Figs. 2 and 3) FFA is particularly useful in the diagnosis and evaluation of the subclinical retinal capillary involvement and monitoring response to therapy during the follow-up in disease like Behçet’s.6
Figure 2.
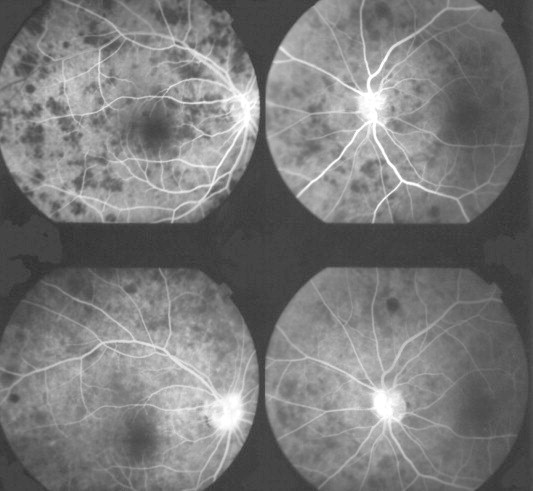
Cryptoccocal choroiditis in an AIDS patient. Fluorescein angiogram confirmed the presence of rounded lesions that were located underneath the neuroretina. These lesions masked fluorescence early during the study (top pictures). There was no significant leakage in the late stages of the angiogram although some late hyperflourescence may be seen on the nasal aspect of the optic disk in both eyes (bottom pictures).
Figure 3.
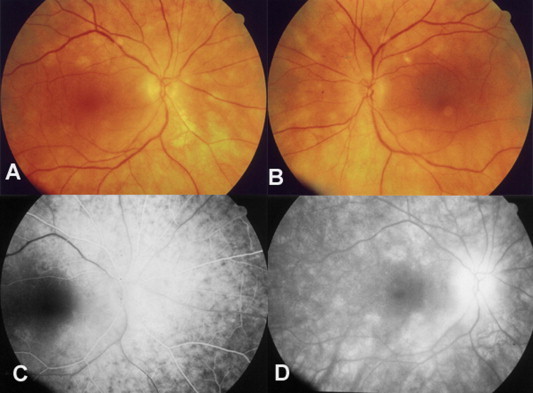
Birdshot retinochoroidopathy. (A and B) Color fundus photo of the right and left eye respectively. (C) Early fluorescein angiography with choroidal infiltration and minimal retinal pigment epithelium atrophy, the spots are hypofluorescent. (D) The lesions become mildly hyperfluorescent in the late phases of the study as dye from the choriocapillaris stains the extrachoroidal vascular space.
FFA has been commonly used in the past to document the characteristic “petalloid” pattern of parafoveal hyperfluorescence in eyes with uveitic cystoid macular edema (CME).4 CME has been angiographically graded into the following grades by Miyake7:Grade 0: no sign of fluorescein leakage; Grade I: slight fluorescein leakage into cystic spaces but not enough to enclose the entire fovea centralis; Grade II: complete circular accumulation of the fluorescein in the cystic space but its diameter is smaller than 2 mm; and Grade III: the circular accumulation of fluorescein is larger than 2.0 mm in diameter.
In 1984, Yannuzzi8 proposed a slightly different classification as follows:Grade 0: no perifoveal hyperfluorescence; Grade 1: incomplete perifoveal hyperfluorescence; Grade 2: mild 360 degree hyperfluorescence; Grade 3: moderate hyperfluorescent area being approximately 1 disk diameter across; and Grade 4: severe 360° hyperfluorescence with the hyperfluorescent area being approximately 1.5 disk diameter across.
Few recent studies compared FFA and OCT for macular edema and reported OCT to be equivalent or superior to FFA in diagnosing macular edema.9,10 A recent study compared both FFA and OCT and reported discrepant results in 4% of 112 enrolled eyes. The discrepancy was seen in 50% of eyes with Birdshot chorioretinopathy and occurred more frequently in intermediate uveitis. The authors concluded that both FFA and OCT were complementary and that revealed different pathophysiologic aspects of uveitic diseases.11 In addition, a recent report by MUST Trial Research group12 compared these two modalities and found only moderate agreement between these. Overall OCT was able to diagnose edema in 90.4% of cases compared to FA or biomicroscopy that gave useful information only in 77% and 76% respectively. Also OCT had a limitation in terms that it was not able to pick up macular leakage and thus in cases where treatment may need to be modified based on that finding, FFA is recommended in addition to OCT.12
FFA is still the most commonly used investigation in the evaluation of retinal ischemia, associated macroaneurysms, central retinal vein or artery occlusion in eyes with retinal vasculitis. FFA helps in demarcating the areas of capillary non-perfusion commonly associated with occlusive retinal periphlebitis seen in tuberculosis, sarcoidosis, Behçet’s disease, Tuberculoprotein hypersensitivity (Eales disease), and idiopathic vasculitis.13–16
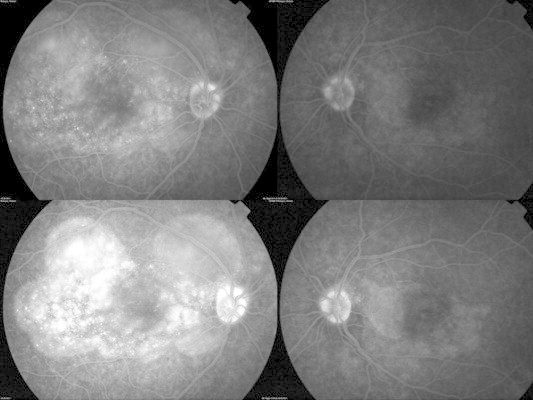
Although FFA is not an ideal investigation for evaluating the choroid, one can get some information on choriocapillaris perfusion manifested as early choroidal hypofluorescence or non-perfusion in several choroiditis entities, including Vogt–Koyanagi–Harada disease and inflammatory choriocapillaropathies, like serpiginous choroiditis (Fig. 4), acute posterior multifocal placoid pigment epitheliopathy (APMPPE), and multiple evanescent white dot syndrome (MEWDS). The fluorescein angiographic pattern is characteristic in Vogt–Koyanagi–Harada disease and sympathetic ophthalmia where it shows initial pinpoint hyperfluorescent dots or areas of delayed choroidal filling with late pooling of dye in subretinal space that maybe associated with optic disk hyperfluorescence.17–20 In serpiginous choroiditis, the active borders show early hypofluorescence with progressive diffuse staining in late frames.16
Figure 4.
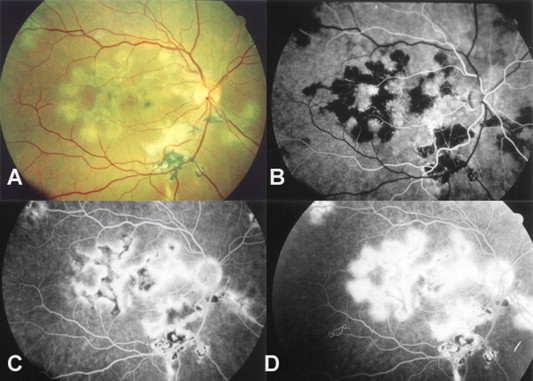
Serpiginous choroiditis. (A) Color fundus photo. (B) Fluorescein angiography shows early blockage. (C and D) As the angiogram proceeds, the active margins progressively become hyperfluorescent and spread toward the center of the lesion as it absorbs dye from the choriocapillaris.
Ultra-wide field fluorescein angiography
Since posterior uveitis is associated with significant changes in the peripheral retina, these findings are likely to be missed by conventional fluorescein angiograms but can be visualized using ultra wide field fluorescein angiography that has been reported to be more useful than traditional fluorescein angiography and was especially useful in following up patients with intermediate uveitis (Figs. 5 and 6).21,22 In a recent study, Campbell et al.23 studied the disease activity and management decisions based on examination plus simulated 30 or 60 degree FFA versus examination plus wide-field FFA. Based on examination and limited FFA the disease activity was detected in 51% of patients and 16% had management change whereas based on examination with wide-field FFA, the disease activity was documented in 63% of patients and management changed in 48% of patients; thus indicating the superiority of wide-field over traditional FFA.
Figure 5.
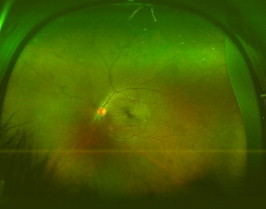
Wide field color fundus photograph of the left eye in a patient with Behcet’s disease.
Figure 6.
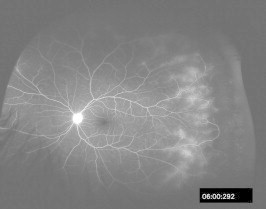
Wide field color fundus photograph of the left eye same patient as in Fig. 5 shows peripheral active vascular leakage.
Fundus autofluorescence (FAF)
Fundus autofluorescence using confocal scanning laser ophthalmoscope (cSLO) allows detection of low intensity autofluorescence produced by fluorophores such as lipofuscin present in the retinal pigment epithelial (RPE) cells.24,25 These fluorophores (mainly lipofuscin) originate from the photoreceptor outer segments and accumulate in the RPE cell lysosomes and their excessive presence in the RPE layer is an indicator of the quality of the RPE cell metabolism. Since RPE is involved in most of the posterior segment inflammations, FAF imaging provides useful information of the metabolic state of RPE that may be indicative of disease activity. FAF imaging has been found to be useful in monitoring disease activity in serpiginous-like choroiditis. In Serpiginous-like choroiditis, the disease activity has been classified into four stages. Stage 1: with active edge shows an area of hyperautofluorescence at the borders of active edge. As the disease starts healing, the hyperautofluorescence is replaced with hypoautofluorescence; Stage 2: disease shows healing lesions with mixed autofluorescence that are predominantly hyperautofluorescent; Stage 3: the lesions that are now progressively healing show mixed autofluorescence and are predominantly hypofluorescent; and Stage 4: as the lesions become totally healed with scar, they show total hypofluoresce.26 Similar findings were reported in another study where serpiginous choroiditis and Serpiginous-like choroiditis were classified into active, transitional and inactive stages based on the autofluorescence patterns.27
In acute stage of APMPPE, the lesions have been reported to be hypoautofluorescent that has been hypothesized to be due to inflamed swollen retinal cells with increased autofluorescence at the borders. As the lesions heal, they become hypoautofluorescent.28,29
Lesions in multiple evanescent white dot syndromes (MEWDS) and acute zonal occult outer retinopathy (AZOOR) also show altered autofluorescence.30,31 In most white dot syndromes, the lesions with increased autofluorescence correspond to areas of abnormal fluorescence on FA, hypofluorescent spots on ICG and decreased sensitivity on visual fields.32 Fujiwara et al.33 have reported progressive peripapillary hypoautofluorescence with mixed autofluorescence in patients with AZOOR. The hypoautofluorescent lesions correspond to zonal loss of photoreceptors.
In Vogt–Koyanagi–Harada disease, hypoautofluorescent signals are seen in the areas of peripapillary atrophy, atrophic and pigmented scars, cystoid macular edema while serous detachment shows hyperautofluorescence. Sunset glow fundus in chronic VKH per se is not associated with any significant autofluorescent changes.34–36
Cystoid macular edema in uveitis causes hyperautofluorescence37,38 whereas hypoautofluorescence at the fovea is associated with poor visual acuity.36,39 Application of wide-field FAF imaging has shown several peripheral abnormalities including multifocal hypofluorescent spots, hyperfluorescent spots and unique lattice-like pattern in patients with chronic VKH.35 Wide-field FAF has recently been reported to correspond to visual field defect-related to alterations of the retinal pigment epithelium in uveitis cases (Fig. 7).40
Figure 7.
Fundus photograph of the right eye showing choroiditis patches in a patient with punctate inner choroidopathy (A) that are seen as hypo-autofluorescent dots (B). Bottom: Fundus photograph of the left eye shows a scar (C) that is again hypo-autofluorescent on autofluorescent imaging (D).
Thus, overall autofluorescent imaging provides clinically useful information in posterior uveitis.
Optical coherence tomography (OCT)
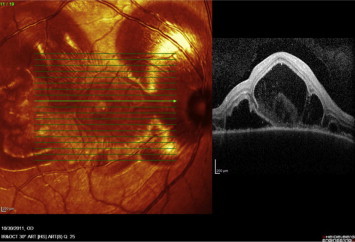
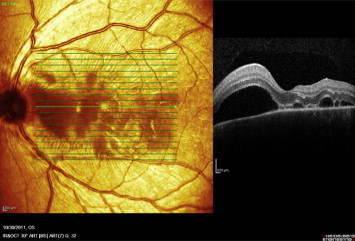
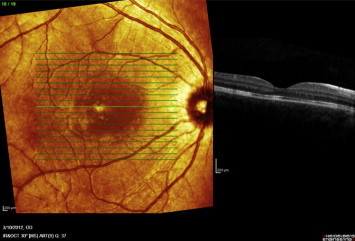
OCT has been found to be useful in the imaging of posterior uveitis both for establishing the diagnosis and monitoring response to therapy. It helps in the localization of the pathology by demarcating its extent, depth and thickness and is very useful in quantifying macular edema including cystoid macular edema.41 When compared to fundus fluorescein angiography (FFA), OCT was found to have 89% sensitivity for diagnosing CME.42 Markomichelakis et al.43 described three patterns of uveitic macular edema: (1) diffuse macular edema seen in 54.8% eyes and presents as sponge-like thickening of the retina with low-reflectivity; (2) clearly defined intra-retinal cystic spaces seen in 25%; and (3) serous retinal detachment seen in 5.9% of cases with fluid accumulation between RPE and neurosensory retina (Figs. 8–13). In addition, 14.3% of the eyes in their series had diffused macular edema and retinal detachment.
Figure 8.
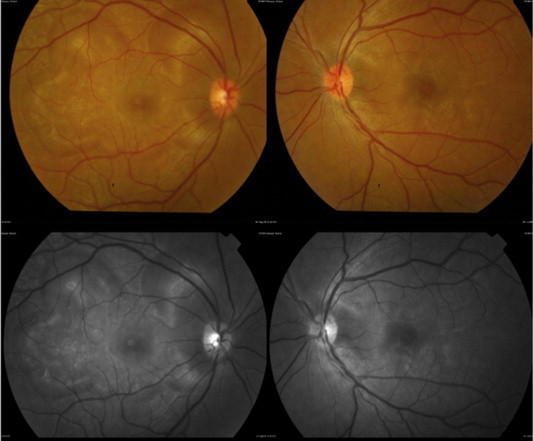
Color fundus photographs of the right and left eye (Top) and red-free photographs right and left eye (Bottom) showing exudative retinal detachments in a patient with Vogt–Koyanagi–Harada disease.
Figure 9.
Fundus fluorescein angiogram of the right eye (top left) showing multiple punctate hyperfluorescent dots in the right eye and few hyper-fluorescent dots in the left eye (top right). In the late phase there is pooling of dye in the areas corresponding to serous detachment with optic disk hyperfluorescence in the late phase in right eye (bottom left) and diffuse hyperfluorescence in the left eye (bottom right).
Figure 10.
Raster OCT scan of the right eye passing through exudative retinal detachment shows multiple areas of neurosensory detachments.
Figure 11.
Raster OCT scan of the left eye passing through exudative retinal detachment shows multiple areas of neurosensory detachments.
Figure 12.
Raster OCT scan of the right eye following treatment shows normal foveal contour with resolution of exudative retinal detachment.
Figure 13.
Raster OCT scan of the left eye following treatment shows normal foveal contour with resolution of exudative retinal detachment.
OCT is also very useful in studying the vitreoretinal interface and identifying vitreo-foveal traction in uveitic eyes.44 Presence of ERM is quite common in eyes with posterior segment inflammations and presence of ERM in the fovea, focal attachment to underlying retina and disruption of IS/OS junction were found to be associated with poor visual outcome.45
OCT has been used to study the incidence of serous retinal detachments in uveitis and 15% of uveitis patients were reported to have serous detachments that led to visual impairment in 71% of cases and diffuse macular edema and focal cystoid spaces were the most common associations.46
In patients with Vogt–Koyanagi–Harada and sympathetic ophthalmia, OCT is very useful in monitoring serous retinal detachments. During the early stage of VKH disease, the RPE may be elevated because of underlying granulomas, thus producing choroidal striations.47 The retina inner to external limiting membrane did not show any remarkable structural alteration in VKH and sympathetic ophthalmia patients and the changes seen in outer retina segment in sympathetic ophthalmia were reversible.48
Multimodal imaging
Multimodal imaging is done with Spectralis HRA + OCT that is the combination of a confocal scanning laser ophthalmoscope (cSLO) and a spectral domain optical coherence tomography (SD-OCT) and has a dual-beam scanning system. One laser captures the reference image while other simultaneously captures the SD-OCT scan and the cSLO part of the device allows acquiring reflectance images, angiography images (both fluorescein and indocyanine green) and autofluorescence images. The SD-OCT part allows acquiring cross-sectional and volume images. The Spectralis HRA-OCT allows capturing of following individual images: (1) infrared Reflectance imaging (IR); (2) red-free imaging (RF); (3) fluorescein angiography (FA); (4) indocyanine green angiography (ICGA); (5) autofluorescence (AF) and (6) OCT imaging. The different imaging modes can be used either alone or simultaneously in different combinations. Spectralis offers a unique technique of enhanced depth imaging (EDI) that produces high-resolution cross-sectional images of the whole thickness of the choroid and is very useful for studying diseases involving the choroid. The contour, architecture and thickness of the choroid can be assessed using EDI. Fong et al.49 reported a loss of focal hyper reflectivity in the inner choroid in patients with VKH, a feature that is consistently observed by independent masked observers. The presence of this feature was seen in both acute as well as convalescent phases and authors hypothesized that it could represent permanent structural change to small choroidal vessels.
Ultrasonography
Ultrasonography may be useful in the evaluation of intraocular inflammatory conditions, especially when visualization of the fundus is poor due to media haze. Ultrasonography is useful in assessing the location, extent, and density of vitritis. The 20-MHz frequency probes can detect the typical snowbank in intermediate uveitis.50 Ultrasonography is also useful in the detection of posterior vitreous detachment, a common finding in eyes with vitreous inflammation.51 Ultrasound can be used to monitor serous retinal detachments in VKH disease and sympathetic ophthalmia. However currently, OCT is a preferred modality for monitoring serous detachment. The diagnostic ultrasound still has a role in acute VKH disease where it typically shows diffuse, low-to-medium reflective choroidal thickening most evident in the posterior pole. It is also an important diagnostic modality in diffuse posterior scleritis where it shows high-reflective sclero-choroidal thickening. Scleral edema associated with fluid within Tenon’s space results in an echoluscent region just posterior to the sclera results in the classic “T” sign.48
Summary
Retinal imaging is very useful in diagnosing pathologies and monitoring inflammatory diseases of the posterior segment. The most commonly used retinal imaging techniques in uveitis include fundus photography, FFA (including wide-field FA), FAF, OCT, and ultrasonography for posterior segment inflammatory conditions. These imaging modalities can help not only in making the correct diagnosis but in documenting and following patients after therapy of inflammatory conditions of the posterior pole.
Conflict of interest
The authors declared that there is no conflict of interest.
Footnotes
Peer review under responsibility of Saudi Ophthalmological Society, King Saud University.

References
- 1.Parnell J.R., Jampol L.M., Yannuzzi L.A. Differentiation between presumed ocular histoplasmosis syndrome and multifocal choroiditis with panuveitis based on morphology of photographed fundus lesion and fluorescein angiography. Arch Ophthalmol. 2001;119:208–212. [PubMed] [Google Scholar]
- 2.Hsieh J., Honda A.F., Suarez-Faririas M. Fundus image diagnostic agreement in uveitis utilizing free and open source software. Can J Ophthalmol. 2013;48:227–234. doi: 10.1016/j.jcjo.2013.02.010. [DOI] [PMC free article] [PubMed] [Google Scholar]
- 3.Gupta V., Gupta A. Fundus photography. In: Gupta A., Gupta V., Herbort C.P., Khairallah M., editors. Uveitis text and imaging. Jaypee Brothers Medical Publishers; 2009. pp. 50–60. Chapter 4. [Google Scholar]
- 4.De Laey J.J. Fluorescein Angiography in posterior uveitis. Int Ophthalmol Clin. 1995;35:33–58. doi: 10.1097/00004397-199503530-00005. [DOI] [PubMed] [Google Scholar]
- 5.Illjima H., Tsukahara Y., Imasawa M. Angiographic findings in eyes with active ocular toxoplasmosis. Jpn J Ophthalmol. 1995;39:402–410. [PubMed] [Google Scholar]
- 6.Atmaca L.S. Fundus changes associated with BehÇet’s disease. Grafe’s Arch Clin Exp Ophthalmol. 1989;227:340–344. doi: 10.1007/BF02169409. [DOI] [PubMed] [Google Scholar]
- 7.Miyake K. Prevention of cystoid macular oedema after lens extraction by topical indomethacin: a preliminary report. Graefes Arch Klin Exp Ophthalmol. 1977;203:81–88. doi: 10.1007/BF00413399. [DOI] [PubMed] [Google Scholar]
- 8.Yannuzzi L.A. A perspective on the treatment of aphakic cystoid macular edema. Surv Ophthalmol. 1984;28:540–553. doi: 10.1016/0039-6257(84)90238-8. [DOI] [PubMed] [Google Scholar]
- 9.Tran T.H., deSmet M.D., Bodaghi B. Uveitic macular oedema: correlation between optical coherence tomography patterns with visual acuity and fluorescein angiography. Br J Ophthalmol. 2008;92:922–927. doi: 10.1136/bjo.2007.136846. [DOI] [PubMed] [Google Scholar]
- 10.Brar M., Yuson R., Kozak I. Correlation between morphological features on spectral-domain optical coherence tomography and angiographic leakage patterns in macular edema. Retina. 2010;30:383–389. doi: 10.1097/IAE.0b013e3181cd4803. [DOI] [PMC free article] [PubMed] [Google Scholar]
- 11.Ossewaarde-van Norel J., Camfieman L.P., Rothova A. Discrepancies between fluorescein angiography and optical coherence tomography in macular edema in uveitis. Am J Ophthalmol. 2012;154:233–239. doi: 10.1016/j.ajo.2012.02.003. [DOI] [PubMed] [Google Scholar]
- 12.Kempen J.H., Sugar E.A., Jaffe G.J. Fluorescein angiography versus optical coherence tomography for diagnosis of uveitic macular edema. Ophthalmology. 2013;120:1852–1859. doi: 10.1016/j.ophtha.2013.01.069. [DOI] [PMC free article] [PubMed] [Google Scholar]
- 13.Kleiner R.C., Kaplan H.J., Shakin J.L. Acute frosted retinal periphlebitis. Am J Ophthalmol. 1988;106:27–34. [PubMed] [Google Scholar]
- 14.Matsuo T., Sato Y., Shiraga F. Choroidal abnormalities in Behcet’s disease observed by simultaneous indocyanine green and fluorescein with scanning laser ophthalmoscopy. Ophthalmology. 1999;106:295–300. doi: 10.1016/S0161-6420(99)90069-6. [DOI] [PubMed] [Google Scholar]
- 15.Das T.P., Biswas J., Kumar A. Eales’ disease. Ind J Ophthalmol. 1994;42:3–18. [PubMed] [Google Scholar]
- 16.Ciardella P.C., Prall F.R., Borodoker N., Cunningham E.T., Jr Imaging techniques for posterior uveitis. Curr Opin Ophthalmol. 2004;15:519–530. doi: 10.1097/01.icu.0000144386.05116.c5. [DOI] [PubMed] [Google Scholar]
- 17.Fardeau C., Tran T.H., Gharbi B. Retinal fluorescein and indocyanine green angiography and optical coherence tomography in successive stages of Vogt–Koyanagi–Harada disease. Int Ophthalmol. 2007;27:163–172. doi: 10.1007/s10792-006-9024-7. [DOI] [PubMed] [Google Scholar]
- 18.Arellanes-García L., Hernández-Barrios M., Fromow-Guerra J., Cervantes-Fanning P. Fluorescein fundus angiographic findings in Vogt–Koyanagi–Harada syndrome. Int Ophthalmol. 2007;27:155–161. doi: 10.1007/s10792-006-9027-4. [DOI] [PubMed] [Google Scholar]
- 19.Sharp D.C., Bell R.A., Patterson E., Pinkerton R.M. Sympathetic ophthalmia. Histologic and fluorescein angiographic correlation. Arch Ophthalmol. 1984;102:232–235. doi: 10.1001/archopht.1984.01040030182022. [DOI] [PubMed] [Google Scholar]
- 20.Altan-Yaycioglu R., Akova Y.A., Akca S., Yilmaz G. Inflammation of the posterior uvea: findings on fundus fluorescein and indocyanine green angiography. Ocular Immunol Inflamm. 2006;14:171–179. doi: 10.1080/09273940600660524. [DOI] [PubMed] [Google Scholar]
- 21.Kaines A., Tusi I., sarraf D., Schwartz S. The use of ultra field fluorescein angiography in evaluation and management of uveitis. Semin Ophthalmol. 2009;24:19–24. doi: 10.1080/08820530802520095. [DOI] [PubMed] [Google Scholar]
- 22.Tsui I., Kaines A., Schwartz S. Patterns of periphlebitis in intermediate uveitis using ultra wide field fluorescein angiography. Semin Ophthalmol. 2009;24:29–33. doi: 10.1080/08820530802520186. [DOI] [PubMed] [Google Scholar]
- 23.Campbell J.P., Leder H.A., Sepah Y.I. Wide-field retinal imaging in the management of noninfectious posterior uveitis. Am J Ophthalmol. 2012;154:908–911. doi: 10.1016/j.ajo.2012.05.019. [DOI] [PubMed] [Google Scholar]
- 24.Schmitz-Valckenberg S., Fitzke F.W., Holz F.G. Fundus autofluorescence imaging with the confocal scanning laser ophthalmoscope. In: Holz F.G., Schmitz-Valckenberg S., Spaide R.F., Brid A.C., editors. Atlas of fundus autofluorescence imaging. Springer; Heidelberg: 2007. pp. 31–36. [Google Scholar]
- 25.Sparrow J.R. Lipofuscin of the retinal pigment epithelium. In: Holz F.G., Schmitz-Valckenberg S., Spaide R.F., Brid A.C., editors. Atlas of fundus autofluorescence imaging. Springer; Heidelberg: 2007. [Google Scholar]
- 26.Gupta A., Bansal R., Gupta V., Sharma A. Fundus autofluorescence in serpiginous-like choroiditis. Retina. 2011;32:814–825. doi: 10.1097/IAE.0b013e3182278c41. [DOI] [PubMed] [Google Scholar]
- 27.Carreno E., Portero A., Herreras J.M., Lopez M.I. Assessment of fundus autofluorescence in vertiginous and serpiginous-like choroidopathy. Eye. 2012;26:1232–1236. doi: 10.1038/eye.2012.121. [DOI] [PMC free article] [PubMed] [Google Scholar]
- 28.Spaide R.F. Autofluorescence imaging of acute posterior multifocal placoid pigment epitheliopathy. Retina. 2006;26(4 (April)):479–482. doi: 10.1097/01.iae.0000238557.06907.de. [DOI] [PubMed] [Google Scholar]
- 29.Lee G.E., Lee B.W., Rao N.A., Fawzi A.A. Spectral domain optical coherence tomography and autofluorescence in a case of acute posterior multifocal placoid pigment epitheliopathy mimicking Vogt–Koyanagi–Harada disease: case report and review of literature. Ocul Immunol Inflamm. 2011;19(1 (February)):42–47. doi: 10.3109/09273948.2010.521610. [DOI] [PubMed] [Google Scholar]
- 30.Yenerel N.M., Kucumen B., Gorgun E., Dinc U.A. Atypical presentation of multiple evanescent white dot syndrome (MEWDS) Ocul Immunol Inflamm. 2008;16:113–115. doi: 10.1080/09273940802026060. [DOI] [PubMed] [Google Scholar]
- 31.Silva R.A., Albini T.A., Flynn H.W., Jr. Multiple evanescent white dot syndromes. J Ophthalmic Inflamm Infect. 2012;2(2):109–111. doi: 10.1007/s12348-011-0051-9. [DOI] [PMC free article] [PubMed] [Google Scholar]
- 32.Ad Meleh, Sen N. Use of fundus autofluorescence in diagnosis and management of uveitis. Int Ophthalmol Clin. 2012;52:45–54. doi: 10.1097/IIO.0b013e3182662ee9. [DOI] [PMC free article] [PubMed] [Google Scholar]
- 33.Fujiwara T., Imamura Y., Giovinazzo V.J., Spaide R.F. Fundus autofluorescence and optical coherence tomographic findings in acute zonal occult outer retinopathy. Retina. 2010;30:1206–1216. doi: 10.1097/IAE.0b013e3181e097f0. [DOI] [PubMed] [Google Scholar]
- 34.Vasconcelos-Santos D.V., Sohn E.H., Sadda S., Rao N.A. Retinal pigment epithelial changes in chronic Vogt–Koyanagi–Harada disease: fundus autofluorescence and spectral domain-optical coherence tomography findings. Retina. 2010;30:33–41. doi: 10.1097/IAE.0b013e3181c5970d. [DOI] [PMC free article] [PubMed] [Google Scholar]
- 35.Heussen F.M., Vasconcelos-Santos D.V., Pappuru R.R., Walsh A.C., Rao N.A., Sadda S.R. Ultra-wide-field green-light (532-nm) autofluorescence imaging in chronic Vogt–Koyanagi–Harada disease. Ophthalmic Surg Lasers Imaging. 2011;42:272–277. doi: 10.3928/15428877-20110505-01. [DOI] [PubMed] [Google Scholar]
- 36.Koizumi H., Maruyama K., Kinoshita S. Blue light and near-infrared fundus autofluorescence in acute Vogt–Koyanagi–Harada disease. Br J Ophthalmol. 2010;94:1499–1505. doi: 10.1136/bjo.2009.164665. [DOI] [PubMed] [Google Scholar]
- 37.Roesel M., Henschel A., Heinz C., Dietzel M., Spital G., Heiligenhaus A. Fundus autofluorescence and spectral domain optical coherence tomography in uveitic macular edema. Graefes Arch Clin Exp Ophthalmol. 2009;247:1685–1689. doi: 10.1007/s00417-009-1149-8. [DOI] [PubMed] [Google Scholar]
- 38.McBain V.A., Forrester J.V., Lois N. Fundus autofluorescence in the diagnosis of cystoid macular oedema. Br J Ophthalmol. 2008;92:946–949. doi: 10.1136/bjo.2007.129957. [DOI] [PubMed] [Google Scholar]
- 39.Yeh S., Forooghian F., Wong W.T., Faia L.J., Cukras C., Lew J.C. Fundus autofluorescence imaging of the white dot syndromes. Arch Ophthalmol. 2010;128:46–56. doi: 10.1001/archophthalmol.2009.368. [DOI] [PMC free article] [PubMed] [Google Scholar]
- 40.Seidensticker F., Neubauer A.S., Wasfy T. Wide-field fundus autofluorescence corresponds to visual fields in chorioretinitis patients. Clin Ophthalmol. 2011;5:1667–1671. doi: 10.2147/OPTH.S26224. Epub 2011 November 29. [DOI] [PMC free article] [PubMed] [Google Scholar]
- 41.Gupta V., Gupta A., Dogra M.R. 4th ed. Jaypee-Highlights Medical Publishers; 2012. Inflammatory diseases of retina-choroid in atlas optical coherence tomography of macular diseases and glaucoma. chapter 19; p. 458–40. [Google Scholar]
- 42.Antcliff R.J., Stanford M.R., Chauhan D.S. Comparison between optical coherence tomography and fundus fluorescein angiography for the detection of cystoid macular edema in patients with uveitis. Ophthalmology. 2000;107:593–599. doi: 10.1016/s0161-6420(99)00087-1. [DOI] [PubMed] [Google Scholar]
- 43.Markomichelakis N.N., Halkiadakis I., Pantelia E. Patterns of macular edema in patients with uveitis: qualitative and quantitative assessment using optical coherence Tomography. Ophthalmology. 2004;111:946–953. doi: 10.1016/j.ophtha.2003.08.037. [DOI] [PubMed] [Google Scholar]
- 44.Gupta V., Gupta P., Singh R., Dogra M.R., Gupta A. Spectral-domain cirrus high-definition optical coherence tomography is better than time-domain stratus optical coherence tomography for evaluation of macular pathologic features in uveitis. Am J Ophthalmol. 2008;145:1018–1022. doi: 10.1016/j.ajo.2008.01.021. [DOI] [PubMed] [Google Scholar]
- 45.Nazar H., Dustin L., Heussen F.M. Morphometric Spectral –domain optical coherence tomography features of epiretinal membranes correlates with visual acuity in patients with uveitis. Am J Ophthalmol. 2012;154:78–86. doi: 10.1016/j.ajo.2012.01.032. [DOI] [PMC free article] [PubMed] [Google Scholar]
- 46.Simmons-Rear A., Yeh S., Chan-Kai B.T. Charecterization of serous retinal detachments in uveitis with optical coherence tomography. J Ophthalmic Inflamm Infect. 2012;2:191–197. doi: 10.1007/s12348-012-0084-8. Morphometric Spectral-Domain Optical Coherence Tomography Features of Epiretinal Membrane Correlate With Visual Acuity in Patients with Uveitis. [DOI] [PMC free article] [PubMed] [Google Scholar]
- 47.Gupta V., Gupta A., Gupta P., Sharma A. Spectral-domain cirrus optical coherence tomography of choroidal striations seen in the acute stage of Vogt–Koyanagi–Harada disease (original article) Am J Ophthalmol. 2009;147(1):148–153. doi: 10.1016/j.ajo.2008.07.028. [DOI] [PubMed] [Google Scholar]
- 48.Gupta V., Gupta A., Dogra M.R., Singh I. Reversible retinal changes in the acute stage of sympathetic ophthalmia seen on spectral domain optical coherence tomography. Int Ophthalmol. 2011;31(2 (April)):105–110. doi: 10.1007/s10792-011-9432-1. Epub 2011 February 18. [DOI] [PubMed] [Google Scholar]
- 49.Fong A.H., Li K.K., Wong D. Choroidal evaluation using enhanced depth imaging spectral-domain optical coherence tomography in Vogt–Koyanagi–Harada disease. Retina. 2011;31:502–509. doi: 10.1097/IAE.0b013e3182083beb. [DOI] [PubMed] [Google Scholar]
- 50.Doro D., Manfrè A., Deligianni V., Secchi A.G. Combined 50- and 20-MHz frequency ultrasound imaging in intermediate uveitis. Am J Ophthalmol. 2006;141:953–955. doi: 10.1016/j.ajo.2005.11.048. [DOI] [PubMed] [Google Scholar]
- 51.Rochels R., Reis G. Echography in posterior scleritis. Klin Monbl Augenheilkd. 1980;177:611–613. doi: 10.1055/s-2008-1057695. [DOI] [PubMed] [Google Scholar]