Abstract
Recently, the use of a mixed model methodology in genome-wide association studies (GWAS) has been considered effective for controlling population stratification and explaining the polygenic effects of complex traits. However, estimating polygenic variance components and heritability was biased when the mixed model was used. This bias results from a diluted genetic relationship covariance structure, particularly with a limited number of underlying causal variants. We simulated disease and quantitative phenotypes with a variety of heritabilities (0.1, 0.2, 0.3, 0.4, and 0.5), prevalence rates (0.1, 0.2, 0.3, and 0.5), and causal variant numbers (10, 30, 50, and 100). Heritabilities from the simulated data using restricted maximum likelihood were underestimated in many populations (P<0.05). The underestimation increased with a large heritability, a small prevalence, and a small number of causal variants. The underestimation was larger in analyzing disease traits compared with quantitative traits. This study suggests an underestimated heritability in GWAS upon using the mixed model methodology with an excessively larger number of variants versus causal variants.
Keywords: heritability, mixed model, simulation
INTRODUCTION
Genome-wide association studies (GWAS) have become routine for unraveling the genetic variants underlying complex phenotypes in humans and many other species.1, 2, 3A significant concern regarding data analysis for GWAS has been to control for population stratification that often produces spurious genetic associations. Recently, a Hendersonian approach using a mixed model was introduced to GWAS in order to overcome critical weaknesses of genomic control,4 principal component analysis,5 and structured association6 in controlling population stratification. The mixed model methodology7, 8 controls population stratification as well as reflects polygenic effects by using pairwise genetic relationships among individuals with abundant genotype data. However, diluted genomic backgrounds confounded with unnecessary markers would lead to a bias in genetic parameter estimation, particularly with a limited number of underlying causal loci. This study aimed to conduct a simulation study to examine such biases in heritability estimates using a mixed model.
MATERIALS AND METHODS
Simulation
Data with limited numbers of causal loci were simulated using genomic information from a Korean population. Originally, 10 038 unrelated Koreans were recruited by the Korean Genome Epidemiology Study. The Korea Association REsource (KARE) consortium then obtained genotypes from 8842 individuals at 351 677 single-nucleotide polymorphisms (SNPs) after genotype calling and quality control for GWAS using the Affymetrix Genome-Wide Human SNP Array 5.0 (Affymetrix, Inc., Santa Clara, CA, USA).9 In the current study, genotypes of 6000 individuals with small genetic relationship (<0.2) were used to simulate phenotypes for disease and quantitative traits under the assumption of an additive genetic model. The genetic relationship between individuals j and k was defined as  where xij (xik) is the number of copies of the reference allele for the ith SNP of the jth (kth) individual and pi is the frequency of the reference allele.10 The disease trait cases and controls were generated under the assumption of the following threshold model. That is, the case was an individual with a larger disease liability than the threshold of a normal distribution determined by disease prevalence of 0.1, 0.2, 0.3, or 0.5, whereas the control was an individual with a smaller disease liability. Data were simulated using a variety of heritabilities and numbers of causal SNPs. Input values of the heritabilities were 0.1, 0.2, 0.3, 0.4, and 0.5. The numbers of causal SNPs were 10, 30, 50, and 100, which were randomly selected from a total of 351 677 SNPs. Their effect sizes were also randomly generated from a normal distribution with a dispersion parameter according to heritability. The quantitative trait phenotypes were simulated by adding a residual to the polygenic effects randomly generated with covariance structure among individuals. For each population, 50 replicates were simulated.
Analyses
A mixed model was used to analyze simulated data in the current study:
 |
where y is the phenotype vector of disease statuses (0 or 1) or quantitative values, g is the vector of random polygenic effects ( ), and e is the vector of random environmental effects (
 ). G is the n × n genetic relationship matrix with elements of pairwise relationship from 351 677 SNPs, and I is the n × n identity matrix.
  is polygenic variance and
  is environmental variance. Heritability was estimated using restricted maximum likelihood (REML) estimates of the two-variance components. The variance components were obtained using the AI-REML algorithm with their EM-REML estimates as initial values. Each disease trait heritability was estimated on the observed scale and also on the liability scale transformed by the probit function to provide robust estimates.11 The variance component estimation was conducted using the genome-wide complex trait analysis.10 Sampling variance was estimated empirically from the heritability estimates obtained across 50 replicates.
Heritability of hypertension
Heritability was estimated using hypertension data from the KARE consortium. Among 6000 individuals, 945 subjects were self-reported patients with hypertension. Subjects were assumed to be diagnosed by physicians using the criteria of either a clinical systolic blood pressure >140 mm Hg or a diastolic blood pressure>90 mm Hg. The other subjects in the cohort were used as controls.
Results
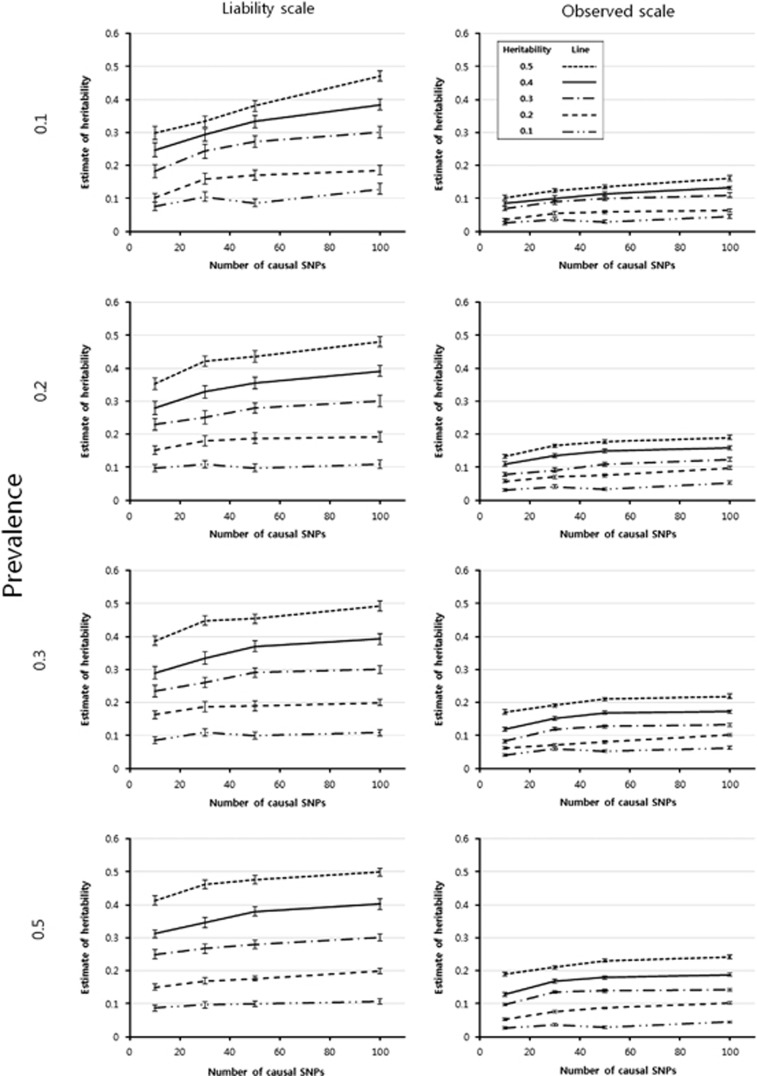
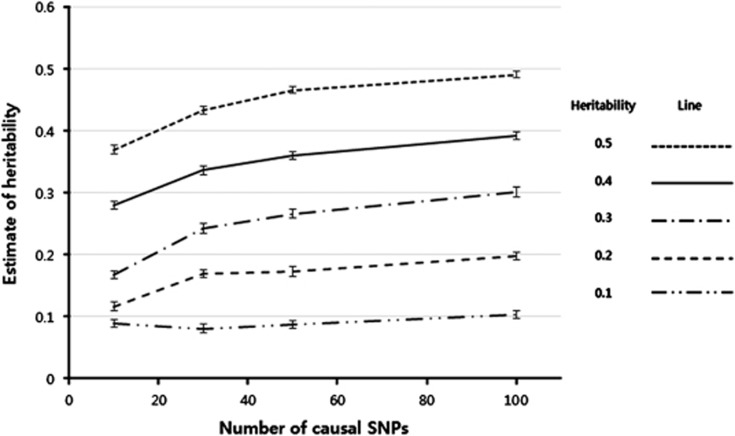
The heritability estimation with simulated data for disease traits showed that heritability was underestimated regardless of heritability size, prevalence rate, and causal SNP number using the observed scale (Figure 1). In contrast, the underestimation was dramatically reduced after the probit transformation, although they were still underestimated in many populations (Figure 1). The heritability estimates did not differ from corresponding input values across a variety of heritabilities for the data simulated with 100 causal SNPs (0.029% of the total number of 351 677 SNPs used in the analysis). However, the bias increased with a reduced number of causal SNPs. The bias also increased with a large input value of heritability and with a small prevalence. Heritability estimates for quantitative traits showed a similar pattern to those for disease traits with the underlying scale, but underestimation of the heritability estimates was slightly smaller for quantitative traits than for disease traits (Figure 2). The SEs of the heritability estimates were also reduced when the quantitative traits were analyzed.
Figure 1.
Mean heritability estimates of simulated data for disease traits. The vertical bar of each mean estimate represents its corresponding SE empirically estimated from the heritability estimates obtained across 50 replicates.
Figure 2.
Mean heritability estimates of simulated data for quantitative traits. The vertical bar of each mean estimate represents its corresponding SE empirically estimated from the heritability estimates obtained across 50 replicates.
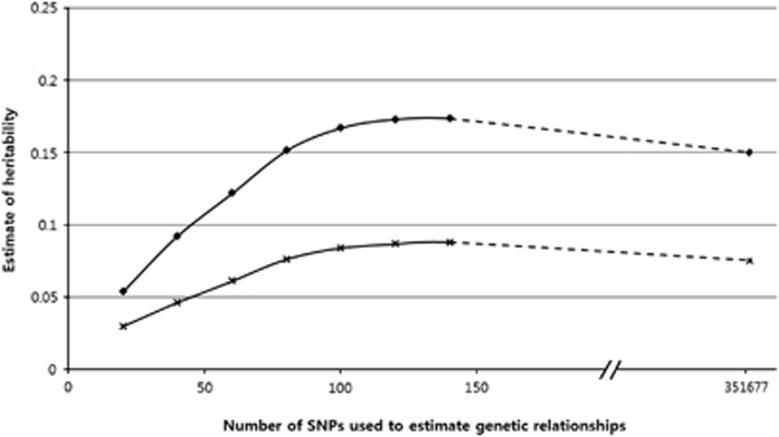
The hypertension heritability was 0.15 when the 351 677 SNPs were included in the analytical model (Figure 3). This heritability estimate was not significantly different (P>0.05) from the estimates (0.17) obtained by including the 100–150 SNPs most significantly associated with hypertension.
Figure 3.
Heritability estimates for hypertension. ♦ indicates heritability of the liability scale, and × indicates heritability of the observed scale.
Discussion
A variety of GWAS brought the ‘missing heritability' for complex traits into view. This might be attributed to various factors. First, GWAS have not used all sequence variants. Generally, they use sparse markers across the genome, and rare variants with small minor allele frequencies were excluded in association analyses.12, 13, 14, 15 Furthermore, highly repetitive sequence variants intensively located in the human genome could not be analyzed in GWAS. Another factor was that some associated SNPs included in GWAS are not causal but are linked to causal SNPs.16 It is also possible that the missing heritability can be exaggerated by inflated heritability from shared environmental factors within a family.17
One of the systematic reasons for bias in heritability is the use of somewhat diluted genetic relationships when polygenic effects were estimated with a mixed model methodology. The bias is caused by addition of spurious causal SNPs and thus would be significant with a limited number of causal SNPs. The current simulation study showed that the heritability was underestimated for complex traits with ≤50 causal SNPs. Indeed, the underestimation increased with a small number of causal SNPs. This underestimation concurs with a previous simulation study18 where heritability was underestimated from 0.5 to 0.4 using data simulated with artificial linkage disequilibrium patterns. However, it was suggested that heritability was unbiased by noncausal SNPs simulated without any linkage to causal SNPs.18, 19 We suspect that this unbiased heritability might be caused by a relatively large ratio of causal to noncausal SNPs. These authors obtained the results from data simulated with 10 causal SNPs and 100, 1000, or 5000 noncausal SNPs, and the corresponding ratio was 1:10, 1:100, or 1:500. They were considerably larger than the largest ratio (1:3500) in the current study in which heritability was not biased.
The current study further shows that heritability was less underestimated with a small heritability. We obtained unbiased estimates with the heritability of 0.1, and the heritability with 100 causal variants tended to be overestimated, although the overestimation was not significant (P>0.05). We suspect that this might be caused by a property of REML estimates that must be located within parameter space. In this case, the genetic variance component must be >0; thus, there might be overestimation in some of the 50 replicates. In fact, zero estimates of genetic variance components were observed in 12 out of 50 replicates when we obtained the heritability estimates from the data simulated with 10 causal SNPs (h2=0.1). That is, the overestimation of heritability offset the underestimation that might also occur with a small heritability.
The underestimation of heritability showed a similar pattern for both disease and quantitative traits. However, the heritability estimates were less biased for quantitative traits than for disease traits. The SEs of heritability estimates were also smaller in quantitative traits than in disease traits.
The current study showed a heritability estimate (0.15) for hypertension. We suggest that underestimation of this heritability estimate might be negligible or not significant. This is because we could not find any significant difference from the estimate (0.17) with putative causal variants of 100–150 SNPs for hypertension. In addition, hypertension had roughly ≥100 causal variants.
In conclusion, underestimation would be introduced into heritability estimations when GWAS is conducted using a mixed model with an excessively large number of variants compared with the underlying causal variants. It is important to pay attention to underestimation of heritability, because GWAS with a tremendously large number of variants are readily available due to improvements in sequencing technology.
Acknowledgments
We thank the editor and anonymous reviewers for their valuable comments that helped us to improve the original manuscript. We are grateful to the National Institute of Health in Korea for providing the genotypic and epidemiological data to the KARE Analysis Consortium. This study was supported by the Basic Science Research Program of the National Research Foundation of Korea (NRF) funded by the Ministry of Education, Science, and Technology (Grant No. 2012002096).
The authors declare no conflict of interest.
References
- Hindorff LA, Sethupathy P, Junkins HA, et al. Potential etiologic and functional implications of genome-wide association loci for human diseases and traits. Proc Natl Acad Sci USA. 2009;106:9362–9367. doi: 10.1073/pnas.0903103106. [DOI] [PMC free article] [PubMed] [Google Scholar]
- Visscher PM, Brown MA, McCarthy MI, et al. Five years of GWAS discovery. Am J Hum Genet. 2012;90:7–24. doi: 10.1016/j.ajhg.2011.11.029. [DOI] [PMC free article] [PubMed] [Google Scholar]
- Yang J, Manolio TA, Pasquale LR, et al. Genome partitioning of genetic variation for complex traits using common SNPs. Nat Genet. 2011;43:519–525. doi: 10.1038/ng.823. [DOI] [PMC free article] [PubMed] [Google Scholar]
- Devlin B, Roeder K. Genomic control for association studies. Biometrics. 1999;55:997–1004. doi: 10.1111/j.0006-341x.1999.00997.x. [DOI] [PubMed] [Google Scholar]
- Price AL, Patterson NJ, Plenge RM, et al. Principal components analysis corrects for stratification in genome-wide association studies. Nat Genet. 2006;38:904–909. doi: 10.1038/ng1847. [DOI] [PubMed] [Google Scholar]
- Hoggart CJ, Parra EJ, Shriver MD, et al. Control of confounding of genetic associations in stratified populations. Am J Hum Genet. 2003;72:1492–1504. doi: 10.1086/375613. [DOI] [PMC free article] [PubMed] [Google Scholar]
- Kang HM, Sul JH, Service SK, et al. Variance component model to account for sample structure in genome-wide association studies. Nat Genet. 2010;42:348–354. doi: 10.1038/ng.548. [DOI] [PMC free article] [PubMed] [Google Scholar]
- Zhang Z, Ersoz E, Lai CQ, et al. Mixed linear model approach adapted for genome-wide association studies. Nat Genet. 2010;42:355–360. doi: 10.1038/ng.546. [DOI] [PMC free article] [PubMed] [Google Scholar]
- Cho YS, Go MJ, Kim YJ, et al. A large-scale genome-wide association study of Asian populations uncovers genetic factors influencing eight quantitative traits. Nat Genet. 2009;41:527–534. doi: 10.1038/ng.357. [DOI] [PubMed] [Google Scholar]
- Yang J, Lee SH, Goddard ME, et al. GCTA: a tool for genome-wide complex trait analysis. Am J Hum Genet. 2011;88:76–82. doi: 10.1016/j.ajhg.2010.11.011. [DOI] [PMC free article] [PubMed] [Google Scholar]
- Lee SH, Wray NR, Goddard ME, et al. Estimating missing heritability for disease from genome-wide association studies. Am J Hum Genet. 2011;88:294–305. doi: 10.1016/j.ajhg.2011.02.002. [DOI] [PMC free article] [PubMed] [Google Scholar]
- Girirajan S, Campbell CD, Eichler EE. Human copy number variation and complex genetic disease. Annu Rev Genet. 2011;45:203–226. doi: 10.1146/annurev-genet-102209-163544. [DOI] [PMC free article] [PubMed] [Google Scholar]
- Manolio TA, Collins FS, Cox NJ, et al. Finding the missing heritability of complex diseases. Nature. 2009;461:747–753. doi: 10.1038/nature08494. [DOI] [PMC free article] [PubMed] [Google Scholar]
- Eichler EE, Flint J, Gibson G, et al. Missing heritability and strategies for finding the underlying causes of complex disease. Nat Rev Genet. 2010;11:446–450. doi: 10.1038/nrg2809. [DOI] [PMC free article] [PubMed] [Google Scholar]
- Gibson G. Rare and common variants: twenty arguments. Nat Rev Genet. 2012;13:135–145. doi: 10.1038/nrg3118. [DOI] [PMC free article] [PubMed] [Google Scholar]
- Kindt AS, Navarro P, Semple CA, et al. The genomic signature of trait-associated variants. BMC Genomics. 2013;14:108. doi: 10.1186/1471-2164-14-108. [DOI] [PMC free article] [PubMed] [Google Scholar]
- Zuk O, Hechter E, Sunyaev SR, et al. The mystery of missing heritability: genetic interactions create phantom heritability. Proc Natl Acad Sci USA. 2012;109:1193–1198. doi: 10.1073/pnas.1119675109. [DOI] [PMC free article] [PubMed] [Google Scholar]
- Zaitlen N, Kraft P. Heritability in the genome-wide association era. Hum Genet. 2012;131:1655–1664. doi: 10.1007/s00439-012-1199-6. [DOI] [PMC free article] [PubMed] [Google Scholar]
- Lippert C, Quon G, Kang EY, et al. The benefits of selecting phenotype-specific variants for applications of mixed models in genomics. Sci Rep. 2013;3:1815. doi: 10.1038/srep01815. [DOI] [PMC free article] [PubMed] [Google Scholar]


