Figure 6.
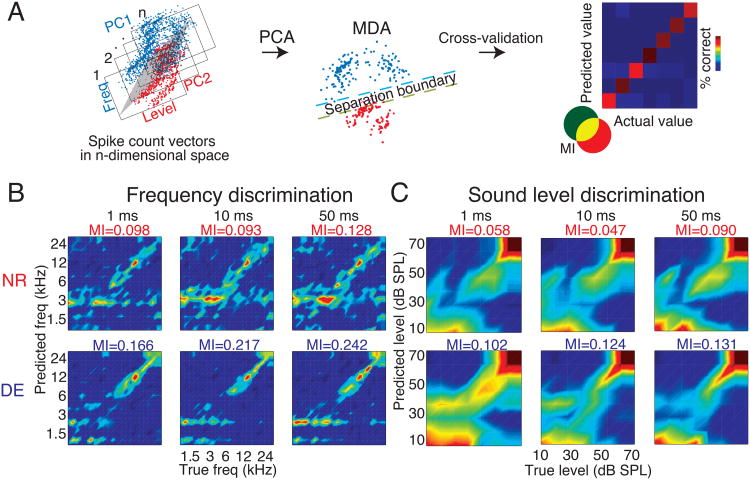
Schematic of MDA approach (A) A principal components analysis was performed on the spike count vectors forming the feature space obtained for each unit at each of the frequency-level combinations for n stimulus repetitions. The red and blue data are shown here projected along the first two principal components with a separation boundary between spike count vectors that are dissimilar to each other. In this case, the MDA estimates the probability with which each element of the stimulus matrix (21 frequencies × 7 levels) was assigned to the correct value based on the similarity between the observed responses to multiple repeats of the same stimulus. The centroid of each repeat was calculated and every subsequent repeat was compared to the previous (random) repeat of the stimulus. Given that each population of spike counts from multiple sets of neuronal responses had that many degrees of freedom, we reduced the dimensionality to the first 10 principal components, which accounted for ≥50% of the variance in the samples. Adjusted spike counts were calculated by subtracting the spontaneous rates and z-scored prior to classification, to determine the reliability of responses over and above a simple increase in responsiveness alone. The performance of this classifier was evaluated by generating a confusion matrix that plots the known value of the stimulus on the x–axis and the model-predicted identity of the stimulus on the y–axis, with perfect classification performance indicated by the 45° diagonal and erroneous assignments made away from the diagonal. The mutual information (MI) between the true value of the stimulus and the predicted value was estimated to quantify how well the neurons encode different stimulus features (frequencies and levels). (B) DE increases frequency discrimination of A1 neurons. Confusion matrices for NR (upper panel) and DE (lower panel) showing model-predicted frequency for each known frequency value. Each column represents discrimination performance at 3 different temporal resolutions (1, 10 and 50 ms, shown on top of each column). Color scale indicates proportion of classifications and diagonal alignment indicates near-perfect classification performance (identical for all plots). The bias-corrected MI is indicated at the top of each figure. The most number of correct frequency assignments appeared to be made by the classifier closer to the groups' overall CFs. (C) DE increases level discrimination of A1 neurons. Confusion matrices for sound-level-based classification, for NR (upper panel) and DE (lower panel). DE increased MI uniformly for both aspects of stimuli. The discriminability approaches saturation in performance beyond 60 dB SPL.

