

Abstract
A simple and reliable high performance liquid chromatography method was developed and validated for the rapid determination of cyclosporine A in new pharmaceutical dosage forms based on the use of poly (methylvinylether-co-maleic anhydride) nanoparticles. The chromatographic separation was achieved using Ultrabase C18 column (250×4.6 mm, 5 μm), which was kept at 75°. The gradient mobile phase consisted of acetonitrile and water with a flow rate of 1 ml/min. The effluent was monitored at 205 nm using diode array detector. The method exhibited linearity over the assayed concentration range (22-250 μg/ml) and demonstrated good intraday and interday precision and accuracy (relative standard deviations were less than 6.5% and the deviation from theoretical values is below 5.5%). The detection limit was 1.36 μg/ml. This method was also applied for quantitative analysis of cyclosporine A released from poly (methylvinylether-co-maleic anhydride) nanoparticles.
Keywords: Cyclosporine A, HPLC-UV, nanoparticles, poly (methylvinylether-co-maleic anhydride), oral administration
Cyclosporine A (CYA) is a cyclic undecapeptide (fig. 1) with a potent immunosuppressive activity that is widely used to prevent transplanted organ rejection[1]. CYA is also employed for the treatment of various autoimmune diseases[2]. However, its oral absorption remains limited due to its high lipophilicity, low intestinal permeability, P-glycoprotein efflux from the enterocytes[3] and extensive presystemic metabolism in the gut wall and liver[4,5,6].
Fig. 1.

Chemical structure of CYA.
CYA is cyclosporine A.
Colloidal drug carriers such as nanoparticles have been developed to improve oral bioavailability of drugs that are either poorly absorbed or are susceptible to gastrointestinal degradation[7,8]. Hence, the formulation of CYA as nanoparticles has received much attention in recent years as a suitable alternative system for drug delivery[9,10,11,12,13,14,15,16,17]. In this context, we have developed poly(methylvinylether-co-maleic anhydride) (PVM/MA) nanoparticles loaded with CYA, in order to evaluate their ability as oral carriers. This synthetic copolymer (fig. 2) is widely used for pharmaceutical purposes as a thickening and suspending agent, denture adhesive and adjuvant for transdermal patches[18]. PVM/MA nanoparticles have revealed an exceptional ability to establish bioadhesive interactions within the gut[19].
Fig. 2.

Chemical structure of PVM/MA.
PVM/MA is poly(methylvinylether-co-maleic anhydride).
Since the current research involves the development and evaluation of new pharmaceutical dosage forms for oral administration of CYA based on the use of the PVM/MA nanoparticles, the first important step in this project was to have a suitable analytical method to quantify the drug in these nanoparticulate systems. Several assays have been described for the measurement of this drug; some of them are based on radioimmunoassay (RIA)[20,21]. This technique does not represent a viable analytical method to quantify the drug in routine analysis of quality control (QC) of CYA in pharmaceutical forms. Others analytical methods are based on high performance liquid chromatography (HPLC) coupled with mass-spectrometry[22,23,24,25], however, it is a very expensive equipment. Many methods reported in literature for assaying CYA are based on the HPLC with ultraviolet detection (UV)[13,26,27,28,29,30,31,33]. Some of them have been successfully applied to assay CYA in pharmacokinetics studies and others to analysis of the drug in different pharmaceutical preparations. However, the chromatographic conditions of these methods were not suitable to quantify unequivocally CYA loaded in PVM/MA nanoparticles; the polymer interfered with the peak of the drug so these methods lacked selectivity to quantify CYA in the samples of this study. The difficulty with all HPLC-UV methods is related to CYA's lack of chromophores that imply the use of short-wavelength ultraviolet light detection (e.g. 205, 210 nm), and many molecular species absorb energy at this wavelength.
Therefore, the aim of the present study was to develop a simple and reliable HPLC-UV method to quantify the CYA incorporated into PVM/MA nanoparticles. Additionally, the analytical method was applied to assay the drug released from these nanoparticulate systems.
MATERIALS AND METHODS
CYA (ref. L-0602070 AN0617424) was provided by Roig Parma S.A. (Barcelona, Spain). PVM/MA (Gantrez® AN 119; MW 200 000) was kindly gifted by ISP (Barcelona, Spain). Acetone and ethanol (analytical grade) were purchased from VWR Prolabo (Fontenay Sous Bois, France), acetonitrile (ACN) and ethanol (HPLC grade) were supplied by Merck (Darmstadt, Germany). Deionised reagent water (18.2 MΩ cm resistively) was prepared in our laboratory using a water purification system (Wasserlab, Pamplona, Spain).
Stock solutions of CYA (0.50 and 0.35 mg/ml) were prepared by dissolving 5.0 and 3.5 mg of the drug in 10 ml of ethanol:water (1:1, v/v), containing 100 and 40 mg of PVM/MA, respectively. The matrix to prepare standard curve and QC samples was the same as the nanoparticle samples. The stock solutions were stored at 4°. The standard calibration samples required for constructing calibration curve and QC samples were prepared by dilution from stock solutions with appropriate volumes of the ethanol:water (1:1, v/v). Although it was found that these solutions were stable for long periods, we preferred preparing them freshly each day.
Chromatographic system:
HPLC analysis was performed using a Hewlett Packard 1050 (Waldbronn, Germany) system equipped with a quaternary pump, an autosampler, a heated column compartment and a diode-array detector. System management and data acquisition were performed by the HP ChemStation 3D software used with a HP personal computer.
Chromatographic separation of the CYA from potentially interfering substances was achieved at 75° on an Ultrabase-C18 column (250×4.6 mm, 5 μm particle size) (Scharlau, Barcelona, Spain), preceded by an ODS guard column (Teknokroma, Barcelona, Spain). The mobile phase consisted of ACN and deionised water (W) and was used as a gradient mode as follows: 80% ACN to 100% ACN over a period of 1 min and 100% ACN isocratic during 8 min. Then the gradient was returned to 80% ACN to prepare for the next run. The mobile phase flow rate was 1 ml/min and the effluent was monitored at 205 nm.
Method validation:
The method was validated according to the guidelines besed on the International Conference on Harmonisation for the validation of analytical procedures[34]. The parameters, which were used to validate the analytical method, were selectivity, limit of detection (LOD), limit of quantitation (LOQ), linearity, precision and accuracy.
The selectivity of the assay was determined by the individual analysis of blank samples. The retention time of the polymer used in the preparation process of those particulate systems was compared with that of CYA. Under the chromatographic conditions used, no peaks with retention times similar to that of CYA must be observed. LOD and LOQ were estimated from the signal-to-noise ratios. The detection limit was defined as the lowest concentration level resulting in a peak area of three times the baseline noise. The quantitation limit was defined as the lowest concentration level that provided a peak area with a signal-to-noise ratio higher than 10, with a precision and accuracy less than 10%.
The calibration curve of CYA was established from eight standard calibration samples over the 22-250 μg/ml concentration range. Calibration curve was done in triplicate. Peak areas of CYA versus the corresponding drug concentrations were plotted. Calibration curves were determined by least square linear regression analysis. Moreover, the coefficient of variation of the factors of response (linearity test) was calculated in order to confirm the linearity. This value must be less than 10%.
The intraday and interday precision were determined by analysing six replicates of QC samples at concentrations of 31.25, 62.5, 125 and 250 μg/ml on the same day and on six different days, respectively. The variability was expressed as the percentage of the relative standard deviation (%RSD) of replicate measurements. To be acceptable, the values should be less than 10% at all concentrations. Accuracy of the assay method was defined as the percentage of the systematic error, which was calculated as the agreement between the measured value and the true value as follows, % accuracy=(Cobs−Ctheor/Ctheor)×100, where Cobs is the determined concentration of a QC and Ctheor is the theoretical concentration. To be acceptable, the values should be less than 10% at all concentrations. Accuracy was calculated from the same samples as those used for precision studies.
Preparation of CYA-loaded PVM/MA nanoparticles:
PVM/MA nanoparticles were prepared by the solvent displacement method previously described by Arbos et al.[18] with a few modifications. Briefly, the required amounts of PVM/MA and CYA were dissolved in acetone and incubated for 60 min with constant stirring. Later, an appropriate volume of ethanol:water (10:3, v/v) was poured into the mixture. After incubating for 20 min at 300 rpm, the organic solvents were eliminated under reduced pressure and a suitable volume of ethanol was added to the aqueous suspension. The cyclosporine nonencapsulated was present in the supernatant. The resulting nanoparticles were purified twice by ultracentrifugation at 27 141×g for 20 min and dried by lyophilisation. In the same way, empty nanoparticles were also prepared. The particle size and the zeta potential of nanoparticles were determined by photon correlation spectroscopy (PCS) and electrophoretic laser Doppler anemometry, respectively, using a Zetamaster analyser system (Malvern Instruments, UK).
Application of the method:
This HPLC-UV method was applied to the determination of CYA content in PVM/MA nanoparticles as well as to in vitro drug release studies. For analysis, nanoparticles were solubilised with ACN (1:4, v/v). The sample was filtrated on 0.45 μm filters and an aliquot (100 μl) was injected into the HPLC. The analysis was done in triplicate and the results were expressed as the drug loading, calculated as follows, drug loading=amount of CYA in nanoparticles (μg)/PVM/MA nanoparticles (mg). The amount of PVM/MA transformed into nanoparticles was calculated by gravimetry[18].
Moreover, the encapsulation efficiency (%EE) of CYA in the nanoparticles was calculated as (Qassociated/Qinitial)×100; where Qassociated is the amount of entrapped CYA into the particles and Qinitial is the initial amount of CYA added to the formulation.
The in vitro release of CYA from PVM/MA nanoparticles was carried out under sink conditions in two different media: gastric (SGF) and intestinal (SIF) simulated fluids (pH 1.7 and 6.8, respectively). These studies were conducted independently. Each study was performed at 37±1° under agitation in a thermostated water bath (Unitronic-Orbital, J. P. Selecta, Barcelona, Spain) after the dispersion of CYA-nanoparticle formulation with the appropriate medium (SGF or SIF). Under these experimental conditions, an exact amount of nanoparticles, sufficient for establishing sink conditions, was resuspended in 15 ml of the assayed medium. Eight samples were prepared and incubated for 4 h. Each study was performed in triplicate. At different time intervals (5, 30, 60, 90, 150, 180, 210 and 240 min) samples were centrifuged (27 141×g, 20 min, 4°) and CYA in the supernatant was determined by proposed HPLC method. The release rate profiles were drawn as the percentage drug released from the nanoparticles versus time.
RESULTS AND DISCUSSION
The HPLC method was developed to provide a specific procedure for the rapid determination of CYA in PVM/MA nanoparticles. During the preliminary investigations, a Zorbax Eclipse XBD-C8 and Ultrabase C18 columns were tested for the selection of the most appropriate. In order to shorten the retention time of CYA and to improve peak symmetry, different mobile phases like ACN:water or ACN:water:isopropanol, different ratios, isocratic or gradient elutions, flow rates, water pHs, and column temperatures were studied. Taken into consideration the preliminary results, we decided to use the Ultrabase C18 column; its sensitivity and resolution was better when compared with the Zorbax Eclipse XBD-C8 column. In this sense, optimal separation was obtained using ACN:water as mobile phase, the gradient elution previously described, a flow-rate of 1 ml/min and the column temperature set at 75°.
Under the assay conditions described, the retention time for CYA was around 6.5 min and the analysis time was less than 10 min, which make this method suitable for analysing a large number of samples in a short period of time. The method demonstrated excellent chromatographic selectivity; the PVM/MA present in experimental nanoparticles does not interfere with the drug peak. In addition, good peak symmetry and minimal band spreading were obtained. Representative chromatograms are shown in (fig. 3).
Fig. 3.
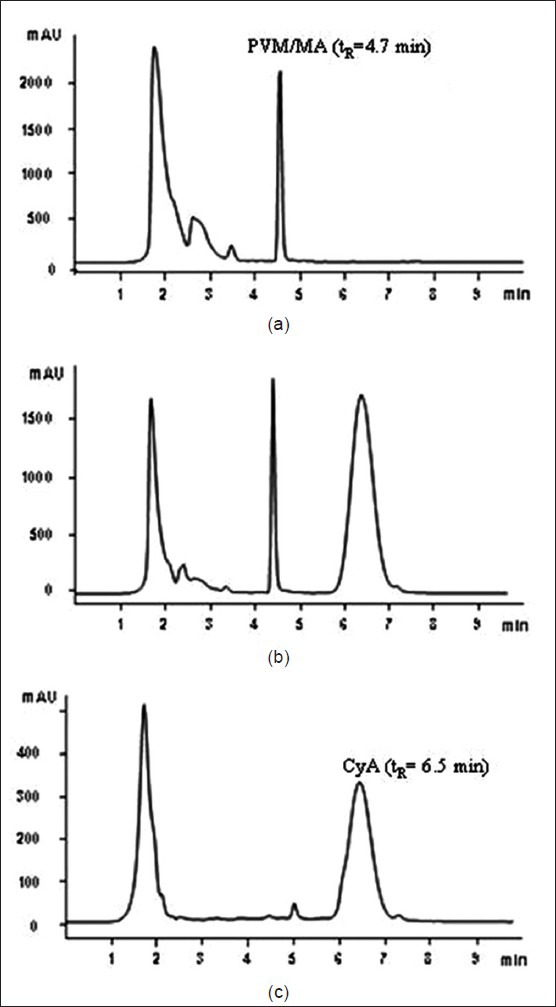
Chromatograms of drug, blank and drug-loaded nanoparticles.
Chromatograms obtained after processing a drug-free PVM/MA solution (a), a calibration standard containing 250 mg/ml of CYA (b) and PVM/MA nanoparticles loading CYA (c). tR is retention time, PVM/MA is poly(methylvinylether-co-maleic anhydride) with tR of 4.7 min, CYA is cyclosporine A with tR of 6.5 min.
LOD and LOQ values of the drug with the developed HPLC method were 1.36 and 2.35 μg/ml, respectively. The quantitation limit was confirmed, in separate experiments, using five calibrators with nominal concentrations of 2.35 μg/ml. The %RSD of replicate measurements and the accuracy value were below 7.5%.
To quantify CYA in the different samples obtained in this work, a calibration curve over the 22-250 μg/ml range was adequate although LOQ was 2.35 μg/ml. The method exhibited linearity between the chromatographic response (y) and the corresponding concentration of CYA (x) over this concentration range (typical Eqn.: y=247.79x+0.072). Furthermore, linear regression analysis showed correlation coefficient higher than 0.999 and the coefficient of variation of the response factors was less than 5%.
Though the use of internal standards in HPLC analyses generally improve the accuracy and precision of the assay, in this case was not necessary. Accuracy values were within acceptable limits; the deviation from theoretical values was less than 5.5% at all concentrations levels studied (Table 1). The results for intraday and interday precision (Table 1) were also acceptable; RSDs were less than 6.5% for all samples over the concentration range assayed.
TABLE 1.
INTRADAY PRECISION, ACCURACY AND INTERDAY PRECISION OF THE HPLC ASSAY FOR CYA

The reported method was successfully applied to the determination of CYA content in PVM/MA nanoparticles. After analysis of the samples, it was found that the drug loading was 3.3±0.56 μg/mg of PVM/MA nanoparticles and the %EE was 4.7±1.70%. In contrast, these nanoparticles displayed a size of about 200 nm, close to that measured for empty nanoparticles, and the particle size distribution was quite homogeneous showing low polydispersity.
Additionally, the developed method was applied to assay the drug released from PVM/MA nanoparticles. After incubation in SGF and SIF, the in vitro release of CYA from these nanoparticulate systems showed an initial soft burst effect (fig. 4). In the first 5 min, the drug released in SGF was about 30% and remained constant over 4 h. In parallel, drug released in SIF at 5 min was 20% and 4 h later this percentage was 42%.
Fig. 4.

CYA release profile from PVM/MA nanoparticles in SGF and SIF.
CYA release profile from PVM/MA nanoparticles after incubation in simulated gastric and intestinal fluids at 37°. Data represented as mean±SD (n=3). CYA=cyclosporine A, PVM/MA=poly(methylvinylether-co-maleic anhydride), SGF=simulated gastric fluid, SIF=simulated intestinal fluid, SD=standard deviation for n=3 observations.
Presently, this experimental formulation is being optimised in terms of drug loading by testing different excipients such as cyclodextrins and polyethylene glycol. Importantly, we found that under the chromatographic conditions described, these substances do not interfere with the drug peak. Therefore, the developed method could be applied to quantify CYA in these new nanoparticles.
In conclusion, the method described is sensitive enough for the quantitative determination of CYA loaded in PVM/MA nanoparticles as well as the released drug from them. Moreover, simplicity and efficacy of the assay as well as the relatively short retention time of the drug permit the analysis of a large number of samples in a short time, making it a fast and inexpensive method.
ACKNOWLEDGEMENTS
This work was supported by Fundación Caja Navarra and M. Pecchio received fellowship of SENACYT-IFARHU of Government of Panama.
Footnotes
Pecchio, et al.: HPLC Method to Quantify Cyclosporine A in Nanoparticles
REFERENCES
- 1.Matzke GR, Luke DR. Dialysis and renal transplant therapy. In: Herfindal ET, Gourley DR, Hart LL, editors. Clinical Pharmacy and Therapeutics. Baltimore: Williams and Wilkins; 1988. pp. 229–42. [Google Scholar]
- 2.Talal N. Cyclosporine as an immunosuppressive agent for autoimmune disease: Theoretical concepts and therapeutic strategies. Transplant Proc. 1988;20:11–5. [PubMed] [Google Scholar]
- 3.Hebert MF. Contributions of hepatic and intestinal metabolism and P-glycoprotein to cyclosporine and tacrolimus oral drug delivery. Adv Drug Deliv Rev. 1997;27:201–14. doi: 10.1016/s0169-409x(97)00043-4. [DOI] [PubMed] [Google Scholar]
- 4.Kolars JC, Awni WM, Merion RM, Watkins PB. First-pass metabolism of cyclosporine by the gut. Lancet. 1991;338:1488–90. doi: 10.1016/0140-6736(91)92302-i. [DOI] [PubMed] [Google Scholar]
- 5.Webber IR, Peters WH, Back DJ. Cyclosporine metabolism by human gastrointestinal mucosal microsomes. Br J Clin Pharmacol. 1992;33:661–4. doi: 10.1111/j.1365-2125.1992.tb04098.x. [DOI] [PMC free article] [PubMed] [Google Scholar]
- 6.Wu CY, Benet LZ, Hebert MF, Gupta SK, Rowland M, Gomez DY, et al. Differentiation of absorption and first-pass gut and hepatic metabolism in humans: Studies with cyclosporine. Clin Pharmacol Ther. 1995;58:492–7. doi: 10.1016/0009-9236(95)90168-X. [DOI] [PubMed] [Google Scholar]
- 7.Labhasetwar V. Nanoparticles for drug delivery. Pharm News. 1997;4:28–31. [Google Scholar]
- 8.Panyam J, Labhasetwar V. Biodegradable nanoparticles for drug and gene delivery to cells and tissue. Adv Drug Deliv Rev. 2003;55:329–47. doi: 10.1016/s0169-409x(02)00228-4. [DOI] [PubMed] [Google Scholar]
- 9.Bonduelle S, Pimienta C, Benoit JP, Lenaerts V. Body distribution in mice of intravenously injected radiolabelled cyclosporin associated with polyisohexylcyanoacry late nanocapsules or nanospheres. Eur J Pharm Biopharm. 1995;41:27–30. [Google Scholar]
- 10.Sanchez A, Alonso MJ. Poly (D, L-lactide-co-glycolide) micro and nanospheres as a way to prolong blood/plasma levels of subcutaneously injected cyclosporin A. Eur J Pharm Biopharm. 1995;41:31–7. [Google Scholar]
- 11.Zhang Q, Yie G, Li Y, Yang Q, Nagai T. Studies on the cyclosporin A loaded stearic acid nanoparticles. Int J Pharm. 2000;200:153–9. doi: 10.1016/s0378-5173(00)00361-6. [DOI] [PubMed] [Google Scholar]
- 12.El-Shabouri MH. Positively charged nanoparticles for improving the oral bioavailability of cyclosporin A. Int J Pharm. 2002;249:101–8. doi: 10.1016/s0378-5173(02)00461-1. [DOI] [PubMed] [Google Scholar]
- 13.Jaiswal J, Gupta SK, Kreuter J. Preparation of biodegradable cyclosporine nanoparticles by high-pressure emulsification-solvent evaporation process. J Control Release. 2004;96:169–78. doi: 10.1016/j.jconrel.2004.01.017. [DOI] [PubMed] [Google Scholar]
- 14.Wang XQ, Dai JD, Chen Z, Zhang T, Xia GM, Nagai T, et al. Bioavailability and pharmacokinetics of cyclosporine A-loaded pH-sensitive nanoparticles for oral administration. J Control Release. 2004;97:421–9. doi: 10.1016/j.jconrel.2004.03.003. [DOI] [PubMed] [Google Scholar]
- 15.Italia JL, Bhatt DK, Bhardwaj V, Tikoo K, Kumar MN. PLGA nanoparticles for oral delivery of cyclosporine: Nephrotoxicity and pharmacokinetic studies in comparison to Sandimmune Neoral. J Control Release. 2007;119:197–206. doi: 10.1016/j.jconrel.2007.02.004. [DOI] [PubMed] [Google Scholar]
- 16.Gupta MK, Mishra B, Prakash D, Rai SK. Nanoparticulate drug delivery system of cyclosporine. Int J Pharm Pharm Sci. 2009;1:81–92. [Google Scholar]
- 17.Urbán-Morlán Z, Ganem-Rondero A, Melgoza-Contreras LM, Escobar-Chávez JJ, Nava-Arzaluz MG, Quintanar-Guerrero D. Preparation and characterization of solid lipid nanoparticles containing cyclosporine by the emulsification-diffusion method. Int J Nanomed. 2010;5:611–20. doi: 10.2147/IJN.S12125. [DOI] [PMC free article] [PubMed] [Google Scholar]
- 18.Arbós P, Wirth M, Arangoa MA, Gabor F, Irache JM. Gantrez ® AN as a new polymer for the preparation of ligand–nanoparticle conjugates. J Control Release. 2002;83:321–30. doi: 10.1016/s0168-3659(02)00015-9. [DOI] [PubMed] [Google Scholar]
- 19.Agüeros M, Areses P, Campanero MA, Salman H, Quincoces G, Peñuelas I, et al. Bioadhesive properties and biodistribution of cyclodextrin–poly (anhydride) nanoparticles. Eur J Pharm Sci. 2009;37:231–40. doi: 10.1016/j.ejps.2009.02.010. [DOI] [PubMed] [Google Scholar]
- 20.Morse GD, Holdsworth MT, Walshe JJ. Comparison of Cyclosporine assay methodology in the immediate postoperative period of renal transplantion. Ther Drug Monit. 1989;11:238–45. doi: 10.1097/00007691-198905000-00004. [DOI] [PubMed] [Google Scholar]
- 21.Huupponen R, Hirvisalo EL, Neuvonen P. Comparison of cyclophilin binding assay and radioimmunoassay in monitoring of blood cyclosporine. Ther Drug Monit. 1997;19:446–9. doi: 10.1097/00007691-199708000-00014. [DOI] [PubMed] [Google Scholar]
- 22.Najib NM, Idkaidek N, Adel A, Mohammed B, Al-Masri S, Admour I, et al. Comparison of two cyclosporine formulations in healthy Middle Eastern volunteers: Bioequivalence of the new Sigmasporin Microoral and Sandimmun Neoral. Eur J Pharm Biopharm. 2003;55:67–70. doi: 10.1016/s0939-6411(02)00157-1. [DOI] [PubMed] [Google Scholar]
- 23.Poquette MA, Lensmeyer GL, Doran TC. Effective use of liquid chromatography-mass spectrometry (LC/MS) in the routine clinical laboratory for monitoring sirolimus, tacrolimus and cyclosporine. Ther Drug Monit. 2005;27:144–50. doi: 10.1097/01.ftd.0000148451.35811.74. [DOI] [PubMed] [Google Scholar]
- 24.Salm P, Taylor PJ, Lynch SV, Warnholtz CR, Pillans PI. A rapid HPLC-mass spectrometry cyclosporin method suitable for current monitoring practices. Clin Biochem. 2005;38:667–73. doi: 10.1016/j.clinbiochem.2005.04.009. [DOI] [PubMed] [Google Scholar]
- 25.Ansermot N, Fathi M, Veuthey JL, Desmeules J, Rudaz S, Hochstrasser D. Simultaneous quantification of cyclosporine, tacrolimus, sirolimus and everolimus in whole blood by liquid chromatography–electrospray mass spectrometry. Clin Biochem. 2008;41:728–35. doi: 10.1016/j.clinbiochem.2008.02.014. [DOI] [PubMed] [Google Scholar]
- 26.Brozmanová H, Grundmann M, Safarcík K, Jegorov A. High-performance liquid chromatographic method for therapeutic drug monitoring of cyclosporine A and its two metabolites in renal transplant patients. J Chromatogr B Biomed Sci Appl. 2000;749:93–100. doi: 10.1016/s0378-4347(00)00384-4. [DOI] [PubMed] [Google Scholar]
- 27.Kumar M, Singhal SK, Singh A. Development and validation of a stability indicating HPLC assay method for cyclosporine in cyclosporine oral solution USP. J Pharm Biomed Anal. 2001;25:9–14. doi: 10.1016/s0731-7085(00)00498-2. [DOI] [PubMed] [Google Scholar]
- 28.Amini H, Ahmadiani A. Simple determination of cyclosporine in human whole blood by high-performance liquid chromatography. J Chromatogr B Analyt Technol Biomed Life Sci. 2003;795:209–14. doi: 10.1016/s1570-0232(03)00569-5. [DOI] [PubMed] [Google Scholar]
- 29.Ouyang J, Baeyens WR, Duan J, Delanghe J. Improvement of cyclosporin A determination in whole blood by reversed-phase high-performance liquid chromatography. Biomed Chromatogr. 2003;17:404–10. doi: 10.1002/bmc.262. [DOI] [PubMed] [Google Scholar]
- 30.Baldelli S, Zenoni S, Merlini S, Perico ND, Cattaneo D. Simultaneous determination of everolimus and cyclosporine concentrations by HPLC with ultraviolet detection. Clin Chim Acta. 2006;364:354–8. doi: 10.1016/j.cca.2005.07.019. [DOI] [PubMed] [Google Scholar]
- 31.31th ed. Rockville: United States Pharmacopeial Convention; 2008. USP. The United States Pharmacopeia. [Google Scholar]
- 32.Bonifacio FN, Giocanti M, Reynier JP, Lacarelle B, Nicolay A. Development and validation of HPLC method for the determination of Cyclosporin A and its impurities in Neoral ® capsules and its generic versions. J Pharm Biomed Anal. 2009;49:540–6. doi: 10.1016/j.jpba.2008.11.027. [DOI] [PubMed] [Google Scholar]
- 33.Aziz F, Gupta A, Khan MF. Development and validation of a RP-HPLC method for determination of cyclosporine in capsule. Indian J Pharm Sci. 2010;72:252–5. doi: 10.4103/0250-474X.65030. [DOI] [PMC free article] [PubMed] [Google Scholar]
- 34.Geneva, Switzerland: International Conference on Harmonisation; 1996. ICH, Q2(R1), Harmonised Tripartite Guideline, Validation of Analytical Procedures: Text and Methodology, Current Step 4 Version, Parent Guideline on Methodology. [Google Scholar]