

Abstract
Background
Lung maturation is a late fetal developmental event in both mice and humans. Because of this, lung immaturity is a serious problem in premature infants. Disruption of genes for either the glucocorticoid receptor (Nr3c1) or the NFIB transcription factors results in perinatal lethality due to lung immaturity. In both knockouts, the phenotype includes excess cell proliferation, failure of saccularization and reduced expression of markers of epithelial differentiation. This similarity suggests that the two genes may co-regulate a specific set of genes essential for lung maturation.
Results
We analyzed the roles of these two transcription factors in regulating transcription using ChIP-seq data for NFIB, and RNA expression data and motif analysis for both. Our new ChIP-seq data for NFIB in lung at E16.5 shows that NFIB binds to a NFI motif. This motif is over-represented in the promoters of genes that are under-expressed in Nfib-KO mice at E18.5, suggesting an activator role for NFIB. Using available microarray data from Nr3c1-KO mice, we further identified 52 genes that are under-expressed in both Nfib and Nr3c1 knockouts, an overlap which is 13.1 times larger than what would be expected by chance. Finally, we looked for enrichment of 738 recently published transcription factor motifs in the promoters of these putative target genes and found that the NFIB and glucocorticoid receptor motifs were among the most enriched, suggesting that a subset of these genes may be directly activated by Nfib and Nr3c1.
Conclusions
Our data provide the first evidence for Nfib and Nr3c1 co-regulating genes related to lung maturation. They also establish that the in vivo DNA-binding specificity of NFIB is the same as previously seen in vitro, and highly similar to that of the other NFI-family members NFIA, NFIC and NFIX.
Keywords: Lung development, Nr3c1, Glucocorticoid receptor, Nfib, Regulation of transcription, ChIP-seq analysis, Expression analysis, Motif analysis, Transcription factor
Background
Lung development is a complex developmental process initiated by budding of the lungs from the gut endodermal tube, multiple rounds of expansion and branching morphogenesis, and final maturation of the epithelial and endothelial components that comprise the airways, pulmonary circulation, and gas exchange surface [1,2]. It is the final maturation of the lung epithelial cells that is frequently interrupted by premature birth, leading to both acute and chronic lung disease in premature infants [3,4]. Here we demonstrate apparently related roles of the Nfib and glucocorticoid receptor (hereafter either Nr3c1 or GR) genes in lung maturation.
Previous studies showed that loss of Nfib resulted in perinatal lethality due to lung immaturity [5]. The lungs of late fetal mice lacking Nfib showed reduced expression of Type I and Type II epithelial markers along with morphological immaturity exemplified by a failure of the formation of saccules, the precursor to the alveolar air exchange region. In addition, excess proliferation of both mesenchymal and epithelial cells is seen in Nfib null lungs. Surprisingly, while the phenotype is clearly related to the failure of epithelial cell maturation, loss of Nfib only in the mesenchymal cells of the lung yields a very similar phenotype [6], indicating that mesenchymal cells regulate late epithelial maturation through as yet unknown inductive mechanisms [7].
Prenatal administration of glucocorticoids has been shown to stimulate lung maturation in both mice and premature infants [8-10]. Conversely, deletion of Nr3c1, the gene encoding the glucocorticoid receptor, results in a phenotype remarkably similar to that of loss of Nfib, including excess cell proliferation, failure of saccularization and reduced expression of markers of epithelial differentiation [10]. As with Nfib, loss of Nr3c1 only in the mesenchyme recapitulates much of this phenotype [11]. The similarity in phenotype seen with the loss of either Nfib or Nr3c1, together with the shared cell-type expression requirement suggests that these two genes may co-regulate a specific set of genes essential for lung maturation. We therefore examined the lung genes regulated by Nfib and Nr3c1 and the specific binding targets of NFIB to determine how these genes may cooperate in the regulation of lung maturation.
Results
ChIP-seq shows that NFIB binds to the known NFI motif in mouse fetal lung
We conducted a ChIP-seq analysis of NFIB in wild type mouse fetal lung at E16.5 and identified 759 peaks from an initial set of 8,717,818 unpaired reads (see Methods). The distribution of the distances between these peaks and the closest TSS shows a strong enrichment within 1 kbp both upstream and downstream of the TSSs compared to a random control (Figure 1). Peaks are particularly enriched at about 100bp upstream of the nearest known TSS, showing that NFIB frequently binds the proximal promoter. There is also considerable enrichment of peaks downstream of the nearest known TSS for several hundred base-pairs. This could represent either binding in the 5’UTR of the known gene or binding in the promoter of an unannotated alternative transcript.
Figure 1.
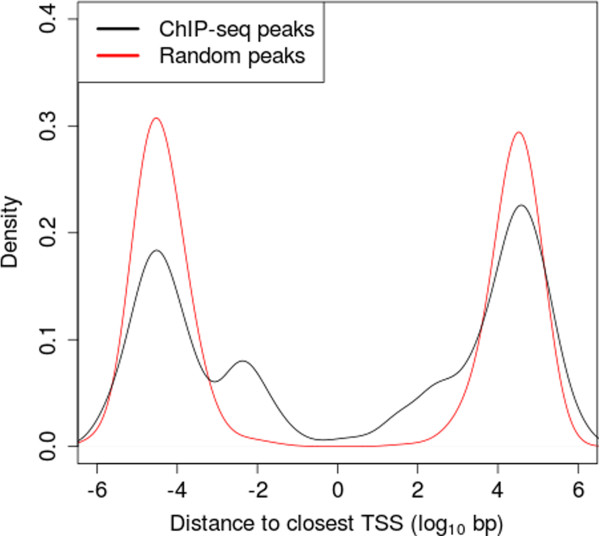
Distribution of NFIB ChIP-seq peaks relative to closest TSS. The black curve represents the distribution of the distances between the 759 NFIB ChIP-seq peaks and the closest TSS. Negative distances correspond to upstream peaks and positive distances to downstream peaks. The red curve shows the distances when the peaks are randomly and uniformly repositioned on their chromosomes. Density is estimated using a Gaussian kernel with bandwidth h=0.4.
We applied the MEME algorithm [12] to repeat-masked [13], 100bp genomic regions centered on each of the 759 NFIB ChIP-seq peaks. The most statistically significant motif found by MEME matches the known NFIB palindromic consensus sequence TGGCnnnnnGCCA. More importantly, the motif found by MEME is extremely similar to the in vitro NFIB motif obtained by Jolma et al.[14] using SELEX technology (Figure 2). This observation confirms that NFIB has similar DNA-binding specificity in mouse fetal lung cells as in a cell-free in vitro system. The palindromic binding motif found by MEME further strongly suggests that NFIB binds mainly as a dimer in these cells. Finally, the strong similarity between the in vivo and in vitro motifs for NFIB in Figure 2 show that the ChIP-seq experiment and downstream data analysis succeeded.
Figure 2.
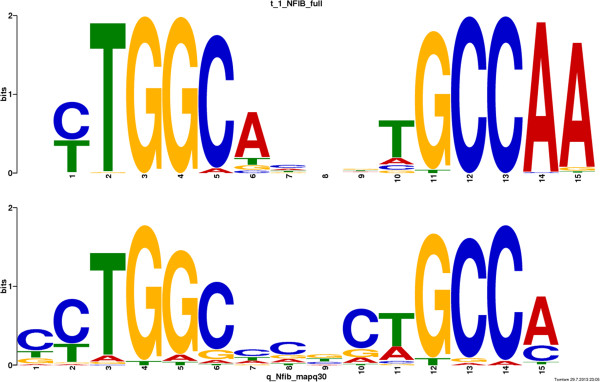
NFIB DNA-binding motifs in mouse fetal lung and in vitro. The motif reported by Jolma et al. [14] using SELEX is shown above the motif discovered by MEME in mouse fetal lung NFIB ChIP-seq peak regions.
To further assess the quality of our ChIP-seq data, we considered the fraction of predicted ChIP-seq peaks that contain a match to the discovered NFIB motif at different motif score thresholds, as computed by the FIMO scanning algorithm [15]. At a motif score p-value threshold of 10-5, the NFIB motif is present in 10.1% of the ChIP-seq peaks but in only 1.7% of the randomized control sequences (Figure 3). This represents a six-fold enrichment (77/13 = 5.92), which exceeds the ENCODE guidelines requiring at least 10% of the peaks to have a four-fold enrichment for the ChIPed TF’s binding motif [16].
Figure 3.
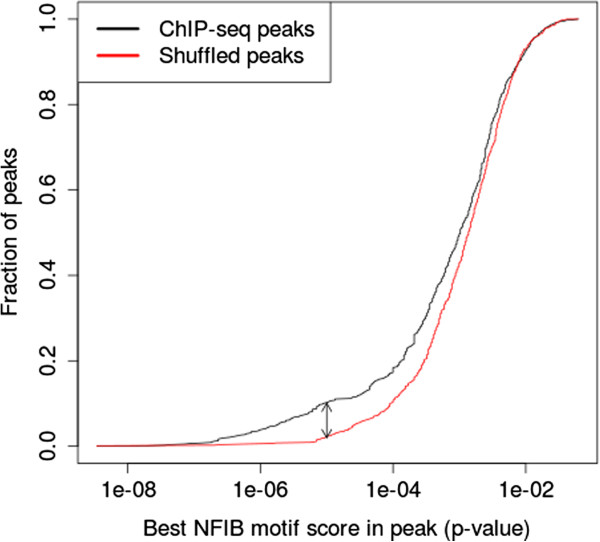
Enrichment of the NFIB motif in NFIB ChIP-seq peaks. The black curve shows the fraction of 759 ChIP-seq peaks with at least one predicted NFIB binding site using different motif score thresholds. The red curve shows distribution obtained when each ChIP-seq peak region is shuffled while preserving trinucleotide frequencies.
Correlation of NFIB binding and expression of nearby genes
We studied the mechanism of transcriptional regulation by NFIB in fetal lung cells using our NFIB ChIP-seq data from E16.5 fetal lung cells and previously published gene expression data from E18.5 fetal lung cells in WT and Nfib-knockout mice [6].
We first sought for dysregulated genes in the Nfib-KO using a 2-fold expression change threshold and a maximal q-value of 0.05 for selection (see Methods).
We identified 631 genes, of which 412 are down-regulated and 219 are up-regulated. For convenience, we will refer to the down-regulated genes as “NFIB-activated”, and to the up-regulated as “NFIB-repressed”. Of course, we realize that the observed effect could be due to direct or indirect regulation of the gene in question (e.g., via NFIB interacting with another TF).
We then counted the numbers of genes with an NFIB ChIP-seq peak within 1 kbp, 10 kbp or 100 kbp (Table 1). As can be seen in Table 1, only 0.3% of the NFIB-activated genes (1 gene) have an NFIB ChIP-seq peak within 1 kbp of their TSS. This is a lower percentage than for all genes (1.2%), but the difference is not statistically significant (p=0.1, two-tailed Fisher’s exact test).
Table 1.
Number of NFIB-activated/repressed genes with an NFIB ChIP-seq peak near their TSS
| ≤1 kbp | ≤10 kbp | ≤100 kbp | |
|---|---|---|---|
| Activated (396) |
0.3% (1) |
1.3% (5) |
10.6% (42) |
| Repressed (203) |
1.0% (2) |
2.0% (4) |
8.4% (17) |
| All (11383) | 1.2% (140) | 2.2% (255) | 11.6% (1324) |
The table shows the percentage (number) of NFIB-activated, NFIB-repressed or all genes that have an NFIB peak within the given distance of their TSS. Percentages are in terms of the total number of genes in the given class. Note that we consider only genes for which we have both distance and expression data, so the numbers of activated/repressed genes presented in this table are slightly lower than the total number of NFIB-activated genes (412) and NFIB-repressed genes (219).
If we extend the analysis to binding at up to 10 kbp and 100 kbp from the TSS, neither the NFIB-activated nor NFIB-repressed genes have a number of NFIB ChIP-seq peaks that differs significantly from the number expected by chance (p>0.05, two-tailed Fisher’s exact test).
The lack of evidence of a clear relationship between proximal NFIB binding and gene expression in Table 1 may be due to the fact that the expression data is from a later stage of fetal lung development than the ChIP-seq data (E18.5 vs. E16.5). It is quite possible that the set of genes bound by NFIB changes substantially between E16.5 and E18.5. Another confounding factor is that the gene expression data comes from embryonic lungs where Nfib is deleted from E10, but expression is not measured until E18.5, leaving ample time for compensatory changes in gene expression. In fact among the 631 genes identified as activated or repressed at day E18.5 in the Nfib-KO mouse, 28 are annotated as having “sequence-specific DNA binding transcription factor activity” in the Gene Ontology (GO) database [17]. The changes in expression of these TFs will affect the expression of many genes, so many of the observed dysregulated genes may be indirect rather than direct targets of Nfib. Another possibility is that the majority of regulation by NFIB is via long-distance chromatin looping [18], but we consider this unlikely given the clear enrichment of NFIB binding events we observe in proximal promoter regions (Figure 1).
Promoters of genes activated by NFIB are enriched in NFIB motifs, but repressed ones are not
In the absence of ChIP-seq data in E18.5 mouse fetal lung, we turned to a motif-based analysis of the relationship between NFIB binding and gene expression. First, we tested for over-representation of putative NFIB binding sites (predicted using our new NFIB motif) in the promoters of NFIB-activated and NFIB-repressed genes (see Methods). We found a significant enrichment in the NFIB-activated genes (pact<0.0013), but not in the NFIB-repressed (prep>0.3). This suggest that many genes are activated by NFIB through direct interaction, but that repression generally results from indirect regulation.
As a control and to get a broader picture, we then calculated pact and prep and our motif association score (MAS, see Methods) for each of the 738 SELEX-derived motifs reported by Jolma et al.[14], which cover the DNA-binding specificity of most transcription factor families in mammals. We found that the three motifs with the largest MAS are the three NFI-family motifs in the Jolma et al.[14] compendium (Figure 4 and Table 2). These motifs have large positive MAS scores, which indicates that their presence in the promoter of a gene is highly correlated with it having reduced expression in the Nfib-KO mouse at E18.5. This suggests that NFIB acts as a direct activator of transcription for many genes in our NFIB-activated set, in mouse fetal lung at E18.5. The complete MAS results are given in Additional file 1.
Figure 4.
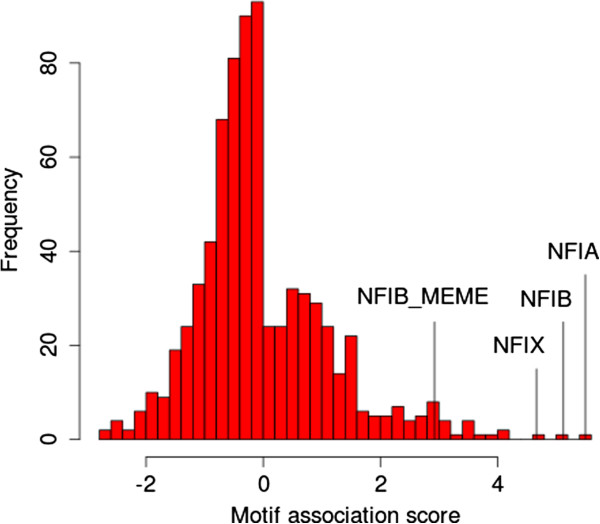
Motif Association Score distribution for Nfib targets. The histogram shows the distribution of the MAS for the 739 motifs in the compendium (our ChIP-seq motif inferred with MEME (Nfib_MEME) plus 738 mouse and human TF motifs determined by SELEX [14]).
Table 2.
Association of TF motifs with Nfib targets
| Motif | Gene | FC | p a c t | p r e p | MAS |
|---|---|---|---|---|---|
| NFIA_full |
Nfia |
2.27 |
<10-5 |
0.31 |
5.50 |
| NFIB_full |
Nfib |
*2.75 |
<10-5 |
0.27 |
5.12 |
| NFIX_full |
Nfix |
- |
<10-4 |
0.26 |
4.67 |
| Meis3_DBD_2 |
Meis3 |
NA |
<10-4 |
0.44 |
4.13 |
| MEIS3_DBD_2 |
Meis3 |
NA |
<10-4 |
0.44 |
4.03 |
| Meis2_DBD_2 |
Meis2 |
1.57 |
0.0001 |
0.53 |
3.98 |
| SNAI2_DBD |
Snai2 |
1.72 |
0.0002 |
0.86 |
3.78 |
| Rxra_DBD |
Rxra |
- |
0.0004 |
0.54 |
3.49 |
| EBF1_full |
Ebf1 |
- |
0.0004 |
0.46 |
3.49 |
| Rxrb_DBD |
Rxrb |
NA |
0.0004 |
0.69 |
3.49 |
| NR2F6_DBD_2 |
Nr2f6 |
- |
0.0004 |
0.75 |
3.46 |
| RXRA_DBD |
Rxra |
- |
0.0006 |
0.62 |
3.22 |
| NR2F1_DBD |
Nr2f1 |
1.83 |
0.0007 |
0.74 |
3.18 |
| RXRB_DBD |
Rxrb |
NA |
0.0007 |
0.41 |
3.16 |
| Pknox2_DBD |
Pknox2 |
- |
0.0009 |
0.41 |
3.05 |
| TFAP4_full |
Tfap4 |
NA |
0.0010 |
0.24 |
3.02 |
| PKNOX2_DBD |
Pknox2 |
- |
0.0010 |
0.60 |
3.00 |
| RXRG_DBD |
Rxrg |
NA |
0.0011 |
0.49 |
2.96 |
| NR2C2_DBD |
Nr2c2 |
- |
0.0012 |
0.65 |
2.93 |
| Nfib_MEME | Nfib | *2.75 | 0.0012 | 0.34 | 2.92 |
The table shows the TF motif name (motif), associated gene name (gene), expression fold-change (FC) of the gene, the (unadjusted) motif enrichment p-value in the activated set of genes (pact), the (unadjusted) motif enrichment p-value in the repressed set of genes (prep), and the motif association score (MAS). Rank is based on the magnitude of the MAS, “NA” indicates that no expression data is available for the TF gene and “-” in the FC column indicates that expression change is not significant (p-value >0.05). Motif names all in uppercase are derived from human TFs, others are from mouse TFs. *Although Nfib expression increases in the Nfib-KO, no functional protein is produced.
As an additional control, we repeated the complete MAS analysis after replacing mouse promoter sequences by their ortholog from rat or human. For both species, NFI motifs were among the most strongly enriched within the set of NFIB-activated genes. In human, NFIX ranked second (pact<10-4), and NFIB ranked fourteenth (pact<10-3). In rat, NFIX ranked third (pact<10-3) and NFIB ranked tenth (pact<10-3). Overall, this strongly support the hypothesis that NFIB activates its targets during lung maturation through direct interactions near the promoter regions.
The presence of our novel, ChIP-derived NFIB motif in gene promoters shows less significant correlation with gene expression than the SELEX-based motifs for NFIA, NFIB and NFIX (Table 2). The new motif (NFIB_MEME) ranks twentieth according to MAS, despite being highly similar to the SELEX-based NFIB motif (Figure 2), from which it differs primarily in the preference for an ‘A’ in the right-most position. This may indicate that the new, ChIP-based motif is slightly less accurate than the SELEX-based motif, which, if true, could be due to numerous reasons. The accuracy of motifs derived from ChIP-seq experiments depends strongly on the number of sequences without the motif presented to the motif discovery algorithm. Such sequences can be due to imperfect antibody specificity or to indirect DNA-binding by the antibody via a protein complex or via chromatin loops bound jointly by the antibody and another DNA-binding protein [19]. None of these issues are present in SELEX experiments, although they suffer from their own limitations. There is no guarantee that the DNA-binding specificity of the protein or DNA-binding domain assayed by SELEX is the same under the in vitro SELEX conditions as it is in in vivo. At any rate, our expression correlation results suggest that the existing SELEX-based NFI-family motifs are at least as accurate as our ChIP-derived motif for NFIB.
Although our new NFIB motif ranks twentieth among the 739 motifs in the combined motif database, there are effectively only three distinct motifs with higher MAS scores (Figure 5). This is because the compendium contains motifs for both mouse and human TFs (e.g., Meis3 and MEIS3) and it contains multiple members of transcription factor families. Paralogous and orthologous TFs tend to have highly similar DNA-binding affinities, as shown by the highly similar motif logos at the leaves of the motif tree in Figure 5.
Figure 5.

Motifs associated with dysregulated genes in Nfib-KO mouse clustered by motif similarity. The tree shows the top 20 motifs according to MAS clustered using the Pearson Correlation Coefficient to measure the similarity between pairs of motifs, and the UPGMA tree-building algorithm to create the tree [20]. The tree was drawn using Phylodendron [21].
Other TFs may contribute to the Nfib-KO phenotype
For each motif in Table 2 we have included the expression fold change of the corresponding gene, if significant (p-value ≤0.05). The increased expression of Nfia in the Nfib-KO further suggests that there may be some compensatory mechanism at play between the two paralogs. Since the DNA-binding motif of NFIA is almost identical to that of NFIB, it is probable that both transcription factors bind to the same regulatory elements. Such an apparently compensatory change in one NFI family member upon loss of another was noted previously in Nfib-KO lungs and suggests some type of homeostatic regulation of total NFI levels [5]. However, these data are not sufficient to indicate whether NFIA acts as an activator or a repressor, or whether the same genes are regulated by both NFIA and NFIB.
In addition to the NFI motifs, we note the large positive MAS of the Meis, SNAI2 and NR2F1 motifs, indicating that they are enriched in the NFIB-activated gene set (i.e. in genes that are under-expressed in the Nfib-KO). Because Snai2, Meis2 and Nr2f1 are over-expressed in the Nfib-KO, it is possible that some genes in our NFIB-activated set are repressed by these genes instead of being directly activated by NFIB. Repressor activity has been documented for each of these three factors [22-24]. For example Snai2, which represses transcription via the recruitment of histone deacetylases to target gene promoters [25], is known for its antiapoptotic activity and plays a role in epithelial-mesenchymal transition. While neither epithelial-mesenchymal transition nor altered apoptosis seem implicated in the phenotype of Nfib-/- lungs [6], other epigenetic changes mediated by Snai2 affecting cell proliferation and cell differentiation are clearly possible and will be investigated. Finally, we note the enrichment of the EBF1 motif, which regulates cell differentiation [26]. However, according to the microarray data, the Ebf1 gene is not significantly dysregulated in the Nfib-KO.
The apparently paradoxical increased expression of Nfib in the Nfib-KO lungs (Table 2) is explained by the fact that only exon 2 (containing the DNA-binding domain and dimerization domain) is actually knocked out. The microarray is detecting an increase in a transcript that is missing exon 2, and thus cannot lead to a functional NFIB protein. One explanation for this increased expression from the Nfib promoter in the absence of production of a functional Nfib transcript is that NFIB normally represses its own production, either directly or indirectly (Table 3). A second possibility is that the shorter, disrupted transcript is less subject to post-transcriptional degradation that the complete transcript, leading to higher measured expression in the Nfib-KO lungs.
Table 3.
Comparison of expression change for some TFs of interest in Nfib - and Nr3c1 -knockout lungs
| |
Nfib
-KO |
Nr3c1
-KO |
||
|---|---|---|---|---|
| Gene | FC | p - value | FC | p - value |
|
Nfib |
*2.75 |
<10-5 |
2.17 |
0.001 |
|
Nr3c1 |
1.23 |
0.172 |
*3.14 |
<0.001 |
|
Nfia |
2.27 |
0.001 |
0.61 |
0.006 |
|
Snai2 |
1.72 |
<10-5 |
1.54 |
0.003 |
|
Meis2 |
1.57 |
0.023 |
2.03 |
0.012 |
| Nr2f1 | 1.83 | 0.001 | 1.66 | 0.003 |
For each knockout, the table shows the expression fold change and the associated uncorrected p-value (see Methods). The expression changes for Nfib and Nr3c1 transcripts in their respective KO (marked by an asterisk) occurs in the context of the transcripts lacking an essential exon and thus no functional protein is expressed.
Nfib and Nr3c1 regulate an overlapping set of genes
Nfib-knockout mice show a phenotype very similar to that seen in glucocorticoid receptor (Nr3c1) knockout mice. To ask whether this may be due to a common set of dysregulated genes, we compared our Nfib-KO microarray data with available microarray data for Nr3c1-KO in fetal mice lung at 18.5 [27]. Using the same selection threshold as for the Nfib-KO dataset (2-fold expression change and q-value ≤ 0.05), we identified 158 activated genes and 160 repressed genes by GR.
The sets of genes activated or repressed by GR overlap significantly with the analogous gene sets for NFIB (Table 4). The sets of activated genes share 52 genes in common, which is 13.1 times higher than what would be expected by chance, while the sets of repressed genes have 22 genes in common, a 9-fold enrichment.
Table 4.
Regulatory targets of Nfib and Nr3c1 overlap significantly
| Activated | Repressed | |
|---|---|---|
|
Nfib |
340 |
171 |
|
Nr3c1 |
117 |
143 |
| Observed overlap |
52 |
22 |
| Expected overlap |
4.0 |
2.5 |
| Overlap fold enrichment |
13.1 |
9.0 |
| Overlap enrichment p-value | <10-46 | <10-15 |
The table shows the sizes of the sets of activated and repressed genes for NFIB and GR, the size of the overlaps of the gene sets, the expected overlap size, fold enrichment of the overlap and the p-value of the overlap enrichment. Note that to compute the enrichment p-value, we must consider only the genes for which we have expression data for both knockouts (9990 genes), so the numbers of activated/repressed genes in this table are different than the numbers reported for the individual knockouts.
As we can see from Figure 6, the direction of the change in expression is the same for all but one of the genes activated/repressed in the two knockout experiments (Figure 6). The one gene whose expression changes in a different direction is Aspg (log2(FC) = 1.48 in Nfib-KO; -1.93 in Nr3c1-KO). The Pearson correlation coefficient between the log2(FC) in the two knockouts of these genes is 0.907. This strongly suggests that the common phenotype in the two knockouts are due to some or all of the genes in the overlap set. The list of genes activated/repressed in both datasets is available in Additional file 2.
Figure 6.
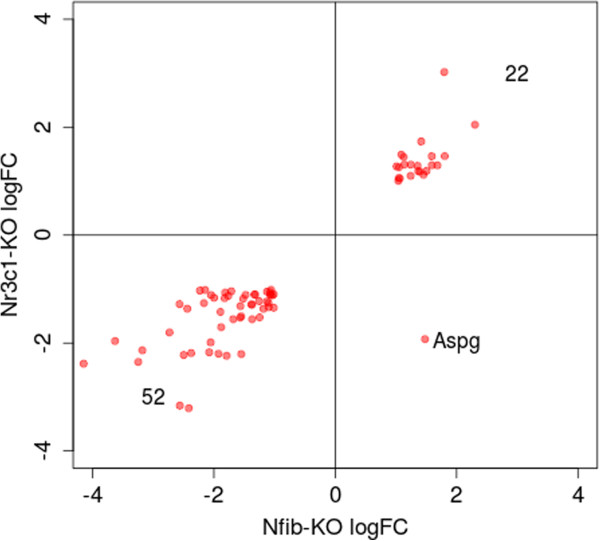
Expression change of genes activated/repressed in both Nfib-KO and Nr3c1-KO mice is highly correlated. Each point represents a gene activated/repressed in both knockouts. Expression change is expressed as log2(KO/WT), and only genes with a 2-fold change and a q-value less than 0.05 in both knockouts are shown.
Promoters of genes that are activated by both NFIB and GR are enriched in NFIB and GR motifs
To further test our hypothesis that Nfib and Nr3c1 co-regulate an overlapping set of genes, we looked for motif enrichment in the sets of commonly activated or repressed genes identified above. Figure 7 shows the distribution of the MAS score for 739 motifs in the Jolma et al.[14] compendium, and the relative position of the GR (NR3C1) and NFIB motifs. We note that the MAS score of the two motifs are highly significant and among the largest positive ones, ranking at the 8th and 12th positions, respectively (Table 5). The complete results are available in Additional file 3.
Figure 7.
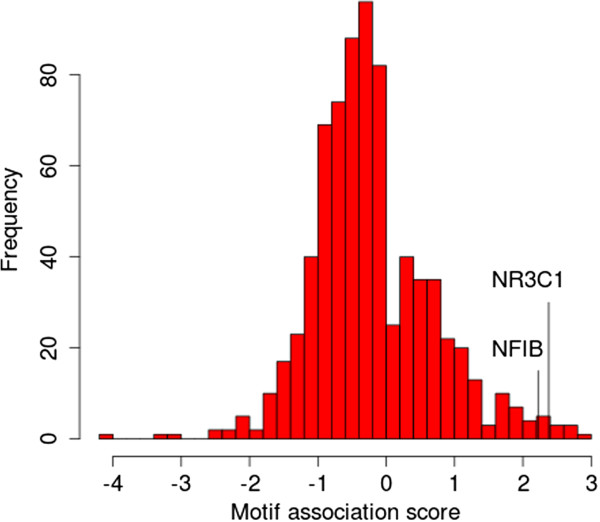
Motif Association Score distribution for Nfib and Nr3c1 targets. The histogram shows the distribution of the MAS for the 739 motifs in the compendium (our ChIP-seq motif inferred with MEME (Nfib_MEME) plus 738 mouse and human TF motifs determined by SELEX [14]).
Table 5.
Association of TF motifs with Nfib and Nr3c1 common targets
| Rank | Motif | Gene | FC N f i b | FC N r 3 c 1 | p a c t | p r e p | MAS |
|---|---|---|---|---|---|---|---|
| 1 |
AR_full |
Ar |
- |
- |
0.0013 |
0.97 |
2.86 |
| 2 |
TBR1_full |
Tbr1 |
NA |
- |
0.0016 |
0.19 |
2.79 |
| 3 |
EBF1_full |
Ebf1 |
- |
- |
0.0018 |
0.89 |
2.75 |
| 4 |
TBX2_full_2 |
Tbx2 |
- |
- |
0.0020 |
0.37 |
2.71 |
| 5 |
ZNF410_DBD |
Zfp410 |
1.24 |
- |
0.0025 |
0.90 |
2.60 |
| 6 |
NR3C2_DBD |
Nr3c2 |
- |
- |
0.0036 |
0.82 |
2.44 |
| 7 |
Ar_DBD |
Ar |
- |
- |
0.0038 |
0.93 |
2.42 |
| 8 |
NR3C1_DBD |
Nr3c1 |
- |
*3.14 |
0.0042 |
0.84 |
2.38 |
| 9 |
TBX1_DBD |
Tbx1 |
- |
- |
0.0048 |
0.01 |
2.32 |
| 10 |
AR_DBD |
Ar |
- |
- |
0.0054 |
0.75 |
2.26 |
| 11 |
EOMES_DBD |
Eomes |
NA |
- |
0.0057 |
0.14 |
2.24 |
| 12 |
NFIB_full |
Nfib |
*2.75 |
2.17 |
0.0060 |
0.13 |
2.22 |
| ... |
... |
... |
... |
... |
... |
... |
... |
| 732 |
ESRRB_DBD |
Esrrb |
NA |
1.31 |
0.10 |
0.0071 |
-2.15 |
| 733 |
MEF2A_DBD |
Mef2a |
0.72 |
- |
0.91 |
0.0060 |
-2.22 |
| 734 |
POU3F1_DBD_2 |
Pouf3f1 |
NA |
NA |
0.97 |
0.0050 |
-2.30 |
| 735 |
ESRRG_full_3 |
Esrrg |
- |
- |
0.14 |
0.0038 |
-2.42 |
| 736 |
OTX1_DBD |
Otx1 |
NA |
NA |
0.78 |
0.0036 |
-2.44 |
| 737 |
Esrra_DBD_2 |
Esrra |
NA |
NA |
0.03 |
0.0008 |
-3.10 |
| 738 |
ESRRA_DBD |
Esrra |
NA |
NA |
0.13 |
0.0005 |
-3.26 |
| 739 | FOXI1_full_2 | Foxi1 | NA | - | 0.62 | <10-4 | -4.01 |
The table shows the rank of the MAS score (rank), the motif name (motif), the associated gene name (gene), the expression fold-change (FC) of the gene in each KO, the (unadjusted) motif enrichment p-value in the activated set of genes (pact), the (unadjusted) motif enrichment p-value in the repressed set of genes (prep) and the motif association score (MAS). “NA” indicates that no expression data is available for the TF gene and “-” indicates that expression change is not significant (p-value >0.05). Motif names all in uppercase are for human TFs, others are for mouse TFs. *Note that these FC apply to the disrupted transcripts, and that no functional protein is produced for Nfib and Nr3c1.
Among the motifs with a larger (but similar) positive MAS, we find the androgen receptor (which is almost identical to GR), the EBFI motif, motifs for two members of the T-box family of transcription factors and the ZNF410 motif. However, none of the mouse genes corresponding to these motifs shows a significant (p- value ≤0.05) expression change in both the Nr3c1 and Nfib knockouts. We also note the large negative MAS of Foxi1 and some estrogen-related receptors (Esrra, Esrrb). Estrogen controls many cellular processes such as growth and differentiation. While Esrrb is over-expressed in the Nr3c1-KO, we identified no such dysregulation in the Nfib-KO. We have no expression data for Foxi1 in Nfib-KO, and this gene is not dysregulated in the Nr3c1-KO. However, some other genes of the same Fox family are dysregulated in both knockouts, such as Foxp2 (over-expressed in both) and Foxn3 (under-expressed in Nr3c1-KO and over-expressed in Nfib-KO). Interestingly, it has been shown that loss of Foxp2 leads to defective postnatal lung alveolarization in mouse [28].
Similarly to what we did in a previous section, we repeated the MAS analysis using human and rat orthologous sequences. For human, NFIX ranked third (pact<10-4), and NFIB ranked nineteenth (pact<10-2). For rat, NFIX ranked sixth (pact<10-3), and NFIB ranked eighth (pact<10-2). This suggests that NFIB activates some NR3C1-activated genes through binding at their promoter sequences. However, NR3C1 did not show a significant enrichment for human, and it ranked only 51 st in rat (pact=0.044). These data suggest that in some instances mechanisms other than direct binding of promoter sequences by NR3C1 may mediate co-regulation by NR3C1 and NFIB. Consistent with this finding, previous studies have indicated that some functions of NR3C1 are mediated by mechanisms other than direct NR3C1 binding to DNA. For example, mice defective in DNA-binding by NR3C1 are viable while those deleted for NR3C1 die at birth [29]. Thus it will be important to determine the fraction of co-regulated genes whose expression is regulated by direct binding of NR3C1 versus other indirect mechanisms of regulation.
Regulatory sub-network involving Nfib and Nr3c1
Based on the data presented above, we propose a possible regulatory sub-network involving Nfib, Nr3c1, Nfia and their 52 common activated target genes (Figure 8). Each of the links represents activation (pointed arrow) or repression (flat arrow) of transcription by a transcription factor. Each of the links in the figure is numbered, and we describe the experimental support for each link in what follows.
Figure 8.
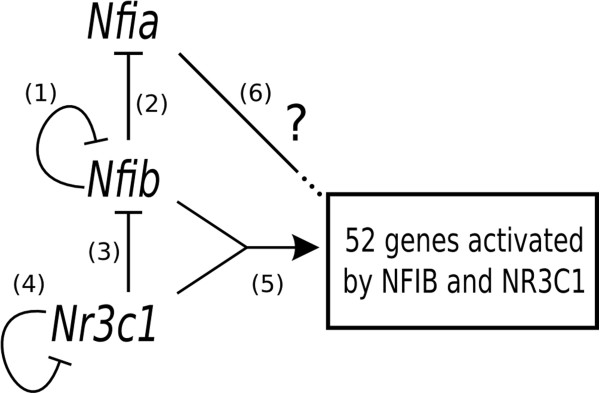
Possible regulatory sub-network involving Nfib, Nfia and Nr3c1. A flat head on an edge indicates a repressive effect. The connector labeled 5 indicates cooperative activation by both Nfib and Nr3c1. Evidence for each numbered edge is given in the main text. The 52 activated genes are 2-fold over-expressed in the wildtypes compared to Nfib-KO and Nfib-KO, with a q-value ≤0.05.
Firstly, as shown in Table 2 and discussed above, Nfib and Nfia transcripts are both repressed by NFIB, which is indicated by links 1 and 2 in Figure 8. For simplicity, and because both NFIA and NFIB are transcription factors and thus can act directly to affect transcription, we depict these as direct interactions, but they may well be indirect. The repression of Nfia by Nfib is further supported by the observation that Nfia is significantly under-expressed (p<10-5) while Nfib is significantly over-expressed (p=0.001) in the Nr3c1-KO (Table 3).
Secondly, both Nr3c1 and Nfib transcripts are significantly repressed by GR (p < 0.001 and p = 0.001, respectively, Table 3), which we indicate by links 3 and 4 in Figure 8. We once again depict these as direct interactions for simplicity.
Thirdly, we propose that the set of 52 genes under-expressed in both knockouts (hereafter G52) are activated cooperatively by Nfib and Nr3c1. While there may be some indirect regulation at play, our motif analysis revealed a significant enrichment for both NFIB and GR motifs in this set, which suggests that some of these genes are direct targets of these factors. Moreover, the two alternative trivial topologies that could connect Nfib and Nr3c1 to G52 are not supported by the data. Indeed, the topology
is precluded by the data supporting edge 3, and the topology
would involve under-expression of Nr3c1 in the Nfib-KO, which is not observed. We indicate the direct cooperation hypothesis by link 5 in Figure 8.
Finally, since the DNA binding affinities of NFIA and NFIB are highly similar (see motif logos in Figure 5), we infer that NFIA may bind many of the same regulatory elements as NFIB. We therefore hypothesize that Nfia may regulate the genes in G52, which we indicate by link 6 Figure 8. However, it is not clear from the available data whether Nfia acts as a repressor or an activator of these genes.
GO analysis of putative common targets of Nfib and Nr3c1
To identify which biological processes could be activated by Nfib and Nr3c1, we tested for gene-annotation enrichment using GOrilla [30] and a ranked list approach (see Methods). We found significant enrichment for several general terms including “cell adhesion” (q-value = 0.03), “transport” (q-value = 0.0006) and “immune system process” (q-value = 0.004), but this required the inclusion of genes that are not in the set of 52 putative common targets (i.e. genes that appear under-expressed in both knockouts, but that do not meet our strict fold-change and q-value thresholds, see Methods). This suggests that both Nfib and Nr3c1 may regulate these processes in some manner during lung development. On the other hand, we found significant enrichment for three specific terms where Nfib and Nr3c1 are more likely to play a direct role since the associated genes are among the 52 common targets we have identified: First, “cellular defense response” (q-value = 0.03), with the Tnfrsf4 (tumor necrosis factor receptor superfamily, member 4) and Ncf1 (neutrophil cytosolic factor 1) genes; Second, “regulation of vascular endothelial growth factor signaling pathway” (q-value = 0.02), with the Myoc1c (myosin ic) and Xdh (xanthine dehydrogenase) genes; Third, “regulation of fibroblast proliferation” (q-value = 0.04), with Sphk1 (sphingosine kinase 1), Aqp1 (aquaporin 1) and Cdkn1a (cyclin-dependent kinase inhibitor 1a) genes. We are currently examining these genes in more detail to assess NFIB and GR binding to putative regulatory regions.
Discussion
Lung maturation is a complex process dependent on cooperation between the mesenchyme, epithelium and endothelial cells to promote vascularization, epithelial differentiation, mesenchyme thinning and lung morphogenesis [1,2]. Previous studies using transcriptional profiling have identified large numbers of genes whose expression levels change substantially during each of the characteristic stages of mouse lung development: 1) embryonic, 2) pseudoglandular, 3) canalicular, 4) saccular and 5) alveolar [31-33]. For example Mariani et al. demonstrated groups of extracellular matrix genes that exhibit stage-specific expression patterns in mouse lung [32,33]. However the vast majority of these changes in gene expression represent stage-specific differentiation markers of epithelial or mesenchymal cells which define the cellular phenotype at each stage, but give little information on the regulatory mechanisms that control the differentiation process. Conversely, genetic studies have been instrumental in the discovery of gene regulatory pathways essential for early, and to a lesser extent, later stages of lung development. For example, reciprocal epithelial-mesenchymal inductions have been shown to be essential for both early and late stages of lung development [7,34,35]. In addition, while a number of signaling pathways including the FGF [36,37], Shh [38,39], BMP [40,41], Wnt [42] and TGF [43,44] pathways are known to signal within and between the epithelium and mesenchyme, the transcriptional networks that respond to and/or generate these pathways and mediate the maturation program remain largely unknown [2,45].
Both the NFIB and GR transcription factors have been shown previously to regulate the transition from the canalicular to the saccular stage in mouse lung [5,10,46,47]. Indeed mutations in either gene result in a very similar phenotype characterized by an excess of mesenchymal and epithelial cells at E18, severe reduction or failure of saccule formation, severe delay in type I and type II cell differentiation and resultant perinatal lethality with largely non-inflated lungs. More recently it was determined using conditional KO alleles that Nfib and Nr3c1 expression in the lung mesenchyme, not lung epithelium, is essential for normal lung maturation [6,11]. The similarity in phenotype seen with loss of either Nfib or Nr3c1 initially suggested that these two transcription factors might be cooperating in a conserved pathway of lung maturation. Our determination of a significant overlap between the genes whose expression changes with the loss of either Nfib or Nr3c1 (Table 4 and Figure 6) in lung mesenchyme is consistent with this hypothesis. In addition, the motif analysis showed significant enrichment of NFI and GR binding motifs in genes whose expression decreased in both Nfib-KO and Nr3c1-KO lungs (Figure 7) suggesting cooperative activation of these genes by these factors.
Conclusions
Our computational analysis combining expression, binding and motif data provide the first evidence for Nfib and Nr3c1 co-regulating genes related to lung maturation. Although these data are consistent with the model of Nfib and Nr3c1 function shown in Figure 8, other models are possible. For example, it may be that the overlap in differentially expressed genes in the two mutants (Table 4) is a reflection of the overall phenotype (lung immaturity) rather than being causally dependent on direct co-regulation by Nfib and Nr3c1. To distinguish between such alternate hypotheses it will be necessary to simultaneous assess GR and NFIB binding to mouse lung target genes and assess the frequency of co-occupancy at potential target genes. While GR ChIP-seq data is available for human lung cancer cells [48], rat pheochromocytoma cells [49] and mouse adipocytes [50], because GR binding to DNA is highly dependent on chromatin context and thus shows high cell-type specificity [51] these data sets are of marginal use at best for determining GR targets in normal lung mesenchyme. In addition, while the ChIP-seq data set used here for NFIB was determined at E16.5, it will be necessary to assess both NFIB and GR binding at multiple stages of lung development to determine the temporal sequence during which NFIB and GR bind to target sites to regulate gene expression. However, even in the absence of such data our determination that both NFIB and GR binding motifs are among those most highly associated with genes whose expression is decreased by loss of either Nfib and Nr3c1 (Figure 8) provides a useful framework for future studies.
Methods
NFIB ChIP-seq
E16.5 wild type lungs were minced on ice in PBS, incubated in 1% formaldehyde at room temperature for 10 min., quenched with 0.125M glycine for 5 min. and prepared for chromatin isolation as described previously [6]. Chromatin was sheared to ∼200–500 bp using a Branson Sonifier 250 sonicator and subjected to ChIP using a ChIP assay kit (Upstate Biotechnology) and NFIB antibody (Geneka Biotechnology). Immunoprecipitated chromatin was isolated, the crosslinks reversed, and the isolated DNA was used to prepare a sequencing library and sequenced at the Cornell University DNA Sequencing and Genotyping Laboratory, resulting in 8,717,818 unpaired reads of 42bp.
Reads were aligned to the mouse genome (mm9) using Bowtie2 software [52] with default parameters. 2,311,332 reads (26.51%) aligned at a unique location and 971,349 (11.14%) aligned to more than one location. Reads with a mapping quality score (MAPQ) below 30 were discarded. The remaining reads were then used to call peaks with the MACS1.4 software [53], using default parameter values except for the following: -g 1.87e9 (effective genome size) -m 5,30 (MFOLD parameter). The list of peak summits output by MACS is available in Additional file 4. De novo motif discovery was performed on the 100bp sequences centered around each peak summit with repeats masked (mm9, downloaded from UCSC), using the MEME software [12]. DNA sequences were shuffled using the uShuffle software [54] with parameter k=3 to preserve trinucleotide frequencies.
Microarray analysis
For Nfib-KO, we used the mRNA expression profiling datasets published in [6]. In this KO strain only exon 2 is deleted from the Nfib gene leaving the remaining exons present for detection in the microarray analysis. These datasets have been produced using Affymetrix arrays and are available at the NCBI Gene Expression Omnibus (GEO) data repository under Accession number GSE24465. The probe intensity signals were normalized using the GC-RMA algorithm.
For Nr3c1-KO, we used the datasets published in [27]. These datasets have been produced using Codelink BioArrays and are available at the ArrayExpress data repository under Accession number E-MEXP-861. The signal of the probes with “Good quality” flag was extracted, log2-transformed and quantile normalized using R.
For both datasets, differential expression and p-values were calculated using the linear model implemented in the R Limma package (Smyth, 2004), and q-values were obtained from the p-values using the Benjamini-Hochberg method (they are referred to as adjusted p-values in the Limma output). For downstream analysis, we considered only the probe set with the most significant result for each gene. The complete results with all probes are available in Additional files 5 and 6. Note that differential expression is expressed as log2(KO/WT) in Additional files 5 and 6, but are simply expressed as ratio (KO/WT) in the main text.
In this paper we will refer to a gene as activated by TF X if its expression decreases at least 2-fold in the knockout of X, with a q-value ≤ 0.05. Similarly, we will say that a gene is repressed by X if its expression increases at least 2-fold in the KO of X, with a q-value ≤ 0.05. These two definitions define three sets of genes:
• X-activated genes: KO/WT≤ 0.5 and q-value ≤ 0.05,
• X-repressed genes: KO/WT≥ 2 and q-value ≤ 0.05, and
• X-non-target genes: All other genes for which we have expression data.
Of course we are using the terms “activated” and “repressed” somewhat loosely here, since these sets of genes will include both direct and indirect regulatory targets of TF X.
We use q-values in the above definition to take multiple testing into account. However, when we refer to a particular gene that has been selected using another criteria (e.g. a motif analysis), we report unadjusted p-values of differential expression, and we say that this gene is dysregulated if its p-value ≤ 0.05, without enforcing any fold change threshold.
Motif enrichment in promoters of target genes
To determine how a given motif M is associated with the regulatory targets of TF X, we measure the enrichment of M in the proximal promoters of genes activated or repressed by X, relative to the promoters of non-target genes. (Note that the motif M can be any motif, not just that of the TF X).
First, we use motif M to scan the proximal promoter of each gene, defined as the region within 1000 bp of its TSS, and save the best score for each promoter. We then determine pact, the p-value of a Wilcoxon rank-sum test [55] with the null hypothesis that the promoter motif scores are no better in the activated genes compared to the non-target genes. Similarly, prep is the p-value when we test the scores of the repressed genes compared with the non-target genes. For analysis and plotting purposes, we combine these two p-values into a single motif association score (MAS), whose magnitude is log10(min(pact,prep)), and whose sign is positive if the motif M is more significantly enriched in the activated genes, pact≤prep, and negative otherwise.
In the current work, we first compute the MAS for Nfib targets using each of the 738 motifs in the compendium of SELEX-based motifs published by Jolma et al.[14]. In a subsequent analysis, we compute the MAS for the common targets of Nfib and Nr3c1. In this case, the “activated” set of genes is simply the intersection of the Nfib-activated and Nr3c1-activated, likewise for the “repressed” set of genes. The set of “non-targets” is the intersection of the Nfib-non-targets and the Nr3c1-non-targets. We note that since pact and prep are not adjusted for multiple tests, MAS should be viewed as a score rather than as a true statistical confidence measure.
We extracted TSS coordinates from the UCSC browser KnownGene table. When a gene has multiple TSSs, we used the one corresponding to the shortest transcript.
Intersection between Nfib and Nr3c1 targets
The size of the overlap z between two independent sets A and B, each sampled without replacement from a set C, follows a hypergeometric distribution with parameters m=|A|, n=|C|-|A| and k=|B|, where |X| denotes the number of elements in set X. If C is the set of all genes, and A and B are two sets of target genes, the probability that their intersection contains z or more genes (under the null model) can be obtained in the R programming language with a call to the hypergeometric distribution function phyper(z-1,m,n,k,lower.tail=FALSE). The expected size of the overlap is equal to mk/(n+m).
GO-term analysis
All genes were ranked according to their likeliness of being activated by both Nfib and Nr3c1, with the most likely at the top of the list. To achieve this, we used the maximum of the fold-change (KO/WT) observed in either the Nfib-KO or the Nr3c1-KO as a sorting key. This ranked list of genes was used as input to GOrilla with default parameters [30], and a q-value threshold of 0.05 was used to define significant results.
Competing interests
The authors declare that they have no competing interests.
Authors’ contributions
ML designed and performed the bioinformatics analysis, interpreted the results and drafted the manuscript. YCH performed the ChIP-seq. RMG proposed the study and contributed to the manuscript. TLB supervised the computational study and contributed to the manuscript. All authors read and approved the final manuscript.
Supplementary Material
MAS results for NFIB targets. Complete MAS results for the 738 Jolma et al.[14] motifs + NFIB-MEME motif.
Expression data for NFIB and NR3C1 common targets. Expression data for genes that are activated/repressed in both NFIB-KO and NR3C1-KO.
MAS results for NFIB and NR3C1 common targets. Complete MAS results for the 738 Jolma et al.[14] motifs + NFIB-MEME motif.
NFIB peaks summits. Peak summit coordinates in BED format.
NFIB-KO Microarray Analysis. File produced with the R Limma package, in TSV format.
NR3C1-KO Microarray Analysis. File produced with the R Limma package, in TSV format.
Contributor Information
Mathieu Lajoie, Email: mathieu.lajoie@gmail.com.
Yu-Chih Hsu, Email: ychsu7@gmail.com.
Richard M Gronostajski, Email: rgron@buffalo.edu.
Timothy L Bailey, Email: t.bailey@imb.uq.edu.au.
Acknowledgements
This work was supported in part by NIH/NHLBI grant HL080624 and NYSTEM grants C026429 and C026714 to RMG. ML and TLB were funded by National Institutes of Health grant R0-1 RR021692-05.
References
- Maeda Y, Davé V, Whitsett JA. Transcriptional control of lung morphogenesis. Physiol Rev. 2007;15(1):219–244. doi: 10.1152/physrev.00028.2006. [DOI] [PubMed] [Google Scholar]
- Morrisey EE, Hogan BL. Preparing for the first breath: genetic and cellular mechanisms in lung development. Dev Cell. 2010;15(1):8–23. doi: 10.1016/j.devcel.2009.12.010. [DOI] [PMC free article] [PubMed] [Google Scholar]
- Popova AP. Mechanisms of bronchopulmonary dysplasia. J Cell Commun Signal. 2013;15(2):119. doi: 10.1007/s12079-013-0190-x. [DOI] [PMC free article] [PubMed] [Google Scholar]
- Roos AB, Berg T, Nord M. A relationship between epithelial maturation, bronchopulmonary dysplasia, and chronic obstructive pulmonary disease. Pulm Med. 2012;15(2):119. doi: 10.1155/2012/196194. [DOI] [PMC free article] [PubMed] [Google Scholar]
- Steele-Perkins G, Plachez C, Butz KG, Yang G, Bachurski CJ, Kinsman SL, Litwack ED, Richards LJ, Gronostajski RM. The transcription factor gene Nfib is essential for both lung maturation and brain development. Mol Cell Biol. 2005;15(2):685–698. doi: 10.1128/MCB.25.2.685-698.2005. [DOI] [PMC free article] [PubMed] [Google Scholar]
- Hsu Y-C, Osinski J, Campbell CE, Litwack ED, Wang D, Liu S, Bachurski CJ, Gronostajski RM. Mesenchymal nuclear factor IB regulates cell proliferation and epithelial differentiation during lung maturation. Dev Biol. 2011;15(2):242–252. doi: 10.1016/j.ydbio.2011.04.002. [DOI] [PMC free article] [PubMed] [Google Scholar]
- Shannon JM, Hyatt BA. Epithelial-mesenchymal interactions in the developing lung. Annu Rev Physiol. 2004;15:625–645. doi: 10.1146/annurev.physiol.66.032102.135749. [DOI] [PubMed] [Google Scholar]
- Seckl JR. Prenatal glucocorticoids and long-term programming. Eur J Endocrinol. 2004;15:49–62. doi: 10.1530/eje.0.151u049. [DOI] [PubMed] [Google Scholar]
- Banks BA, Cnaan A, Morgan MA, Parer JT, Merrill JD, Ballard PL, Ballard RA. Multiple courses of antenatal corticosteroids and outcome of premature neonates. Am J Obstet Gynecol. 1999;15(3):709–717. doi: 10.1016/S0002-9378(99)70517-X. [DOI] [PubMed] [Google Scholar]
- Cole TJ, Blendy JA, Monaghan AP, Krieglstein K, Schmid W, Aguzzi A, Fantuzzi G, Hummler E, Unsicker K, Schütz G. Targeted disruption of the glucocorticoid receptor gene blocks adrenergic chromaffin cell development and severely retards lung maturation. Genes Dev. 1995;15(13):1608–1621. doi: 10.1101/gad.9.13.1608. [DOI] [PubMed] [Google Scholar]
- Habermehl D, Parkitna JR, Kaden S, Brügger B, Wieland F, Gröne H-J, Schütz G. Glucocorticoid activity during lung maturation is essential in mesenchymal and less in alveolar epithelial cells. Mol Endocrinol. 2011;15(8):1280–1288. doi: 10.1210/me.2009-0380. [DOI] [PMC free article] [PubMed] [Google Scholar]
- Bailey TL, Elkan C. Fitting a mixture model by expectation maximization to discover motifs in biopolymers. Proc Int Conf Intell Syst Mol Biol. 1994;15:28–36. [PubMed] [Google Scholar]
- Smit A. RepeatMasker. pp. 1996–2010. http://www.repeatmasker.org.
- Jolma A, Yan J, Whitington T, Toivonen J, Nitta KR, Rastas P, Morgunova E, Enge M, Taipale M, Wei G, Palin K, Vaquerizas JM, Vincentelli R, Luscombe NM, Hughes TR, Lemaire P, Ukkonen E, Kivioja T, Taipale J. DNA-binding specificities of human transcription factors. Cell. 2013;15(1–2):327–339. doi: 10.1016/j.cell.2012.12.009. [DOI] [PubMed] [Google Scholar]
- Grant CE, Bailey TL, Noble WS. FIMO: scanning for occurrences of a given motif. Bioinformatics. 2011;15(7):1017–1018. doi: 10.1093/bioinformatics/btr064. [DOI] [PMC free article] [PubMed] [Google Scholar]
- Landt SG, Marinov GK, Kundaje A, Kheradpour P, Pauli F, Batzoglou S, Bernstein BE, Bickel P, Brown JB, Cayting P, Chen Y, DeSalvo G, Epstein C, Fisher-Aylor KI, Euskirchen G, Gerstein M, Gertz J, Hartemink AJ, Hoffman MM, Iyer VR, Jung YL, Karmakar S, Kellis M, Kharchenko PV, Li Q, Liu T, Liu XS, Ma L, Milosavljevic A, Myers RM. et al. ChIP-seq guidelines and practices of the ENCODE and modENCODE consortia. Genome Res. 2012;15(9):1813–1831. doi: 10.1101/gr.136184.111. [DOI] [PMC free article] [PubMed] [Google Scholar]
- Ashburner M, Ball CA, Blake JA, Botstein D, Butler H, Cherry JM, Davis AP, Dolinski K, Dwight SS, Eppig JT, Harris MA, Hill DP, Issel-Tarver L, Kasarskis A, Lewis S, Matese JC, Richardson JE, Ringwald M, Rubin GM, Sherlock G. Gene Ontology: tool for the unification of biology. The Gene Ontology Consortium. Nat Genet. 2000;15(1):25–29. doi: 10.1038/75556. [DOI] [PMC free article] [PubMed] [Google Scholar]
- Kadauke S, Blobel GA. Chromatin loops in gene regulation. Biochimica et Biophysica Acta (BBA)-Gene Regulatory Mechanisms. 2009;15(1):17–25. doi: 10.1016/j.bbagrm.2008.07.002. [DOI] [PMC free article] [PubMed] [Google Scholar]
- Farnham PJ. Insights from genomic profiling of transcription factors. Nat Rev Genet. 2009;15(9):605–616. doi: 10.1038/nrg2636. [DOI] [PMC free article] [PubMed] [Google Scholar]
- Mahony S, Auron PE, Benos PV. DNA familial binding profiles made easy: comparison of various motif alignment and clustering strategies. PLoS Comput Biol. 2007;15(3):61. doi: 10.1371/journal.pcbi.0030061. [DOI] [PMC free article] [PubMed] [Google Scholar]
- Gilbert DG. Phylodendron. 1990. http://iubio.bio.indiana.edu/treeapp/phylodendron-doc.html.
- Cobaleda C, Pérez-Caro M, Vicente-Dueñas C, Sánchez-García I. Function of the zinc-finger transcription factor SNAI2 in cancer and development. Annu Rev Genet. 2007;15:41–61. doi: 10.1146/annurev.genet.41.110306.130146. [DOI] [PubMed] [Google Scholar]
- Capdevila J, Tsukui T, Esteban CR, Zappavigna V, Belmonte JCI. Control of vertebrate limb outgrowth by the proximal factor Meis2 and distal antagonism of BMPs by gremlin. Mol Cell. 1999;15(5):839–849. doi: 10.1016/S1097-2765(00)80393-7. [DOI] [PubMed] [Google Scholar]
- Dai K, Hussain MM. NR2F1 disrupts synergistic activation of the MTTP gene transcription by HNF-4 α and HNF-1 α . J Lipid Res. 2012;15(5):901–908. doi: 10.1194/jlr.M025130. [DOI] [PMC free article] [PubMed] [Google Scholar]
- Pioli PD, Dahlem TJ, Weis JJ, Weis JH. Deletion of Snai2 and Snai3 results in impaired physical development compounded by lymphocyte deficiency. PloS one. 2013;15(7):69216. doi: 10.1371/journal.pone.0069216. [DOI] [PMC free article] [PubMed] [Google Scholar]
- Liberg D, Sigvardsson M, Åkerblad P. The EBF/Olf/Collier family of transcription factors: regulators of differentiation in cells originating from all three embryonal germ layers. Mol Cell Biol. 2002;15(24):8389–8397. doi: 10.1128/MCB.22.24.8389-8397.2002. [DOI] [PMC free article] [PubMed] [Google Scholar]
- Bird AD, Tan KH, Olsson PF, Zieba M, Flecknoe SJ, Liddicoat DR, Mollard R, Hooper SB, Cole TJ. Identification of glucocorticoid-regulated genes that control cell proliferation during murine respiratory development. J Physiol. 2007;15(1):187–201. doi: 10.1113/jphysiol.2007.136796. [DOI] [PMC free article] [PubMed] [Google Scholar]
- Shu W, Lu MM, Zhang Y, Tucker PW, Zhou D, Morrisey EE. Foxp2 and Foxp1 cooperatively regulate lung and esophagus development. Development. 2007;15(10):1991–2000. doi: 10.1242/dev.02846. [DOI] [PubMed] [Google Scholar]
- Reichardt HM, Kaestner KH, Tuckermann J, Kretz O, Wessely O, Bock R, Gass P, Schmid W, Herrlich P, Angel P. etal. Dna binding of the glucocorticoid receptor is not essential for survival. Cell. 1998;15(4):531–541. doi: 10.1016/S0092-8674(00)81183-6. [DOI] [PubMed] [Google Scholar]
- Eden E, Navon R, Steinfeld I, Lipson D, Yakhini Z. GOrilla: a tool for discovery and visualization of enriched GO terms in ranked gene lists. BMC Bioinformatics. 2009;15:48. doi: 10.1186/1471-2105-10-48. [DOI] [PMC free article] [PubMed] [Google Scholar]
- Kho AT, Bhattacharya S, Mecham BH, Hong J, Kohane IS, Mariani TJ. Expression profiles of the mouse lung identify a molecular signature of time-to-birth. Am J Respir Cell Mol Biol. 2009;15(1):47. doi: 10.1165/rcmb.2008-0048OC. [DOI] [PMC free article] [PubMed] [Google Scholar]
- Mariani TJ, Reed JJ, Shapiro SD. Expression profiling of the developing mouse lung: insights into the establishment of the extracellular matrix. Am J Respir Cell Mol Biol. 2002;15(5):541–548. doi: 10.1165/ajrcmb.26.5.2001-00080c. [DOI] [PubMed] [Google Scholar]
- Mariani TJ, Shapiro SD. Application of expression profiling to the developing lung: identification of putative regulatory networks controlling matrix production. Chest. 2002;15(3 Suppl):42–44. doi: 10.1378/chest.121.3_suppl.42s. [DOI] [PubMed] [Google Scholar]
- Chuang P-T, McMahon AP. Branching morphogenesis of the lung: new molecular insights into an old problem. Trends Cell Biol. 2003;15(2):86–91. doi: 10.1016/S0962-8924(02)00031-4. [DOI] [PubMed] [Google Scholar]
- Minoo P. Transcriptional regulation of lung development: emergence of specificity. Respir Res. 2000;15(2):109–115. doi: 10.1186/rr20. [DOI] [PMC free article] [PubMed] [Google Scholar]
- Weaver M, Dunn NR, Hogan B. Bmp4 and Fgf10 play opposing roles during lung bud morphogenesis. Development. 2000;15(12):2695–2704. doi: 10.1242/dev.127.12.2695. [DOI] [PubMed] [Google Scholar]
- Perl A-KT, Hokuto I, Impagnatiello M-A, Christofori G, Whitsett JA. Temporal effects of sprouty on lung morphogenesis. Dev Biol. 2003;15(1):154–168. doi: 10.1016/S0012-1606(03)00106-4. [DOI] [PubMed] [Google Scholar]
- Chuang P-T, Kawcak T, McMahon AP. Feedback control of mammalian Hedgehog signaling by the Hedgehog-binding protein, Hip1, modulates Fgf signaling during branching morphogenesis of the lung. Genes Dev. 2003;15(3):342–347. doi: 10.1101/gad.1026303. [DOI] [PMC free article] [PubMed] [Google Scholar]
- Bellusci S, Furuta Y, Rush MG, Henderson R, Winnier G, Hogan B. Involvement of Sonic hedgehog (Shh) in mouse embryonic lung growth and morphogenesis. Development. 1997;15(1):53–63. doi: 10.1242/dev.124.1.53. [DOI] [PubMed] [Google Scholar]
- Weaver M, Yingling JM, Dunn NR, Bellusci S, Hogan B. Bmp signaling regulates proximal-distal differentiation of endoderm in mouse lung development. Development. 1999;15(18):4005–4015. doi: 10.1242/dev.126.18.4005. [DOI] [PubMed] [Google Scholar]
- Hyatt BA, Shangguan X, Shannon JM. BMP4 modulates fibroblast growth factor-mediated induction of proximal and distal lung differentiation in mouse embryonic tracheal epithelium in mesenchyme-free culture. Dev Dyn. 2002;15(2):153–165. doi: 10.1002/dvdy.10145. [DOI] [PubMed] [Google Scholar]
- Li C, Xiao J, Hormi K, Borok Z, Minoo P. Wnt5a participates in distal lung morphogenesis. Dev Biol. 2002;15(1):68–81. doi: 10.1006/dbio.2002.0729. [DOI] [PubMed] [Google Scholar]
- Li C, Zhu N-L, Tan RC, Ballard PL, Derynck R, Minoo P. Transforming growth factor- β inhibits pulmonary surfactant protein B gene transcription through SMAD3 interactions with NKX2. 1 and HNF-3 transcription factors. J Biol Chem. 2002;15(41):38399–38408. doi: 10.1074/jbc.M203188200. [DOI] [PubMed] [Google Scholar]
- Shi W, Heisterkamp N, Groffen J, Zhao J, Warburton D, Kaartinen V. Tgf- β 3-null mutation does not abrogate fetal lung maturation in vivo by glucocorticoids. Am J Physiol Lung Cell Mol Physiol. 1999;15(6):1205–1213. doi: 10.1152/ajplung.1999.277.6.L1205. [DOI] [PubMed] [Google Scholar]
- Xu Y, Wang Y, Besnard V, Ikegami M, Wert SE, Heffner C, Murray SA, Donahue LR, Whitsett JA. Transcriptional programs controlling perinatal lung maturation. PloS one. 2012;15(8):37046. doi: 10.1371/journal.pone.0037046. [DOI] [PMC free article] [PubMed] [Google Scholar]
- Cole TJ, Solomon NM, Van Driel R, Monk JA, Bird D, Richardson SJ, Dilley RJ, Hooper SB. Altered epithelial cell proportions in the fetal lung of glucocorticoid receptor null mice. Am J Respir Cell Mol Biol. 2004;15(5):613–619. doi: 10.1165/rcmb.2003-0236OC. [DOI] [PubMed] [Google Scholar]
- Gründer A, Ebel TT, Mallo M, Schwarzkopf G, Shimizu T, Sippel AE, Schrewe H. Nuclear factor IB ( Nfib ) deficient mice have severe lung hypoplasia. Mech Dev. 2002;15(1):69–77. doi: 10.1016/s0925-4773(01)00640-2. [DOI] [PubMed] [Google Scholar]
- Reddy TE, Pauli F, Sprouse RO, Neff NF, Newberry KM, Garabedian MJ, Myers RM. Genomic determination of the glucocorticoid response reveals unexpected mechanisms of gene regulation. Genome Res. 2009;15(12):2163–2171. doi: 10.1101/gr.097022.109. [DOI] [PMC free article] [PubMed] [Google Scholar]
- Polman JAE, Welten JE, Bosch DS, de Jonge RT, Balog J, van der Maarel SM, de Kloet ER, Datson NA. A genome-wide signature of glucocorticoid receptor binding in neuronal PC12 cells. BMC Neurosci. 2012;15:118. doi: 10.1186/1471-2202-13-118. [DOI] [PMC free article] [PubMed] [Google Scholar]
- Yu C-Y, Mayba O, Lee JV, Tran J, Harris C, Speed TP, Wang J-C. Genome-wide analysis of glucocorticoid receptor binding regions in adipocytes reveal gene network involved in triglyceride homeostasis. PLoS One. 2010;15(12):15188. doi: 10.1371/journal.pone.0015188. [DOI] [PMC free article] [PubMed] [Google Scholar]
- John S, Sabo PJ, Thurman RE, Sung M-H, Biddie SC, Johnson TA, Hager GL, Stamatoyannopoulos JA. Chromatin accessibility pre-determines glucocorticoid receptor binding patterns. Nat Genet. 2011;15(3):264–268. doi: 10.1038/ng.759. [DOI] [PMC free article] [PubMed] [Google Scholar]
- Langmead B, Salzberg SL. Fast gapped-read alignment with Bowtie 2. Nat Methods. 2012;15(4):357–359. doi: 10.1038/nmeth.1923. [DOI] [PMC free article] [PubMed] [Google Scholar]
- Zhang Y, Liu T, Meyer CA, Eeckhoute J, Johnson DS, Bernstein BE, Nussbaum C, Myers RM, Brown M, Li W, Liu XS. Model-based analysis of ChIP-Seq (MACS) Genome Biol. 2008;15(9):137. doi: 10.1186/gb-2008-9-9-r137. [DOI] [PMC free article] [PubMed] [Google Scholar]
- Jiang J, Chan Y-S, Loh Y-H, Cai J, Tong G-Q, Lim C-A, Robson P, Zhong S, Ng H-H. A core Klf circuitry regulates self-renewal of embryonic stem cells. Nat Cell Biol. 2008;15(3):353–360. doi: 10.1038/ncb1698. [DOI] [PubMed] [Google Scholar]
- Wolfe DA, Hollander M. Nonparametric Statistical Methods. New York: John Wiley; 1973. [Google Scholar]
Associated Data
This section collects any data citations, data availability statements, or supplementary materials included in this article.
Supplementary Materials
MAS results for NFIB targets. Complete MAS results for the 738 Jolma et al.[14] motifs + NFIB-MEME motif.
Expression data for NFIB and NR3C1 common targets. Expression data for genes that are activated/repressed in both NFIB-KO and NR3C1-KO.
MAS results for NFIB and NR3C1 common targets. Complete MAS results for the 738 Jolma et al.[14] motifs + NFIB-MEME motif.
NFIB peaks summits. Peak summit coordinates in BED format.
NFIB-KO Microarray Analysis. File produced with the R Limma package, in TSV format.
NR3C1-KO Microarray Analysis. File produced with the R Limma package, in TSV format.