

Abstract
This article investigates longitudinal imaging characteristics of early cognitive decline during normal aging, leveraging on high-dimensional imaging pattern classification methods for the development of early biomarkers of cognitive decline. By combining magnetic resonance imaging (MRI) and resting positron emission tomography (PET) cerebral blood flow (CBF) images, an individualized score is generated using high-dimensional pattern classification, which predicts subsequent cognitive decline in cognitively normal older adults of the Baltimore Longitudinal Study of Aging. The resulting score, termed SPARE-CD (Spatial Pattern of Abnormality for Recognition of Early Cognitive Decline), analyzed longitudinally for 143 cognitively normal subjects over 8 years, shows functional and structural changes well before (2.3–2.9 years) changes in neurocognitive testing (California Verbal Learning Test [CVLT] scores) can be measured. Additionally, this score is found to be correlated to the [11C] Pittsburgh compound B (PiB) PET mean distribution volume ratio at a later time. This work indicates that MRI and PET images, combined with advanced pattern recognition methods, may be useful for very early detection of cognitive decline.
Keywords: Cognitive impairment, Magnetic resonance imaging, Positron emission tomography, Support vector machines, Classification
1. Introduction
An estimated 22–45% of older people in locations worldwide have cognitive impairment without dementia (Hanninen et al., 1996; Plassman et al., 2008; Scafato et al., 2010). Although any degree of cognitive impairment can negatively impact quality of life (Missotten et al., 2008, 2009), increasing impairment often signifies the progression of life-altering illnesses such as Alzheimer’s disease (AD). Biomarkers of early brain changes associated with AD are assuming increasing importance in newly revised criteria for research and clinical diagnoses (Albert et al., 2011; McKhann et al., 2011; Sperling et al., 2011). Because many intervention strategies, such as cognitive training (Mowszowski et al., 2010), physical exercise (Baker et al., 2010; Yaffe et al., 2001), and nutritional modifications (Naismith et al., 2009), may be more useful at earlier stages, it is important to detect cognitive decline early.
Given that it is generally believed that cognitive changes occur after structural and functional brain changes (Jack et al., 2009, 2010; Petersen and Jack, 2009), detecting changes in structural magnetic resonance imaging (MRI) and functional positron emission tomography (PET) cerebral blood flow (CBF) measures may be useful for early detection. However, the spatiotemporal characteristics of brain change in elderly individuals are widespread, complex, difficult to quantify, and difficult to detect on an individual basis with sufficient sensitivity and specificity. High-dimensional pattern analysis and classification methods may be useful for early identification of brain changes on an individual level, as they have been shown to capture these complex characteristics and produce quantitative metrics (Davatzikos et al., 2008, 2009; Duchesne et al., 2008; Kloppel et al., 2008; Koutsouleris et al., 2009; Misra et al., 2009; Vemuri et al., 2008).
In this article, we aim to determine whether structural and functional patterns are detectable and quantifiable before cognitive decline in apparently healthy individuals by using a high-dimensional pattern analysis technique along with longitudinal analysis. We focus on cognitive decline measured using immediate free recall score from the California Verbal Learning Test (CVLT) (Delis et al., 1987), as change in immediate verbal recall is among the earliest cognitive changes detected during the preclinical phase of Alzheimer’s disease (Grober et al., 2008). We further describe later in the text our choice of high-dimensional pattern analysis, along with a predominant model of cognitive decline.
1.1. Quantitative characterization of images
Recent studies have shown the potential of high-dimensional pattern analysis and classification methods as a means to quantify and summarize imaging patterns (Davatzikos et al., 2008, 2009; Kloppel et al., 2008; Koutsouleris et al., 2009; Misra et al., 2009; Vemuri et al., 2008). These methods also provide diagnostic and prognostic indicators for individuals, rather than groups, which is essential for clinical application. Pattern analysis and classification techniques use data labeled into classes, typically the presence and absence of a disease or condition, to derive a score representing the similarity of a given image to the image pattern representative of that condition. Such work has been useful for distinguishing, for example, normal subjects from those with AD (Davatzikos et al., 2009). However, characterizing patterns emerging at much earlier stages of cognitive decline before clinical impairment are ultimately going to be more important, as intervention at these stages before irreversible damage is likely to be more effective. To fill this need, we studied aging individuals with cognitive decline compared with those without cognitive decline from the Baltimore Longitudinal Study of Aging (BLSA). The BLSA provides imaging and cognitive data from older adults over long follow-up periods, allowing quantitative characterization of structural and functional data relative to cognitive decline.
1.2. Modeling cognitive decline
A predominant hypothesis (Jack et al., 2009, 2010; Petersen and Jack, 2009) is that the progression of memory decline in AD occurs in the brain in the following order: 1) beta-amyloid protein deposits build up in the brain, causing plaques to develop, which may be an initial step in the chain of events leading to neuronal dysfunction and ultimately loss; 2) brain function decreases; 3) atrophy occurs, changing the structural properties of the brain; 4) cognitive ability declines, leading to declines in memory and executive function; 5) ultimately this leads to cognitive impairment across a range of cognitive domains. This progression is schematically shown in Fig. 1 (resembling a similar figure in [Jack et al., 2010]). In this study, we investigate further the temporal relationship of structural, functional, and cognitive decline.
Fig. 1.
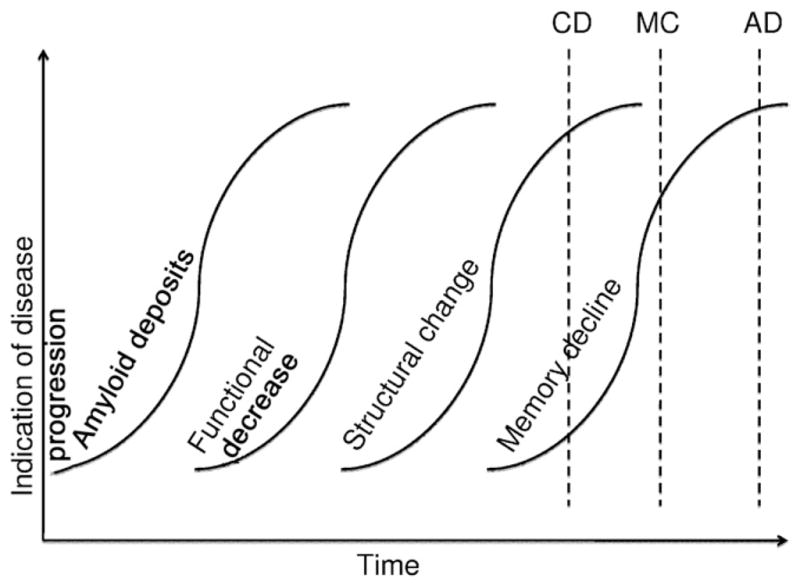
Graph representing hypothesis of disease progression in Alzheimer’s disease. The hypothesis (illustrated similarly in Jack et al. [2010]) is that first amyloid deposits increase, followed by functional decrease, structural change, and finally cognitive test scores decrease. These changes can be detected using, respectively, [11C] PiB PET imaging, PET rCBF or functional MRI, structural MRI, and memory testing (e.g., California Verbal Learning Test [CVLT] scores). The dotted lines represent the estimated timing of onset of Alzheimer’s disease (AD), mild cognitive impairment (MCI), and cognitive decline (CD) as defined and studied in this article.
Based on this model of cognitive decline, along with recent evidence that high-dimensional pattern classification can produce predictive and early diagnostic imaging-based biomarkers, we hypothesize that structural and functional change can be detected before cognitive test score decline in healthy older individuals. We also aim to determine a quantifiable score that characterizes patterns representative of cognitive decline during normal aging. Such a characterization could lead to identification of individuals at high risk for development of AD at very early stages of disease progression.
2. Methods
We use high-dimensional pattern classification techniques, combined with indicators of the dynamic changes of structure and function, to determine the temporal sequence of structural and functional brain changes and cognitive decline.
2.1. Data acquisition
The BLSA has been prospectively collecting multidisciplinary data related to physical and psychological aging since 1958. Its neuroimaging component, currently in its 15th year, has followed approximately 160 individuals (aged 55–85 years at enrollment) with annual or semiannual imaging and clinical evaluations. The neuroimaging sub-study of the BLSA, which controls for consistency of imaging data over time, is described in detail in Resnick et al. (2000, 2003).
In this study, we include longitudinal data with up to 8 years of follow-up for 143 BLSA neuroimaging study participants who remained cognitively normal up to September 2007 (described in further detail in Table 1). We exclude from the classification longitudinal data from 15 individuals diagnosed with mild cognitive impairment (MCI) over the course of the BLSA neuroimaging study and 2 individuals with dementia. A diagnosis of MCI was assigned by consensus conference if a participant had deficits in either a single cognitive domain (usually memory) or had more than one cognitive deficit but did not have functional loss in activities of daily living. Participants were evaluated at the consensus conference if their Blessed Information Memory Concentration (Blessed et al., 1968) score was greater than 3 or if their informant or subject Clinical Dementia Rating (CDR) (Morris, 1997) score was 0.5 or above. In addition, all deceased participants received a final diagnosis at death. The BLSA and neuroimaging studies were approved by the local institutional review boards, and all participants gave written informed consent before each assessment.
Table 1.
Imaging modalities available at each time point (year). SPARE-CD uses time points 1 through 9; PiB analysis uses available data at later time points. N = number of subjects. CVLT scores were computed only from the imaging data used to train/test the classifier, that is, subjects and time points for which MRI or [15O] PET-CBF data were available
| Year | N | 1 | 2 | 3 | 4 | 5 | 6 | 7 | 8 | 9 | 10 | 11 | 12 | 13 | 14 |
|---|---|---|---|---|---|---|---|---|---|---|---|---|---|---|---|
| MRI | 143 | 98% | 85% | 84% | 77% | 76% | 72% | 69% | 62% | 55% | — | — | — | — | — |
| PET | 137 | 98% | 87% | 83% | 77% | 77% | 67% | 66% | 61% | 55% | — | — | — | — | — |
| CVLT | 143 | 98% | 85% | 84% | 77% | 76% | 72% | 69% | 62% | 55% | — | — | — | — | — |
| PiB | 66 | — | 2% | 2% | — | — | 2% | — | 5% | 9% | 26% | 64% | 23% | 20% | 3% |
We used T1-weighted MR images to measure regional patterns of brain atrophy. The image acquisition parameters have been described in Resnick et al. (2001). The BLSA protocol included an axial T1-weighted volumetric spoiled gradient recalled (SPGR) series (axial acquisition, 1.5 T, repetition time (TR) = 35 ms, echo time (TE) = 5 ms, flip angle = 45°, voxel dimensions of 0.94 × 0.94 × 1.5 mm slice thickness). All scans were acquired on one of three GE (Schenectady, NY, USA) Signa 1.5-T scanners with similar operating systems.
Regional CBF was measured using PET with a bolus injection for each scan of 75 mCi of [15O] water. The images were obtained on a GE 4096 scanner, during a resting state with eyes open, as depicted in Beason-Held et al. (2008). A 60-second image was acquired after reaching a threshold radioactivity concentration in brain and included 15 slices of 6.5-mm thickness. Attenuation correction was performed.
[11C] Pittsburgh compound B (PiB) PET data have been acquired since 2005, and data from a subset of 63 individuals, each with one to three evaluations, are included in the present analyses. Images were acquired on a GE Advance scanner in 3-dimensional mode, with 37 time frames (90 minutes) obtained at rest (Sojkova et al., 2008). PET scanning started immediately after an intravenous bolus injection of a mean of 529.1 ± 37 MBq (14.3 ± 1 mCi) of [11C] PiB with a mean specific activity of 152.81 ± 55.5 GBq/ μmol [(4.13 ± 1.5 Ci)/μmol]. After attenuation correction and reconstruction using filtered backprojection with a ramp filter, resulting spatial resolution was about 4.50 mm full width at half maximum at the center of the field of view. Partial-volume correction was not performed on the [11C] PiB PET images, but the partial-volume effect was minimized by excluding edges of tissue in the volume of interest definition.
2.2. Image processing
The MR images used in this study were first preprocessed based on previously validated and published techniques (Goldszal et al., 1998). The preprocessing steps included: (1) alignment to the AC-PC (anterior commissure-posterior commissure) plane; (2) removal of extracranial material (skull-stripping) and cerebellum; (3) N3 bias correction (Sled et al., 1998; Zheng et al., 2009); (4) tissue segmentation into gray matter (GM), white matter (WM), cerebrospinal fluid (CSF), and ventricles (Pham and Prince, 1999); (5) high-dimensional image warping (Shen and Davatzikos, 2002) to a brain atlas (template) (Kabani et al., 1998) in the Montreal Neurological Institute (MNI) standardized coordinate system; and (6) formation of regional volumetric maps, called RAVENS (regional analysis of volumes examined in normalized space) maps (Davatzikos et al., 2001; Goldszal et al., 1998; Shen and Davatzikos, 2003), generated to enable analyses of volume data rather than raw structural data. The RAVENS approach has been extensively validated (Davatzikos et al., 2001; Goldszal et al., 1998) and applied to a variety of studies (Beresford et al., 2006a, b; Driscoll et al., 2009; Gur et al., 2005; Kim et al., 2003; Resnick et al., 2000, 2001, 2003, 2004; Stewart et al., 2006). In this study, RAVENS maps generated by HAMMER (Hierarchical Attribute Matching Mechanism for Elastic Registration) (Shen and Davatzikos, 2002, 2003) were normalized by individual intracranial volume (ICV) to adjust for global differences in intracranial size, down-sampled, and smoothed for incorporation of neighborhood information using an 8-mm-diameter Gaussian filter.
[15O] water PET-CBF image processing included normalization for global activity, removal of extraneous signal scatter by thresholding the image intensity at 80% of the GM mean, removal of activity in the skull, nasal sinuses, and cerebellum, rigid registration to the associated MR image, deformable registration to the standardized atlas using the MR deformation field, smoothing by a 12-mm-diameter Gaussian filter, and downsampling.
From the [11C] PiB dynamic PET images, the tracer distribution volume ratio (DVR), an index of [11C] PiB-specific binding to amyloid-β, was calculated. DVR images were generated using a simplified reference tissue model and a linear regression with a spatial constraint algorithm (Zhou et al., 2003, 2007). Cerebellum GM was used as reference tissue. The DVR values for each region of interest were obtained by applying the regions of interest, manually drawn on the coregistered MR images, to the DVR images. Mean cortical DVR was calculated by averaging values from orbitofrontal, prefrontal, superior frontal, parietal, lateral temporal, occipital, and anterior and posterior cingulate regions. This mean cortical DVR value was then averaged over all available [11C] PiB PET scans (baseline and its follow-up scans, one to three) to obtain a single DVR value for each subject.
2.3. Analysis
In this study, we developed three classifiers: one for MRI, one for [15O] PET-CBF, and one for MRI and [15O] PET-CBF together. These classifiers aim to correctly identify cognitively stable and cognitively declining subjects. These classifiers were trained with cross-sectional imaging data from the first visit in the cognitively stable group and the last visit in the declining group to maximize differences and allow the classifier to identify structural and functional imaging patterns strongly associated with cognitive decline. Because [11C] PiB PET images have only recently been acquired, the low quantity of data prohibits their inclusion in our longitudinal analysis. Thus, we do not calculate a classification score for [11C] PiB PET; rather, we calculate the correlation between our classification scores and [11C] PiB PET measurements to investigate future potential.
2.4. Defining cognitive decliners and nondecliners
Change in immediate verbal recall is among the earliest cognitive changes detected during the preclinical phase of Alzheimer’s disease (Grober et al., 2008). Thus, we used the immediate free recall score (sum of the five learning trials) from the CVLT (Delis et al., 1987) as a measure of cognitive function. We selected two subgroups from the entire cohort, based on their distinct cognitive dynamics over the follow-up period: one that showed the most pronounced cognitive decline, and one that showed the highest cognitive stability. We labeled these “cognitively stable” (CS) and “cognitively declining” (CD), the individuals with the slowest and fastest rates of cognitive decline, respectively. After excluding all subjects with MCI, our classification on the rate of decline was based on the slope of performance change over all years of each individual’s CVLT scores. Slopes were calculated with mixed-effects linear regression using an interval model with random intercept and slope (no other covariates were included). The CS group contains 20% of the total available subjects: those with the most positive or least negative CVLT score slopes. Similarly, the CD group contains 20% of the subjects: those with the most negative (declining) CVLT score slopes. In this way, we have determined two groups with distinct patterns of cognitive performance with advancing age, CS and CD. The group demographics are shown in Table 2.
Table 2.
Group demographics. Age, CVLT, and MMSE for CS and CD shown as “mean (SD) of first year, mean (SD) of last year”
| CS | CD | MRI and PET-CBF | PiB PET | |
|---|---|---|---|---|
| Number of subjects | 25 | 25 | 137 | 66 |
| Number of men | 11 | 17 | 77 | 37 |
| Number of visits, mean (SD) | 7.5 (1.9) | 8.0 (1.4) | 6.7 (2.7) | 1.5 (0.7) |
| Age, mean (SD) | 65.8 (6.2),a 73.3 (7.3) | 70.4 (7.0), 77.8 (6.3)a | 72.8 (7.7) | 79.6 (7.0) |
| CVLT slope, mean (SD) | 1.1 (0.4) | −0.8 (0.4) | 0.1 (0.7) | 0.2 (0.6) |
| CVLT, mean (SD) | 54.2 (10.2),a 67.3 (10.0) | 52.2 (11.0), 43.3 (8.5)a | 54.1 (10.7), 54.9 (12.2) | 53.7 (15.2) |
| MMSE, mean (SD) | 28.9 (1.6),a 29.5 (0.9) | 29.0 (1.1), 28.2 (1.7)a | 28.9 (1.3), 28.8 (1.3) | 28.8 (1.6) |
| APOE ε4, with/without/unknown | 8/15/2 | 5/19/1 | 38/91/8 | 20/42/4 |
Five additional subjects were available for the MRI data alone. Mean CVLT and MMSE for [11C] PiB PET were calculated in the same fashion as mean DVR, that is, scores from all available years for one subject were averaged to obtain one score per subject, and then those scores were averaged over all subjects.
Key: SD, standard deviation.
This group (first-year data or last-year data) included in training set.
2.5. High-dimensional pattern classification: the SPARE-CD score
Our goal is to quantify the similarity of an individual subject’s images to the CS or CD group’s images, with respect to the patterns of brain structure and function that are found to be most relevant to cognitive decline. To do this, we created a cross-validated classifier using the high-dimensional pattern classification software COMPARE (Classification of Morphological Patterns using Adaptive Regional Elements) (Fan et al., 2007).
High-dimensional pattern classification was used to generate one metric representing similarity of a given image to the CS or CD groups using COMPARE (Fan et al., 2007) a support vector machine (SVM)-based method for classifying groups of MR images based on regional volumetric features and/or PET images. The full method is described elsewhere (Fan et al., 2007), but briefly, the algorithm uses a number of images (in our case, the RAVENS maps or processed [15O] PET-CBF images) as input into a dimensionality reduction and SVM classifier. The classifier uses a watershed segmentation algorithm and leave-one-out cross-validation to automatically select the most relevant and discriminative features, respectively. This produces a score generally between −1 and 1, which represents the image similarity to the training groups (CD and CS, respectively). The classifier was trained on cross-sectional data from the CS and CD groups and tested only on subjects not included in the training set. This was accomplished by using external leave-two-out cross-validation, meaning that the COMPARE software was run 25 different times, each time leaving out two subjects (in a randomly selected order), one from the CS and one from the CD training groups, and that trained classifier was used to generate scores for those two subjects. This allows for generalizability of this method to previously unseen data. Using this leave-two-out cross-validation, scores for subjects in the CS and CD groups were computed for all available years. Scores for all available years for all other subjects were also computed.
We have labeled this resulting score, a quantitative metric of similarity to CS or CD, SPARE-CD (Spatial Pattern of Abnormality for Recognition of Early Cognitive Decline), in the style of our previous article using COMPARE to generate a SPARE-AD index (Davatzikos et al., 2009). SPARE-CD scores were generated for MRI, [15O] PET-CBF, and MRI and [15O] PET-CBF together.
2.5.1. Determining point of decline
We located the estimated point of the beginning of decline for both the CVLT and SPARE-CD scores by fitting a curve to the longitudinal scores for each subject and automatically estimating the point of decline based on the fit. To do this, the method uses information from each individual over available time points and excludes subjects with small amounts of data (5 or less years of relevant scores). We use a piecewise linear approach to fit the CVLT score curves and determine the point of inflection. We chose to model the CVLT scores using a piecewise linear function to incorporate prior knowledge and avoid unnecessary complexity. We took into account several pieces of prior knowledge: (1) In AD and even normal aging, the rate of decline of cognitive scores often increases at a certain point (i.e., a strictly linear model is not appropriate), (2) there is often an initial increase in CVLT scores as the subjects, particularly younger ones, learn how to take the test (i.e., the beginning of the curve may have a positive slope), and (3) there can be a stable period with no major change in scores (i.e., a quadratic fit may not model the data correctly) (Lamar et al., 2003). The piecewise linear model has 3 potential line segments, the leftmost (l1) with increasing slope (learning), the second (l2) with zero slope (stable), and the rightmost (l3) with decreasing slope (decline). It can be formulated as:
where f is a function estimating the CVLT scores, x represents years, and b1 through b5 are parameters representing slopes and intercepts of the three lines in the model (b1: slope of l1, b2:x value of transition point between l1 and l2, b3: constant y value of l2, b4:x value of transition point between l2 and l3, and b5: slope of l3). The point of transition between the period of stability (l2 with zero slope) and period of decline (l3 with negative slope), which happens at x = b4, is considered to be the point of decline for each curve.
In cases whereb4 is found to be outside of the data range (before the first year of available data or after the second-to-last year of available data), the point of decline is defined as the first or last year of data, respectively. In the aforementioned data range, we use second-to-last year instead of last year due to potential overfitting if the last data point happens to be less than the second-to-last data point.
2.5.2. Fitting SPARE-CD score curves: sigmoidal
Observation of graphs of year vs. SPARE-CD score revealed that the shape closely resembled a sigmoidal function, in that the limits were asymptotic (with a range of −1 to 1) and had a pattern of changing values once, rapidly. This is not surprising, given that support vector machines attempt to separate the data in the two training groups as far apart as possible.
The sigmoidal function used to fit the SPARE-CD curves can be written as follows:
Visual inspection of these curves shows that strong decline begins to occur near the point where the slope is half of the maximum slope occurring at the inflection point. In this analysis, we consider the point with this slope value to be the point of decline.
If it is the case that the slope is zero, we considered the point of decline to be the last year of data. In addition, if the calculated point of decline is outside the range of available data (minus one year on either side), then the point of decline is considered to be either the first or last year of available data, depending on the average score of all data points. If the negative average score is less than zero, the point of decline is considered to be the first year, and if the negative average score is greater than zero, the point of decline is considered to be the last year of available data for either the SPARE-CD or CVLT data.
To rule out the possibility of the fitting method being the determining factor in the differences found between SPARE-CD and CVLT, we also estimated the SPARE-CD score using a piecewise linear function and the CVLT score using a sigmoidal function, normalizing for the difference in scores (an approximate −1 to 1 for SPARE-CD and 20 to 80 for CVLT). We then calculated the mean squared error and the differences in points of decline using the sigmoidal and piecewise linear functions for both SPARE-CD and CVLT.
2.5.3. Specifications
Because the CVLT and SPARE-CD score models have five and four parameters, respectively, we have limited our modeling for both models to those subjects for whom we have at least five data points. For both models, the Matlab r2009b Optimization Toolbox (The Mathworks, Inc.) was used to fit the model to the raw data using a least squares fit. The parameters used for the optimization were maximum number of function evaluations (6000) and iterations (4000), while termination tolerance on both x and function value was set to 1 × 10⁻¹⁶.
2.6. Determining group differences using voxel-based morphometry
We used voxel-based comparisons (Ashburner and Friston, 2000) to determine group differences between the CS and CD group in RAVENS maps and processed [15O] PET-CBF images. The RAVENS maps and [15O] PET-CBF images were each registered to the same stereotaxic space. A voxel-wise Student t-test was performed to test the differences between images from the first year of the CS and the last year of the CD groups. A threshold corrected for false discovery rate (p < 0.05) was used to determine significance of a voxel. If no voxels were significant (i.e., [15O] PET-CBF images), this was noted and a less stringent non-corrected threshold was used (p < 0.005) to display non-significant differences. The software used to perform the statistical analysis of group differences was 3dANOVA (analysis of variance on 3D data sets), part of the AFNI (Cox, 1996) software package.
2.6.1. [11C] PiB PET correlations
In addition to analysis of point of decline, we considered the potential for [11C] PiB PET to be useful in image analysis for cognitive decline. For the [15O] PET-CBF, MRI, and [15O] PET-CBF/MRI joint SPARE-CD scores, we performed Spearman correlations (to allow for nonlinear trends) between mean cortical DVR, representing overall PiB level, and SPARE-CD metrics, including point of decline, rate of decline, average SPARE-CD value over time, and first SPARE-CD value.
3. Results
3.1. Change in brain structure and function precedes memory decline
We observed the temporal sequence of structural, functional, and cognitive decline. Having calculated the points of decline for all subjects with more than five time points, we computed the difference for each subject between the SPARE-CD point of decline and the CVLT score point of decline, visually represented in Fig. 2. MRI SPARE-CD scores declined on average 2.8 (standard deviation [SD] 2.5) years earlier than CVLT scores. [15O] PET-CBF SPARE-CD scores declined on average 2.3 (SD 2.6) years earlier than CVLT scores, and the MRI SPARE-CD scores declined 0.4 (SD 2.5) years before [15O] PET-CBF SPARE-CD scores. SPARE-CD scores based on both MRI and [15O] PET-CBF showed decline on average 2.9 (SD 2.2) years earlier than CVLT scores. These results show that structural and functional change occurs years before observed cognitive decline.
Fig. 2.

MRI, [15O] PET-CBF, [11C] PiB PET, and high-dimensional pattern classification allow for the detection of cognitive decline. Median fits to longitudinal data, for cognitive (California Verbal Learning Test [CVLT] immediate free recall) scores and imaging (MRI and [15O] PET-CBF) classification scores. Classification scores are negative SPARE-CD values, representing similarity of brain patterns to cognitively stable (CS) or cognitively declining (CD) subjects (higher and lower values, respectively). Years have been normalized to the point of CVLT decline. It is apparent from this graph that MRI and [15O] PET-CBF SPARE-CD scores, on average, show cognitive decline more than 2 years before CVLT scores. In addition, because MRI SPARE-CD scores and [11C] PiB PET mean cortical distribution volume ratio (DVR) scores are significantly correlated, the difference between MRI with high (top tertile) and low (bottom tertile) [11C] PiB PET is shown here. For interpretation of the references to color in this figure legend, the reader is referred to the Web version of this article.
3.2. [11C] PiB PET correlation with SPARE-CD scores
The mean cortical DVR of [11C] PiB PET data is significantly correlated with the mean (over time) of SPARE-CD scores generated using MRI data, p = 0.026 (Fig. 3). This difference can be visualized as in Fig. 2, where the median MRI curve is calculated for high PiB and low PiB tertiles. The difference in the curves for high vs. low PiB shows that individuals with higher β-amyloid burden have higher SPARE-CD scores, i.e., they show greater similarity to CD subjects in terms of their imaging patterns.
Fig. 3.

Correlation between [11C] PiB PET and SPARE-CD scores. Correlation was 0.280, with p-value 0.026. Each point represents one subject, with mean MRI SPARE-CD scores and mean [11C] PiB PET cortical mean distribution volume ratio (DVR) averaged over all available years for each individual.
3.3. Accuracy and consistency
We investigated several aspects of accuracy and consistency, on which the previous results are based. These included classification accuracy, modification by age, estimated curves and points of decline, and group differences.
3.4. COMPARE classification accuracy
The SPARE-CD score classified CS and CD individuals with 84% accuracy, using RAVENS (MRI) data, 84% using [15O] PET-CBF data, and 86% using MRI and [15O] PET-CBF data together, with leave-two-out cross-validation. In addition, it was found (as visualized in Fig. 4) that using the (cross-sectional) SPARE-CD scores greater than 1 year before or after the estimated inflection point could predict whether the score was before or after the SPARE-CD inflection point (AUC 0.89, sensitivity 86%, specificity 73% with threshold 0.0), whereas the CVLT scores were not useful for determining whether the score was before or after the CVLT inflection point (AUC 0.32, sensitivity 25%, specificity 50% with threshold 52). This indicates that the actual value of the SPARE-CD score, not just its longitudinal change, is useful for determining information regarding decline of an individual, whereas the CVLT score is not, unless it is observed longitudinally. Although designing a diagnostic tool is not the main focus of this work, these results are indicative of the potential power of the cross-sectional SPARE-CD score as a biomarker.
Fig. 4.

Separability of SPARE-CD and CVLT scores with respect to estimated point of decline. All SPARE-CD scores (Fig. A, using MRI and [15O] PET-CBF) and CVLT scores (Fig. B) at time points at least 1 year before the estimated point of decline for each subject are included in the black histogram, whereas those at least 1 year after estimated point of decline are included in the gray histogram. Subjects with points of decline estimated at first or last available years have been removed.
3.5. Age considerations
The goal of this work is to evaluate the value of SPARE-CD as a predictive marker. As such, it is important to ascertain whether SPARE-CD distinguishes between CS and CD, not whether other factors may or may not also have some distinguishing characteristics in those groups. It is known that aging and other effects are closely intertwined with cognitive decline and thus can be difficult, if not impossible, to separate. Nonetheless, we show that the differences selected by the classification are not the same as the differences for age in Fig. 5, in which we see that biological age at points of SPARE-CD decline varies widely (mean 72.0 [SD 6.0] years). These results demonstrate that the patterns used by the classifier to distinguish the two groups do not completely overlap those associated with age effects.
Fig. 5.

Histogram of biological age at estimated SPARE-CD point of decline for CS and CD training subjects. SPARE-CD in this case is calculated using both MRI and [15O] PET-CBF together. Estimated points of SPARE-CD decline vary considerably, which indicates that SPARE-CD measures brain characteristics well beyond what age would predict.
3.6. Estimated curves and points of decline
Figure 6 shows an example of the SPARE-CD and CVLT scores for two typical subjects, along with the estimated curves and point of decline. Normalized mean squared error for the SPARE-CD (based on MRI and [15O] PET-CBF) and CVLT score estimated curve fits was 0.019 for both. Swapping the fits (i.e., SPARE-CD with piecewise linear fit and CVLT with sigmoidal fit) resulted in increased normalized mean squared errors of 0.033 and 0.026. Differences in points of decline were greater than zero (CVLT declining after SPARE-CD), on average, for all combinations of fits (CVLT piecewise and SPARE-CD sigmoidal: 2.9 [SD 2.2]; CVLT piecewise and SPARE-CD piecewise: 3.3 [SD 2.7]; CVLT sigmoidal and SPARE-CD piecewise: 2.1 [SD 3.8]; CVLT sigmoidal and SPARE-CD sigmoidal: 1.7 SD [3.4]).
Fig. 6.

Two selected plots showing sample characteristics of the curve approximations used to estimate the point of decline, represented by an asterisk (*). Each graph contains scores from one subject over time. Classification (negative SPARE-CD) scores are calculated using MRI and [15O] PET-CBF (top, a) and MRI (bottom, b).
3.7. Group differences between CS and CD subjects
Statistically significant structural differences were found between first-year CS and last-year CD RAVENS maps. The CS group had significantly greater GM volume in medial and lateral frontal, lateral temporal, and medial and lateral occipital regions relative to the CD group. The CS group also had greater WM volume in frontal, medial temporal, and occipital regions, whereas the CD group exhibited greater WM volume predominantly in lateral temporal and medial occipital regions. In addition, the CD group had significantly greater GM volume in periventricular regions, reflecting greater WM signal abnormalities, because these abnormalities appear as GM due to darker appearance on T1-weighted MRI (Fig. 7).
Fig. 7.
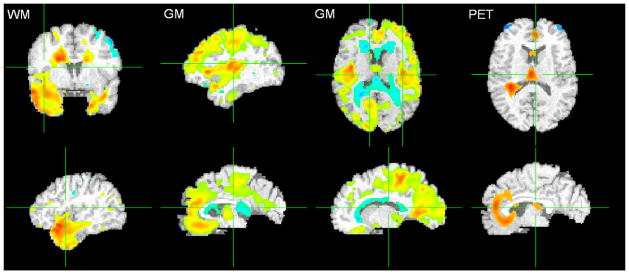
T-tests comparing cognitively stable (CS) and cognitively declining (CD) subject groups for MRI RAVENS maps and [15O] PET-CBF images. More red implies higher statistical significance and presence of tissue (or activity, in the case of PET-CBF) in CS subjects, whereas more blue implies higher statistical significance and presence of tissue (or activity) in CD subjects. Overlaid on the template brain. Left: WM (Q < 0.05, t-statistic −6.3 [blue] to 7.0 [red]); Middle: GM (Q < 0.05, t-statistic −6.2 [blue] to 8.3 [red]); Right: [15O] PET-CBF (p < 0.005, −4.8 [blue] to 4.8 [red]). Periventricular abnormal WM typically appears gray and is segmented as GM; hence the blue areas near the ventricles in the GM map (top row) represent more small-vessel disease in CD subjects. Images are in radiological convention (Left = Right). For interpretation of the references to color in this figure legend, the reader is referred to the Web version of this article.
There are also functional differences in [15O] PET-CBF between the two groups (p < 0.005 uncorrected) at these time points. The findings show that the CS group had greater activity in bilateral orbitofrontal, anterior cingulate, and insular cortices. The CD group had greater activity in bilateral superior frontal cortex (Fig. 7).
4. Discussion
In this work, we study the functional and structural progression of changes related to cognitive decline in apparently healthy individuals, to identify very early imaging-based biomarkers for cognitive decline. We tested the hypothesis that spatial patterns of brain atrophy and change in cerebral blood flow, summarized by high-dimensional pattern classification and the SPARE-CD index, precede cognitive decline in a cohort of cognitively healthy older adults. We have shown that 1) there are differences in the brain, both structurally and functionally, between the CS and CD groups; 2) these differences can be detected on an individual basis with relatively high accuracy; and 3) these changes in brain structure and function occur 2.3 to 2.9 years before decline in cognitive ability. The results also show that patterns of brain abnormality are associated with cognitive decline and with amyloid burden in the brain. Together, this work illustrates the potential for using high-dimensional pattern classification to detect subtle, but predictive, imaging phenotypes that precede cognitive decline.
4.1. Group differences in structure and function
The voxel-based analysis of MRI and [15O] PET-CBF data showed significant differences for MRI between the CD and CS subject groups. In the MRI data, the CS group has greater GM and WM volume in frontal, temporal, and occipital regions relative to the CD group. The CD group, conversely, had greater periventricular disease or WM signal abnormalities relative to the CS group. This pattern of tissue loss, particularly in cortical regions of the CD group, is relevant to the cognitive findings, as medial temporal (Eichenbaum et al., 2007) and dorsolateral prefrontal regions (Hillary et al., 2006) play prominent roles in memory function.
The CS group also showed greater [15O] PET-CBF activity in orbitofrontal, anterior cingulate, and insular regions relative to the CS group. This finding is of interest, as these regions are considered to be components of the default mode network (DMN) of resting brain function (Raichle et al., 2001; Shulman et al., 1997). Previous studies have shown that activity in the anterior component of the DMN, which includes frontal and anterior cingulate regions, declines from young adulthood to older age (Grady et al., 2006; Persson et al., 2007) but then remains relatively stable over time in normal aging (Beason-Held et al., 2009). The greater activity observed in these frontal regions may represent relative preservation of DMN function in the CS, but not the CD, group. It is possible that the decreased activity in the CD subjects may play a role in cognitive decline in this group, as some suggest that decreased anterior DMN activity might be related to cognitive decline in aging (Damoiseaux et al., 2008) and with the onset of cognitive impairment and dementia (Greicius et al., 2004; Sorg et al., 2007).
4.2. Detection of individual differences in structure and function
Although group analysis is helpful, it is ultimately most important to be able to assess risk of cognitive decline on an individual basis. Early detection of cognitive decline for individuals can have high impact on treatment effectiveness, targeting, and development. High-dimensional pattern classification allows for the reduction of the complex structural and functional patterns of each individual into a single number, the SPARE-CD index, indicating how similar an individual’s patterns are to those who are CS or CD. The SPARE-CD index in this study was found to decline on average 2.3 to 2.9 years earlier than verbal memory, which suggests that high-dimensional pattern classification scores such as the SPARE-CD index may be useful for early detection of cognitive decline for individuals.
4.3. Structural and functional changes precede cognitive decline
The SPARE-CD scores show decline before the CVLT scores. On average, MRI scores decline 2.8 (SD 2.5) years, [15O] PET-CBF scores decline 2.3 (SD 2.6) years, and MRI with [15O] PET-CBF scores decline 2.9 (SD 2.2) years earlier than the corresponding cognitive CVLT scores. Although these imaging scores clearly decline before cognitive scores, structural and functional images provide roughly similar information; MRI and [15O] PET-CBF scores decline, on average, only 0.4 (SD 2.5) years apart, and MRI and [15O] PET-CBF images produced identical SPARE-CD classification accuracy of 84%, with a combined classification accuracy increase of only 2% to 86%. Note that we did not consider partial volume correction of [15O] PET-CBF in these analyses because our emphasis was on prediction. Thus, it is possible that tissue loss contributes to the predictive accuracy of the SPARE-CD score based on [15O] PET-CBF images and, in part, explains the limited incremental benefit in combining MRI and [15O] PET-CBF measures. This analysis of SPARE-CD and CVLT points of decline supports the hypothesis and model previously suggested (Jack et al., 2009, 2010; Petersen and Jack, 2009) that in the time course of changes leading to AD, structural and functional changes occur before memory loss. It also shows that structural change is at least as early a marker as functional change, when quantified using the procedures used herein. It is possible that other functional imaging approaches, including network analysis, will provide additional information on early changes.
Three additional items should be noted. First, to select our training groups, we used the slope of all CVLT scores for each patient and adjusted for missing values using mixed-effects regression. Using the highest and lowest 20% of these scores, we determined the CS and CD groups, respectively. It is also possible to use the absolute scores, rather than slopes, to determine the groups. However, a person with a high score may decline rapidly but still maintain a high score, and a person who is already CD may increase in cognitive score over the observed period of years. In practice, this is usually not the case. The average absolute cognitive (CVLT) score in the CS group is 62.3 (SD 10.7), whereas that of the CD group is 49.9 (SD 10.2). In addition, it may be argued that the phenomenon of decline is what we are interested in, and even a subject who has higher mental functioning who decreases in cognitive function over the years is of interest in the CD group. To minimize the impact of prodromal AD, however, we excluded subjects diagnosed with MCI from our analysis.
Second, “cognitive decline” was determined based on scores from the CVLT immediate recall trials because, in our experience for this data set, this measure has shown the earliest decline in individuals who later develop AD. It should be noted that this is only one possible metric for cognitive decline, and several other equally valid metrics may also be used for this purpose. In addition, as this is only one aspect of cognitive decline (verbal learning), other scores (e.g., a composite score representing overall cognition deficits) could ultimately be considered as well, especially for prediction of other types of dementia, e.g., frontal-temporal dementia. The flexibility of this technique allows for the use of not only different image modalities but also different cognitive measures, which could allow for prediction of the relative timing of decline in other cognitive domains.
Third, many of the healthy subjects in this study do not have declining CVLT scores over the 8-year period of collected data. For those subjects who do not detectably decline over the observed years, we used the last year of available data as the representative point of decline, even though future follow-up might reveal longer periods of cognitive stability. Thus, our calculated differences between CVLT and SPARE-CD points of decline are a conservative estimate, meaning SPARE-CD may decline even earlier than the reported values in this study suggest.
4.4. Brain atrophy, cognitive decline, and amyloid burden
The fact that the [11C] PiB PET scores are associated with the mean SPARE-CD scores for MRI suggests that it may be useful to incorporate [11C] PiB PET into future SPARE-CD analysis. At this time, we have a limited amount of [11C] PiB PET data (1–3 recent years for a subset of participants). As we expect [11C] PiB PET changes to occur earlier than [15O] PET-CBF and MRI changes, it will be useful to incorporate amyloid burden into our analyses as we enroll additional individuals into the [11C] PiB PET BLSA study. In addition, our analysis of associations between SPARE-CD scores and [11C] PiB PET scores may not capture the extent of the association. PiB retention tends to be either near zero or not near zero, resulting in a non-normal distribution, and a Spearman correlation may underestimate the association.
4.5. Future work
We have investigated the functional and structural aspects of the hypothesis of AD progression (beta-amyloid deposits, then functional decline, then structural decline, then cognitive decline). In the future, we plan to use recently collected [11C] PiB PET data in conjunction with high-dimensional pattern classification to determine whether even earlier biomarkers are possible. In addition to the categorical pattern classification approach we followed herein, we plan to investigate the utility of pattern regression methods aiming to estimate continuous variables from imaging patterns, a potentially more suitable approach to estimating cognitive decline when large amounts of data are available (Wang et al., 2010). Finally, as more individuals in the BLSA convert to MCI and more [11C] PiB PET data are acquired, we will be in a position to better investigate the temporal dynamics of amyloid deposition, imaging changes, cognitive decline, and clinical conversion.
5. Conclusions
In this study, we investigated longitudinal progression of imaging characteristics of early cognitive decline during normal aging, well before clinically measurable changes occur, by leveraging on high-dimensional imaging pattern classification methods and imaging data from the BLSA. We produced an individualized quantitative value (SPARE-CD) representing functional ([15O] PET-CBF) and/or structural (MRI) change associated with cognitive (CVLT) decline, and in addition to finding that SPARE-CD may have potential as a cross-sectional biomarker on its own, we found that these imaging changes occur years before detectable loss of cognitive function. Additionally, [11C] PiB PET signal is correlated with patterns in structural data representing cognitive decline. Biomarkers of early brain changes associated with AD continue to increase in importance for research and clinical diagnoses (Albert et al., 2011; McKhann et al., 2011; Sperling et al., 2011), and this work suggests that using high-dimensional pattern classification and imaging data could lead to viable biomarkers to predict cognitive decline in healthy adults while there is still opportunity for preventative measures.
Acknowledgments
This work was supported by the National Institutes of Health (grant numbers R01-AG-14971, N01-AG-3-2124); and the Intramural Research Program of the National Institutes of Health, National Institute on Aging. The authors would like to thank Yang An at NIH for producing the CVLT score slopes using mixed-effects linear regression, Bennett Landman at Vanderbilt for providing a script for normalization of [15O] PET-CBF data, and Stathis Kanterakis and Drew Parker at Penn for assistance with statistical analysis. We are grateful to the BLSA participants and staff for their dedication to these studies.
Footnotes
Disclosure statement
No conflicts of interest have been reported by the authors. All studies were approved by the institutional review boards of all institutions involved.
References
- Albert MS, Dekosky ST, Dickson D, Dubois B, Feldman HH, Fox NC, Gamst A, Holtzman DM, Jagust WJ, Petersen RC, Snyder PJ, Carrillo MC, Thies B, Phelps CH. The diagnosis of mild cognitive impairment due to Alzheimer’s disease: recommendations from the National Institute on Aging-Alzheimer’s Association workgroups on diagnostic guidelines for Alzheimer’s disease. Alzheimers Dement. 2011;7:270–279. doi: 10.1016/j.jalz.2011.03.008. [DOI] [PMC free article] [PubMed] [Google Scholar]
- Ashburner J, Friston KJ. Voxel-based morphometry: the methods. Neuroimage. 2000;11:805–821. doi: 10.1006/nimg.2000.0582. [DOI] [PubMed] [Google Scholar]
- Baker LD, Frank LL, Foster-Schubert K, Green PS, Wilkinson CW, McTiernan A, Plymate SR, Fishel MA, Watson GS, Cholerton BA, Duncan GE, Mehta PD, Craft S. Effects of aerobic exercise on mild cognitive impairment: a controlled trial. Arch Neurol. 2010;67:71–79. doi: 10.1001/archneurol.2009.307. [DOI] [PMC free article] [PubMed] [Google Scholar]
- Beason-Held L, Kraut MA, Resnick SM. Stability of default-mode network activity in the aging brain. Brain Imaging Behav. 2009;3:123–131. doi: 10.1007/s11682-008-9054-z. [DOI] [PMC free article] [PubMed] [Google Scholar]
- Beason-Held LL, Kraut MA, Resnick SM. I. Longitudinal changes in aging brain function. Neurobiol Aging. 2008;29:483–496. doi: 10.1016/j.neurobiolaging.2006.10.031. [DOI] [PMC free article] [PubMed] [Google Scholar]
- Beresford TP, Arciniegas DB, Alfers J, Clapp L, Martin B, Beresford HF, Du YP, Liu DF, Shen DG, Davatzikos C, Laudenslager ML. Hypercortisolism in alcohol dependence and its relation to hippocampal volume loss. J Stud Alcohol. 2006a;67:861–867. doi: 10.15288/jsa.2006.67.861. [DOI] [PubMed] [Google Scholar]
- Beresford TP, Arciniegas DB, Alfers J, Clapp L, Martin B, Liu YPDDF, Shen DG, Davatzikos C. Hippocampus volume loss due to chronic heavy drinking. Alcohol Clin Exp Res. 2006b;30:1866–1870. doi: 10.1111/j.1530-0277.2006.00223.x. [DOI] [PubMed] [Google Scholar]
- Blessed G, Tomlinson BE, Roth M. The association between quantitative measures of dementia and of senile change in cerebral grey matter of elderly subjects. Br J Psychiatry. 1968;114:797–811. doi: 10.1192/bjp.114.512.797. [DOI] [PubMed] [Google Scholar]
- Cox RW. AFNI: software for analysis and visualization of functional magnetic resonance neuroimages. Comput Biomed Res Int J. 1996;29:162–173. doi: 10.1006/cbmr.1996.0014. [DOI] [PubMed] [Google Scholar]
- Damoiseaux JS, Beckmann CF, Arigita EJ, Barkhof F, Scheltens P, Stam CJ, Smith SM, Rombouts SA. Reduced resting-state brain activity in the “default network” in normal aging. Cereb Cortex. 2008;18:1856–1864. doi: 10.1093/cercor/bhm207. [DOI] [PubMed] [Google Scholar]
- Davatzikos C, Genc A, Xu DR, Resnick SM. Voxel-based morphometry using the RAVENS maps: methods and validation using simulated longitudinal atrophy. Neuroimage. 2001;14:1361–1369. doi: 10.1006/nimg.2001.0937. [DOI] [PubMed] [Google Scholar]
- Davatzikos C, Resnick SM, Wu X, Parmpi P, Clark CM. Individual patient diagnosis of AD and FTD via high-dimensional pattern classification of MRI. Neuroimage. 2008;41:1220–1227. doi: 10.1016/j.neuroimage.2008.03.050. [DOI] [PMC free article] [PubMed] [Google Scholar]
- Davatzikos C, Xu F, An Y, Fan Y, Resnick SM. Longitudinal progression of Alzheimer’s-like patterns of atrophy in normal older adults: the SPARE-AD index. Brain. 2009;132:2026–2035. doi: 10.1093/brain/awp091. [DOI] [PMC free article] [PubMed] [Google Scholar]
- Delis D, Kramer J, Kaplan E, Ober B. California Verbal Learning Test—Research Edition. The Psychological Corporation; New York: 1987. [Google Scholar]
- Driscoll I, Davatzikos C, An Y, Wu X, Shen D, Kraut M, Resnick SM. Longitudinal pattern of regional brain volume change differentiates normal aging from MCI. Neurology. 2009;72:1906–1913. doi: 10.1212/Wnl.0b013e3181a82634. [DOI] [PMC free article] [PubMed] [Google Scholar]
- Duchesne S, Caroli A, Geroldi C, Barillot C, Frisoni GB, Collins DL. MRI-based automated computer classification of probable AD versus normal controls. IEEE Trans Med Imaging. 2008;27:509–520. doi: 10.1109/TMI.2007.908685. [DOI] [PubMed] [Google Scholar]
- Eichenbaum H, Yonelinas AP, Ranganath C. The medial temporal lobe and recognition memory. Annu Rev Neurosci. 2007;30:123–152. doi: 10.1146/annurev.neuro.30.051606.094328. [DOI] [PMC free article] [PubMed] [Google Scholar]
- Fan Y, Shen D, Gur RC, Gur RE, Davatzikos C. COMPARE: classification of morphological patterns using adaptive regional elements. IEEE Trans Med Imaging. 2007;26:93–105. doi: 10.1109/TMI.2006.886812. [DOI] [PubMed] [Google Scholar]
- Goldszal AF, Davatzikos C, Pham DL, Yan MX, Bryan RN, Resnick SM. An image-processing system for qualitative and quantitative volumetric analysis of brain images. J Comput Assist Tomogr. 1998;22:827–837. doi: 10.1097/00004728-199809000-00030. [DOI] [PubMed] [Google Scholar]
- Grady CL, Springer MV, Hongwanishkul D, McIntosh AR, Winocur G. Age-related changes in brain activity across the adult lifespan. J Cogn Neurosci. 2006;18:227–241. doi: 10.1162/089892906775783705. [DOI] [PubMed] [Google Scholar]
- Greicius MD, Srivastava G, Reiss AL, Menon V. Default-mode network activity distinguishes Alzheimer’s disease from healthy aging: evidence from functional MRI. Proc Natl Acad Sci U S A. 2004;101:4637–4642. doi: 10.1073/pnas.0308627101. [DOI] [PMC free article] [PubMed] [Google Scholar]
- Grober E, Hall CB, Lipton RB, Zonderman AB, Resnick SM, Kawas C. Memory impairment, executive dysfunction, and intellectual decline in preclinical Alzheimer’s disease. J Int Neuropsychol Soc’Y. 2008;14:266–278. doi: 10.1017/S1355617708080302. [DOI] [PMC free article] [PubMed] [Google Scholar]
- Gur RC, Davatzikos C, Shen D, Wu X, Fan Y, Hughett P, Turetsky BI, Gur RE. Whole-brain deformation based morphometry MRI study of schizophrenia. Schizophr Bull. 2005;31:408. [Google Scholar]
- Hanninen T, Koivisto K, Reinikainen KJ, Helkala EL, Soininen H, Mykkänen L, Laakso M, Riekkinen PJ. Prevalence of ageing-associated cognitive decline in an elderly population. Age Ageing. 1996;25:201–205. doi: 10.1093/ageing/25.3.201. [DOI] [PubMed] [Google Scholar]
- Hillary FG, Genova HM, Chiaravalloti ND, Rypma B, DeLuca J. Prefrontal modulation of working memory performance in brain injury and disease. Hum Brain Mapp. 2006;27:837–847. doi: 10.1002/hbm.20226. [DOI] [PMC free article] [PubMed] [Google Scholar]
- Jack CR, Jr, Knopman DS, Jagust WJ, Shaw LM, Aisen PS, Weiner MW, Petersen RC, Trojanowski JQ. Hypothetical model of dynamic biomarkers of the Alzheimer’s pathological cascade. Lancet Neurol. 2010;9:119–128. doi: 10.1016/S1474-4422(09)70299-6. [DOI] [PMC free article] [PubMed] [Google Scholar]
- Jack CR, Jr, Lowe VJ, Weigand SD, Wiste HJ, Senjem ML, Knopman DS, Shiung MM, Gunter JL, Boeve BF, Kemp BJ, Weiner M, Petersen RC. Serial PIB and MRI in normal, mild cognitive impairment and Alzheimer’s disease: implications for sequence of pathological events in Alzheimer’s disease. Brain. 2009;132:1355–1365. doi: 10.1093/brain/awp062. [DOI] [PMC free article] [PubMed] [Google Scholar]
- Kabani N, MacDonald D, Holmes CJ, Evans A. A 3D atlas of the human brain. Neuroimage. 1998;7:S717. [Google Scholar]
- Kim J-S, Kanaan R, Kaufmann W, Ross C, Calhoun V, Xu D, Shen D, Davatzikos C, Godfrey Pearlson GD. Abnormal White Matter Organization in Huntington’s Disease Evaluated With Diffusion Tensor MRI. ISMRM; Toronto, Canada: 2003. [Google Scholar]
- Kloppel S, Stonnington CM, Chu C, Draganski B, Scahill RI, Rohrer JD, Fox NC, Jack CR, Jr, Ashburner J, Frackowiak RS. Automatic classification of MR scans in Alzheimer’s disease. Brain. 2008;131:681–689. doi: 10.1093/brain/awm319. [DOI] [PMC free article] [PubMed] [Google Scholar]
- Koutsouleris N, Meisenzahl EM, Davatzikos C, Bottlender R, Frodl T, Scheuerecker J, Schmitt G, Zetzsche T, Decker P, Reiser M, Möller HJ, Gaser C. Use of neuroanatomical pattern classification to identify subjects in at-risk mental states of psychosis and predict disease transition. Arch Gen Psychiatry. 2009;66:700–712. doi: 10.1001/archgenpsychiatry.2009.62. [DOI] [PMC free article] [PubMed] [Google Scholar]
- Lamar M, Resnick SM, Zonderman AB. Longitudinal changes in verbal memory in older adults: distinguishing the effects of age from repeat testing. Neurology. 2003;60:82–86. doi: 10.1212/wnl.60.1.82. [DOI] [PubMed] [Google Scholar]
- McKhann GM, Knopman DS, Chertkow H, Hyman BT, Jack CR, Jr, Kawas CH, Klunk WE, Koroshetz WJ, Manly JJ, Mayeux R, Mohs RC, Morris JC, Rossor MN, Scheltens P, Carrillo MC, Thies B, Weintraub S, Phelps CH. The diagnosis of dementia due to Alzheimer’s disease: recommendations from the National Institute on Aging-Alzheimer’s Association workgroups on diagnostic guidelines for Alzheimer’s disease. Alzheimers Dement. 2011;7:263–269. doi: 10.1016/j.jalz.2011.03.005. [DOI] [PMC free article] [PubMed] [Google Scholar]
- Misra C, Fan Y, Davatzikos C. Baseline and longitudinal patterns of brain atrophy in MCI patients, and their use in prediction of short-term conversion to AD: results from ADNI. Neuroimage. 2009;44:1415–1422. doi: 10.1016/j.neuroimage.2008.10.031. [DOI] [PMC free article] [PubMed] [Google Scholar]
- Missotten P, Squelard G, Ylieff M, Di Notte D, Paquay L, De Lepeleire J, Buntinx F, Fontaine O. Relationship between quality of life and cognitive decline in dementia. Dement Geriatr Cogn Disord. 2008;25:564–572. doi: 10.1159/000137689. [DOI] [PubMed] [Google Scholar]
- Missotten P, Thomas P, Squelard G, Di Notte D, Fontaine O, Paquay L, De Lepeleire J, Buntinx F, Ylieff M. Impact of place of residence on relationship between quality of life and cognitive decline in dementia. Alzheimer Dis Assoc Disord. 2009;23:395–400. doi: 10.1097/WAD.0b013e3181b4cf48. [DOI] [PubMed] [Google Scholar]
- Morris JC. Clinical dementia rating: a reliable and valid diagnostic and staging measure for dementia of the Alzheimer type. Int Psychogeriatr. 1997;9 (suppl 1):173–176. doi: 10.1017/s1041610297004870. discussion, 7–8. [DOI] [PubMed] [Google Scholar]
- Mowszowski L, Batchelor J, Naismith SL. Early intervention for cognitive decline: can cognitive training be used as a selective prevention technique? Int Psychogeriatr. 2010;22:537–548. doi: 10.1017/S1041610209991748. [DOI] [PubMed] [Google Scholar]
- Naismith SL, Glozier N, Burke D, Carter PE, Scott E, Hickie IB. Early intervention for cognitive decline: is there a role for multiple medical or behavioural interventions? Early Interv Psychiatry. 2009;3:19–27. doi: 10.1111/j.1751-7893.2008.00102.x. [DOI] [PubMed] [Google Scholar]
- Persson J, Lustig C, Nelson JK, Reuter-Lorenz PA. Age differences in deactivation: a link to cognitive control? J Cogn Neurosci. 2007;19:1021–1032. doi: 10.1162/jocn.2007.19.6.1021. [DOI] [PubMed] [Google Scholar]
- Petersen RC, Jack CR. Imaging and biomarkers in early Alzheimer’s disease and mild cognitive impairment. Clin Pharmacol Ther. 2009;86:438–441. doi: 10.1038/clpt.2009.166. [DOI] [PMC free article] [PubMed] [Google Scholar]
- Pham DL, Prince JL. Adaptive fuzzy segmentation of magnetic resonance images. IEEE Trans Med Imaging. 1999;18:737–752. doi: 10.1109/42.802752. [DOI] [PubMed] [Google Scholar]
- Plassman BL, Langa KM, Fisher GG, Heeringa SG, Weir DR, Ofstedal MB, Burke JR, Hurd MD, Potter GG, Rodgers WL, Steffens DC, McArdle JJ, Willis RJ, Wallace RB. Prevalence of cognitive impairment without dementia in the United States. Ann Intern Med. 2008;148:427–434. doi: 10.7326/0003-4819-148-6-200803180-00005. [DOI] [PMC free article] [PubMed] [Google Scholar]
- Raichle ME, MacLeod AM, Snyder AZ, Powers WJ, Gusnard DA, Shulman GL. A default mode of brain function. Proc Natl Acad Sci U S A. 2001;98:676–682. doi: 10.1073/pnas.98.2.676. [DOI] [PMC free article] [PubMed] [Google Scholar]
- Resnick S, Davatzikos C, Kraut M, Zonderman A. Longitudinal changes in MRI volumes in older adults. Neurobiol Aging. 2001;22:332. [Google Scholar]
- Resnick SM, Goldszal AF, Davatzikos C, Golski S, Kraut MA, Metter EJ, Bryan RN, Zonderman AB. One-year age changes in MRI brain volumes in older adults. Cereb Cortex. 2000;10:464–472. doi: 10.1093/cercor/10.5.464. [DOI] [PubMed] [Google Scholar]
- Resnick SM, Pham DL, Davatzikos C, Kraut MA. Sex differences in regional cerebral blood flow: clinical implications for Alzheimer’s disease. Neurobiol Aging. 2004;25:263. [Google Scholar]
- Resnick SM, Pham DL, Kraut MA, Zonderman AB, Davatzikos C. Longitudinal magnetic resonance imaging studies of older adults: a shrinking brain. J Neurosci. 2003;23:3295–3301. doi: 10.1523/JNEUROSCI.23-08-03295.2003. [DOI] [PMC free article] [PubMed] [Google Scholar]
- Scafato E, Gandin C, Galluzzo L, Ghirini S, Cacciatore F, Capurso A, Solfrizzi V, Panza F, Cocchi A, Consoli D, Enzi G, Frisoni GB, Gandolfo C, Giampaoli S, Inzitari D, Maggi S, Crepaldi G, Mariotti S, Mecocci P, Motta M, Negrini R, Postacchini D, Rengo F, Farchi G. Prevalence of aging-associated cognitive decline—AACD in an Italian elderly population: results from the cross sectional phase of the Italian PRoject on the Epidemiology of Alzheimer’s disease (I.PRE.A.) Aging Clin Exp Res. 2010;22:440–449. doi: 10.1007/BF03337739. [DOI] [PubMed] [Google Scholar]
- Shen D, Davatzikos C. HAMMER: hierarchical attribute matching mechanism for elastic registration. IEEE Trans Med Imaging. 2002;21:1421–1439. doi: 10.1109/TMI.2002.803111. [DOI] [PubMed] [Google Scholar]
- Shen DG, Davatzikos C. Very high-resolution morphometry using mass-preserving deformations and HAMMER elastic registration. Neuroimage. 2003;18:28–41. doi: 10.1006/nimg.2002.1301. [DOI] [PubMed] [Google Scholar]
- Shulman G, Fiez J, Corbetta M, Buckner R, Miezin F, Raichle M, Petersen SE. Common blood flow changes across visual tasks: II. Decreases in cerebral cortex. J Cogn Neurosci. 1997;9:648–663. doi: 10.1162/jocn.1997.9.5.648. [DOI] [PubMed] [Google Scholar]
- Sled JG, Zijdenbos AP, Evans AC. A nonparametric method for automatic correction of intensity nonuniformity in MRI data. IEEE Trans Med Imaging. 1998;17:87–97. doi: 10.1109/42.668698. [DOI] [PubMed] [Google Scholar]
- Sojkova J, Beason-Held L, Zhou Y, An Y, Kraut MA, Ye W, Ferrucci L, Mathis CA, Klunk WE, Wong DF, Resnick SM. Longitudinal cerebral blood flow and amyloid deposition: an emerging pattern? J Nucl Med. 2008;49:1465–1471. doi: 10.2967/jnumed.108.051946. [DOI] [PMC free article] [PubMed] [Google Scholar]
- Sorg C, Riedl V, Mühlau M, Calhoun VD, Eichele T, Läer L, Drzezga A, Förstl H, Kurz A, Zimmer C, Wohlschläger AM. Selective changes of resting-state networks in individuals at risk for Alzheimer’s disease. Proc Natl Acad Sci U S A. 2007;104:18760–18765. doi: 10.1073/pnas.0708803104. [DOI] [PMC free article] [PubMed] [Google Scholar]
- Sperling RA, Aisen PS, Beckett LA, Bennett DA, Craft S, Fagan AM, Iwatsubo T, Jack CR, Jr, Kaye J, Montine TJ, Park DC, Reiman EM, Rowe CC, Siemers E, Stern Y, Yaffe K, Carrillo MC, Thies B, Morrison-Bogorad M, Wagster MV, Phelps CH. Toward defining the preclinical stages of Alzheimer’s disease: recommendations from the National Institute on Aging-Alzheimer’s Association workgroups on diagnostic guidelines for Alzheimer’s disease. Alzheimers Dement. 2011;7:280–292. doi: 10.1016/j.jalz.2011.03.003. [DOI] [PMC free article] [PubMed] [Google Scholar]
- Stewart WF, Schwartz BS, Davatzikos C, Shen D, Liu D, Wu X, Todd AC, Shi W, Bassett S, Youssem D. Past adult lead exposure is linked to neurodegeneration measured by brain MRI. Neurology. 2006;66:1476–1484. doi: 10.1212/01.wnl.0000216138.69777.15. [DOI] [PubMed] [Google Scholar]
- Vemuri P, Gunter JL, Senjem ML, Whitwell JL, Kantarci K, Knopman DS, Boeve BF, Petersen RC, Jack CR., Jr Alzheimer’s disease diagnosis in individual subjects using structural MR images: validation studies. Neuroimage. 2008;39:1186–1197. doi: 10.1016/j.neuroimage.2007.09.073. [DOI] [PMC free article] [PubMed] [Google Scholar]
- Wang Y, Fan Y, Bhatt P, Davatzikos C. High-dimensional pattern regression using machine learning: from medical images to continuous clinical variables. Neuroimage. 2010;50:1519–1535. doi: 10.1016/j.neuroimage.2009.12.092. [DOI] [PMC free article] [PubMed] [Google Scholar]
- Yaffe K, Barnes D, Nevitt M, Lui LY, Covinsky K. A prospective study of physical activity and cognitive decline in elderly women: women who walk. Arch Intern Med. 2001;161:1703–1708. doi: 10.1001/archinte.161.14.1703. [DOI] [PubMed] [Google Scholar]
- Zheng WL, Chee MWL, Zagorodnov V. Improvement of brain segmentation accuracy by optimizing non-uniformity correction using N3. Neuroimage. 2009;48:73–83. doi: 10.1016/j.neuroimage.2009.06.039. [DOI] [PubMed] [Google Scholar]
- Zhou Y, Endres CJ, Brasić JR, Huang SC, Wong DF. Linear regression with spatial constraint to generate parametric images of ligand-receptor dynamic PET studies with a simplified reference tissue model. Neuroimage. 2003;18:975–989. doi: 10.1016/s1053-8119(03)00017-x. [DOI] [PubMed] [Google Scholar]
- Zhou Y, Resnick SM, Ye W, Fan H, Holt DP, Klunk WE, Mathis CA, Dannals R, Wong DF. Using a reference tissue model with spatial constraint to quantify [11C]Pittsburgh compound B PET for early diagnosis of Alzheimer’s disease. Neuroimage. 2007;36:298–312. doi: 10.1016/j.neuroimage.2007.03.004. [DOI] [PMC free article] [PubMed] [Google Scholar]