

Abstract
In this 3-year prospective study, we explored antecedents of school-based adjustment among 134 inner-city high-school students. We examined the role of freshman-year risk and protective factors in relation to dropout status and senior-year adjustment indices among those who remained in school, including academic performance, psychological symptoms, and drug use. Although each single attribute included in this study has been linked to poor academic performance in previous investigations, the primary goal in this study was to determine which attributes were strongly related to academic problems when considered together. In addition, we sought to establish whether risk factors associated with dropout were the same as those that predicted academic problems among students who remained in school. Findings indicated that freshman-year attendance and demographic indices were most strongly predictive of dropout. Among adolescents who remained in school, freshman academic success was robustly linked to senior-year competence. Implications for identifying inner-city high-school students at high risk for academic problems are discussed.
Keywords: Risk, Adolescence, Dropout, Ethnicity, Low SES, Academic adjustment
Current trends among economically disadvantaged high-school students reflect academic improvements in some areas. For example, the dropout rate among African Americans is declining to the levels of non-Hispanic whites (McMillen & Kaufman, 1997). However, there are also areas of growing concern, such as persistently high dropout rates among specific subgroups, poor academic achievement, and drug use in many inner-city schools.
Strong links between low socioeconomic status (SES) and low academic performance and dropout (McLoyd, 1998) help to explain the clustering of negative academic outcomes among low-income inner-city adolescents. But beyond associations involving SES and ethnicity with variations in academic adjustment (McDermott, 1995), there remains a high degree of variability in outcomes among groups of low-income minority students. What differentiates between low-SES students who succeed academically from those who do not?
Whereas academic success is a complex and multidetermined construct (Walberg & Tsai, 1985), this article focuses on the role of personal attributes in predicting academic success among low-income teens. Individual characteristics have been established as strong predictors of dropout, more so than, for example, neighborhood variables (Ensminger, Lamkin, & Jacobson, 1996). Although we will concentrate on this one domain of risk—we will not include other salient influences such as school quality, peer and family relationships, and neighborhood/community effects—this investigation will add to the literature by exploring risk within a group of low-income inner-city high-school students. We followed these teens from their freshman to senior year, a time frame that we selected primarily because high-school administrators expressed concern about the 30% dropout rate over this interval. Data that shed light on the phenomenon were intended to aid in developing more effective ways to identify high-risk youth for school-based prevention measures (Resnick & Burt, 1996).
The personal characteristics selected for this study constitute a major group of vulnerability or protective variables for adjustment among at-risk youth (Luthar, 1999; Masten, Best, & Garmezy, 1990). Specifically, we examined four types of attributes, each of which is discussed in detail below. These include demographic markers (ethnicity, single-parent family structure, gender, and age), intellectual functioning, school-based adjustment (grades, teacher-rated adjustment, and absences), and personal adjustment (as indicated by peer appraisals of social functioning and self-rated psychological distress and drug use). In addition to their theoretical importance, demographic and school-based adjustment indices are readily available to schools, suggesting that they might be used to quickly identify students at high risk.
DEMOGRAPHIC INDICATORS
Previous research has shown that certain ethnic minority subgroups of youth are at high risk for school noncompletion. To date, we know of no studies that employ a prospective design to compare high-school student adjustment across ethnic groups. Existing data suggest that, although the dropout rate among Black teens has been dropping in recent years, levels remain elevated (Ford, 1993), particularly in inner-city schools (Fine, 1986). Moreover, dropout rates and low academic achievement among Puerto Rican adolescents are alarmingly high (Chapa & Valencia, 1993; Goldenberg, 1996). Indeed, Latino children, in general, appear to have more severe problems than African Americans across a wide range of domains, including academics (Luthar, 1999). Because of the burgeoning Puerto Rican population in the northeastern region of the United States, persistently poor academic outcomes associated with this subgroup have generated considerable concern and attention from school administrators.
Adolescents from single-parent families have also been found to be at high risk for negative academic outcomes (McMillen & Kaufman, 1997). Indeed, several studies have shown that poor children of single mothers are vulnerable across many spheres of psychological adjustment (McLanahan, 1997). Some of these effects may be due, in part, to shared variance with socioeconomic disadvantage, such that differences in achievement between students from two- and single-parent homes may become reduced when income is held constant (Battle, 1997).
A salient child demographic risk marker for negative academic outcomes is the child’s “age for grade.” Being more than 1 year older than the modal age for grade has been established as a robust index of risk for dropout (Cairns, Cairns, & Neckerman, 1989; Meisels & Liaw, 1993). Age is widely accepted as a proxy for previous grade-level retention in educational research, and dropouts typically have experienced at least one episode of retention (Grissom & Shepard, 1989). The dropout rate for students retained at least one grade level is reportedly twice that of nonretainees (McMillen & Kaufman, 1997). In this study, age was used as a continuous variable as a proxy for grade retention.
Gender differences in educational trajectories have also been documented among children in poverty (Luthar, 1999): Disadvantaged boys tend to show poorer outcomes than their female peers, beginning in the elementary school years (Eckenrode, Rowe, Laird, & Braithwaite, 1995). By high school, inner-city male students attain lower academic grades as well as poorer teacher ratings of classroom behaviors than females (Luthar, 1995). In research involving African American teens from multiple urban locations in the United States, boys consistently fared more poorly than girls on a composite construct of low attendance, low achievement scores and grades, suspension, and retention at school (Connell, Spencer, & Aber, 1994).
INTELLECTUAL FUNCTIONING
Although intelligence is widely assumed to be an integral part of academic performance (Masten et al., 1988), its role in school-based competence among inner-city adolescents remains incompletely understood. Several studies have shown that low levels of intelligence are generally linked with negative adaptive outcomes among youth at risk (Lynam, Moffitt, & Stouthamer-Loeber, 1993). On the other hand, cross-sectional and short-term (6-month) prospective studies with inner-city high-school freshmen have suggested that although intelligence is generally protective, more intelligent teens may display greater reactivity to stressors than their less intelligent peers (Luthar & Ripple, 1994; Luthar & Zigler, 1992).
SCHOOL-BASED ADJUSTMENT
Structural-organizational perspectives of child development (Cicchetti & Toth, 1995) maintain that there is general coherence in the unfolding of competence over time, such that early success sets the stage for subsequent success or failure as future challenges arise. This continuity is strongly evident in the academic domain: Dropouts and low-achieving high-school students typically have histories of poor academic performance (Cairns et al., 1989; Simner & Barnes, 1991).
Using a multidomain, multi-informant strategy, we included several indices to assess school-based competence. In addition to freshman-year grades, we assessed absenteeism, which has been cited as the strongest behavioral antecedent to dropout (Bryk & Thum, 1989). High rates of freshman absenteeism (Kupersmidt & Coie, 1990) and attendance patterns even as early as the primary grades (Oakland, 1992) have been reported to predict high-school dropout. Although absenteeism may be attributable to a number of causes, high rates of nonattendance hinder or prohibit the process of education and are salient harbingers of poor academic outcomes (Weitzman & Siegel, 1992). We also examined teacher-rated classroom behavior. Previous research has shown strong associations between adolescent academic achievement and teacher reports of positive classroom behaviors (Fantuzzo, Rohrbeck, & Hightower, 1989).
PEER- AND SELF-RATED PERSONAL ADJUSTMENT
The salience of peer reputation in adolescence suggests that it may play a role in school adjustment. Positive associations between popularity and academic competence have been noted for younger children (Milgram & Palti, 1993). However, the valence of this association shifts over time (Juvonen & Murdock, 1995) such that, among adolescents, the two are often unrelated or are negatively correlated. Among inner-city teenagers, cross-sectional and short-term prospective data have suggested that popularity can be positively linked with academic difficulties and problem behavior (Luthar, 1995).
Existing data link low academic competence to high levels of self-reported psychological distress (Blechman, McEnroe, & Carella, 1986). For example, significant negative associations between achievement and depression have been found among 11- to 15-year-olds (of unspecified ethnicity; Slotkin, Forehand, Fauber, McCombs, & Long, 1988) and among a sample of 10- to 26-year-old African American youth (Connell et al., 1994). In contrast, the association between psychological symptoms and academic adjustment may be positive for some inner-city students. High-achieving minority youth may experience a sense of isolation from their peers and a loss of cultural identity (Arroyo & Zigler, 1995; Fordham & Ogbu, 1990), which in turn lead to negative emotional states (Kaplan & Marks, 1990). Studies of inner-city adolescents have found that some academically competent youth can suffer from surprisingly high levels of dysphoria and anxiety (Luthar, 1991), suggesting that inner-city youth who do well in school may have to pay a price for their achievements by experiencing psychological distress.
Although not necessarily indicative of pervasive psychological disorder in the context of the inner-city environments (Luthar, 1999), high levels of adolescent drug use have been associated with problems in several outcome domains including academics (Paulson, Coombs, & Richardson, 1990). Six-month prospective data on inner-city teens indicated that drug use was related to subsequent increases in maladjustment among high-school freshmen (Luthar & Cushing, 1997). Others argue, however, that adolescent drug use is a normative aspect of development, and moderate use is not necessarily associated with negative outcomes (Shedler & Block, 1990). Associations between dropout and drug use suggest that these negative outcomes tend to co-occur across ethnic groups (Beauvais, Chavez, Oetting, Deffenbacher, & Cornell, 1996), and drug use has been shown to contribute to dropout risk among Hispanic youth (Fagan & Pabon, 1990).
THE PRESENT INVESTIGATION
In summary, the present study of inner-city adolescents was aimed at examining the relative prognostic significance of personal characteristics in terms of their associations with adjustment indices several years later. Antecedents were four sets of child characteristics that were generally and readily accessible to school administrators and psychologists: demographic markers, intellectual functioning, academic competence, and personal adjustment. These constructs were considered in relation to four types of outcomes 3 years later: dropout status, academic adjustment, psychological distress, and drug use. Specifically, we asked, Within this group of low-income students, which specific personal characteristics are prospectively associated with dropout and with poor academic outcomes?
METHOD
Sample
Participants were adolescents who had taken part in an investigation of psychosocial resilience (Luthar, Doernberger, & Zigler, 1993). Students from 10 freshman English classes in an inner-city high school, with 2 classes randomly selected from each of five ability groupings (tracking levels), provided Time 1 data in the fall of the students’ freshman year. Only 4 students who were approached refused to take part at Time 1. Parental consent was obtained at both Time 1 and Time 2 for participants younger than 18 years, and each participant signed a letter of assent at each data-collection point.
Complete Time 1 (freshman) data were obtained from 163 students (84 girls and 79 boys). The mean age of participants was 15.0 years (SD = 1.0, range 13.8–18.6 years), and the mean SES for their families was in the second lowest of five categories on the Hollingshead Two-Factor Index (as described later in this paper; Hollingshead & Redlich, 1958). Eighty-five percent of the participants were from minority groups, including 41% African American, 30% Puerto Rican, 7% Asian, and 7% who described themselves as belonging to an “other” ethnic group.
The present study involved a 3-year follow-up of the original sample of 163 adolescents in the fall of their senior year of high school (Time 2). School records indicated that 86 (53%) of the original sample still attended the same school, 14 (9%) attended other high schools within the state, 16 (10%) had moved out of state, 6 (4%) had graduated in the previous year, 2 were incarcerated, and 1 was under the care of the State. Thirty-eight (23%) had dropped out of school. Adolescents were considered to have dropped out of school if the following criteria were met: school records indicated that the student was no longer attending, and no records had been forwarded to another school; records had been forwarded but the recipient school had never had that student on record; the student had dropped out of subsequently attended schools, with no records forwarded. The 16 participants who had moved out of state were dropped from the study. Ten independent t-tests on indices central to this investigation revealed these 16 students had scores similar to the remaining students on all but one index.
Analyses involving dropouts and school attenders, therefore, involved 134 of the original sample of 163. Prospective analyses for those who remained in school are based on the group of 96 students with questionnaire data from both freshman and senior years (of the 100 students who remained in schools within the state, 4 refused to participate as seniors). The prospective sample consisted of 59 girls and 37 boys, with roughly the same gender and ethnic distribution as in the original sample.
Measures
Demographic indices
A self-report questionnaire was used to assess age, gender, ethnicity, and family structure at Time 1. Families were considered to be single-parent households if there was not a resident pair of parent figures (e.g., mother and father [including stepparents], aunt and uncle, or grandfather and grandmother). Parental education and occupation were obtained via a separate form completed by parents. This information was used to determine the SES of the youths’ households according to the Hollingshead Two-Factor Index of Social Position (Hollingshead & Redlich, 1958). The Hollingshead Two-Factor Index is a widely accepted measure of SES that has been recommended for use by developmental psychologists (Gottfried, 1985), and is based on parental occupation and education levels, making it relatively easy to obtain.
Intellectual functioning
The total score from sets B through D of the Standard Progressive Matrices (SPM; Raven, Court, & Raven, 1977) was calculated at Time 1. The SPM provides a measure of nonverbal reasoning skills as an indicator of intellectual functioning. Acceptable levels of concurrent and predictive validity have been widely reported (e.g., Powers, Jones, & Barkan, 1986). Evidence that ethnic or cultural group membership is not a factor in performance (Cantwell, 1986; Powers et al., 1986) made this measure particularly suitable for the present investigation. Internal consistency coefficients for the SPM have been demonstrated to be at least .90. In this sample, Cronbach’s alpha was .97.
School-based adjustment
Classroom grades and school absences were both obtained from school records at Times 1 and 2. Marks collected for English, Mathematics, Social Studies, and Science were converted into grades using a grid developed by school officials, making it possible to compare marks across the differing ability levels (“tracks”). Absenteeism scores consisted of the number of official absences reported at the end of the third marking period. There was a sizable range in the number of absences, from 0 to 97 at Time 1 and 0 to 56 at Time 2.
The Adjustment and Problem Behavior domains from the Teacher-Child Rating Scale (T-CRS; Hightower et al., 1986) were used to assess teachers’ perceptions of classroom behavior. English teachers of students in the sample completed the T-CRS at Time 1 and Time 2. The 18-item Adjustment domain combines three scores representing positive classroom behavior: Frustration Tolerance, Assertive Social Skills, and Task Orientation. The 18-item Problem Behavior scale consists of scores representing classroom behavior difficulties: Acting Out, Learning Problems, and Shy-Anxious. To account for differences in raters, raw subscale scores from the T-CRS were standardized preceding further analyses. Acceptable psychometric properties have been reported for the T-CRS (Hightower et al., 1986; Luthar et al., 1993).
Peer perceptions of classroom behaviors were assessed using the Revised Class Play (RCP), which was administered only at Time 1 (Masten, Morison, & Pellegrini, 1985). Among inner-city adolescents, RCP items have been found to fall into four major factors of which two are negative (Aggressive and Sensitive-Isolated) and two are positive (Sociability and Leadership; Luthar & McMahon, 1996). These four factor scores were used in this study. Luthar and McMahon (1996) have reported adequate coefficients of reliability and validity levels for these scores for a sample of inner-city adolescents.
Personal adjustment: psychological distress and drug use
Self-report measures were administered to assess levels of psychological distress. The Children’s Depression Inventory (CDI; Kovacs, 1982), a 27-item self-report scale designed for school-age children and adolescents, was administered to assess dysphoria. Each item consists of a choice between three statements that reflect levels of dysphoria—from none to high—experienced by the individual within the previous two weeks. Acceptable levels of internal consistency (Kovacs, 1985) as well as criterion and concurrent validity (Saylor, Finch, Spirito, & Bennett, 1984) have been reported for the CDI. Cronbach’s alpha coefficients for the current sample were .87 and .81 at Times 1 and 2, respectively.
The total anxiety score from the 37-item self-report Revised Children’s Manifest Anxiety Scale (Reynolds & Richmond, 1985) was used in this study. Items are scored 0 or 1, with high scores indicating high levels of anxiety. Acceptable reliability and validity coefficients have been reported (Reynolds & Richmond, 1985). Cronbach’s alpha coefficient for the current sample was .84 both at Time 1 and Time 2 for the total score.
The internalizing and externalizing behavior scales from the Youth Self-Report Child Behavior Checklist (Achenbach & Edelbrock, 1987) were used to measure major categories of psychological symptoms. The 32 items on the internalizing scale assess fearful, inhibited, and overcontrolled behaviors, whereas the 30-item externalizing scale covers aggressive, antisocial, and undercontrolled behaviors. The scales are positively intercorrelated, and acceptable reliability and validity levels are well-documented (Achenbach & Edelbrock, 1987).
Drug use was measured using the 18-item Problem Severity scale from the Personal Experience Screening Questionnaire (PESQ; Winters, 1991). This self-report scale provides a global index of psychological and behavioral drug involvement. High scores reflect drug dependence or abuse, and low scores indicate no or infrequent social use. Acceptable levels of internal consistency and validity have been reported in demographically mixed school samples (Luthar & Cushing, 1997; Winters, 1991). Data suggest that adolescent self-reports of drug use are typically reliable reflections of use (Winters, Stinchfield, Henly, & Schwartz, 1990), and indicators of reliability and validity with the present sample (e.g., distributions and correlations with related indices) indicated that participants were truthful in their responses.
Procedure
After obtaining the appropriate letters of consent for participation, research team members explained the study to each class at Time 1, and measures were administered in class. At Time 2, researchers typically met with participants in the school library to complete the measures. At both times, instructions and items were read aloud to groups of 10 to 20 students.
RESULTS
In presenting the results, we begin with descriptive statistics, data reduction, and transformation. Following will be results from multiple hierarchical regression equations modeling dropout status, senior-year academic competence, psychological distress, and drug use.
As in our previous investigations, exploratory data analyses revealed a high degree of overlap among the psychological symptom indices, and we explored the formation of a composite score. Principal components analysis revealed one factor that accounted for 70% of the variance, and all variables loaded”.60 on the relevant factor, supporting the creation of a composite score. To form the Psychological Distress composite, raw scores on each of the four separate scales—depression, anxiety, internalizing, and externalizing—were standardized within Time and added together.1
All scores were essentially normally distributed except for drug use, where the distribution was positively skewed (skewness measured 2.72 at Time 1 and 2.05 at Time 2): Nearly half of the sample had scores at or near the lowest possible score. Before analyzing these data further, the PESQ scores were subjected to a log transformation to adjust for this (Tabachnick & Fidell, 1989).2
Ethnic characteristics of the groups at Times 1 and 2 are summarized in Figure 1. Prospective univariate correlations among variables from freshman and senior years are summarized in Table 1. Coefficients in boldface type reflect a high level of within-measure stability across time.3
Figure 1.
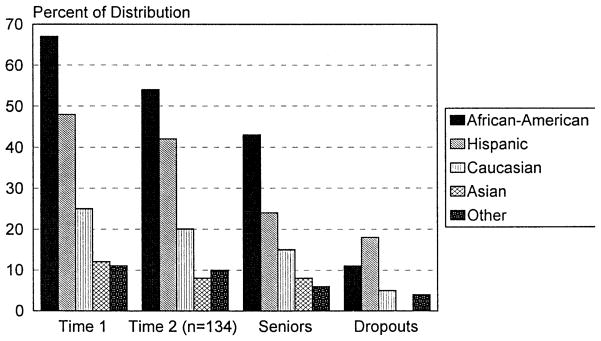
Sample characteristics: ethnicity of Time 1, Time 2, Senior, and Dropout groups.
Table 1.
Prospective Correlations
| Time 1 (Freshman Year) | Time 2 (Senior Year)
|
||||||
|---|---|---|---|---|---|---|---|
| Dropout | Grades | Teacher-Rated Competence | Teacher-Rated Problems | School Absences | Psychological Distress | Drug Use | |
| Demographics | |||||||
| Gendera | .18* | −.19 | −.10 | .22* | −.04 | −.10 | .07 |
| Age | .42*** | −.16 | −.10 | −.03 | .05 | −.27** | −.12 |
| Family structureb | .19* | .05 | .20* | −19 | .11 | −.06 | .03 |
| Puerto Rican ethnicity | .22* | .05 | .03 | −.08 | .19 | −.00 | .31** |
| African American ethnicity | −.15 | −.11 | .01 | .02 | −.20* | −.02 | −.08 |
| Socioeconomic status | .11 | −.01 | .08 | −.11 | .17 | .06 | .07 |
| Intelligence | |||||||
| Intellectual functioning | −.19* | .20* | .14 | −.02 | .07 | −.01 | −.03 |
| Academic indices | |||||||
| Grades | −.51*** | .58*** | .46*** | −.32** | −.21* | .15 | −.16 |
| Teacher-rated competence | −.21* | .35*** | .44*** | −.35*** | −.03 | .08 | −.11 |
| Teacher-rated problems | .37*** | −.30** | −.39*** | .44*** | −.01 | −.13 | .13 |
| Absences | .47*** | −.22* | −.10 | .12 | .44*** | −.05 | .20* |
| Self- and peer-rated Adjustment | |||||||
| Sociability | .05 | −.05 | .14 | −.01 | .04 | −.32** | −.02 |
| Leadership | −.18* | .21* | .24* | −.28** | −.04 | −.20* | −.22* |
| Sensitive-isolated | −.14 | .00 | −.16 | −.03 | −.15 | .03 | −.21* |
| Aggressive | .16 | −.23* | −.04 | .27** | .09 | −.16 | .09 |
| Psychological distress | .06 | .03 | −.04 | −.01 | .09 | .64*** | .19 |
| Drug use | .32*** | −.09 | −.06 | .03 | .20 | .03 | .28** |
Note. Pearson correlation coefficients are reported except for those involving categorical variables (gender, family structure, and ethnicity), where Rho coefficients are reported. Coefficients in boldface type reflect stability of measurement over time. N = 96–134; sample size varies slightly due to missing values.
0 = female, 1 = male.
0 = More than one parental figure in household, 1 = single-parent household.
p < .05;
p < .01;
p < .001.
As we found in our previous investigations with this and another similar cohort of disadvantaged teens (Luthar, 1991; Luthar et al., 1993; Ripple, 1995), univariate correlations showed that SES was not significantly related to any of the outcome indices (see Table 1). Although low SES is strongly predictive of poor academic outcomes across children from a range of socioeconomic backgrounds, it is not linked to outcomes in this group of students because all of these children were from relatively socioeconomically disadvantaged families. Because it did not differentiate between participants, SES was dropped from further analyses.
To ease interpretation of the regression coefficients, African American ethnicity was omitted as a distinct variable. Rather, a single ethnicity variable was created that was coded to represent a comparison between Puerto Rican ethnicity and all other backgrounds (these others were predominantly African American). In addition to aiding in interpretation, this strategy also reflected our particular interest in the adjustment of Puerto Rican students, based on the literature cited earlier. To affirm this data-reduction strategy, we performed all of the analyses reported here both with and without the separately coded African American ethnicity, and they were virtually unchanged from what is presented here.
Multiple hierarchical regression equations were built to model dropout status and senior-year adjustment. The first of these, predicting dropout status, was based on data from the larger sample of 134 study participants, and the remaining equations involved students who remained in school through their senior year (n = 96). All of these equations involved the following groups of independent variables: demographic characteristics (gender, age, family structure, and ethnicity), intelligence, academic adjustment (teacher-rated competence and problems, grades, and absences), and self- and peer-rated adjustment (sociability, leadership, sensitive-isolated, aggressive behavior, psychological distress, and drug use).4 All predictors were measured at Time 1.
In each equation where the outcome variable was also assessed at Time 1, that Time 1 score was entered first in the equation. This approach accounts for the stability of measurement over time before other variables are considered. The order of entry for the remaining independent variables was based on criteria of temporal priority (Cohen & Cohen, 1975; Tabachnick & Fidell, 1989). In other words, background or relatively set characteristics such as gender had priority over variables that reflect transitory states or behaviors such as grades or peer popularity. Among these, demographics were entered first, followed by intelligence. Given our primary interest in academic outcomes and the conceptual salience of history of prior competence, academics were entered next. The four peer-rated indices, freshman Psychological Distress, and freshman Drug Use were entered simultaneously in a block at Step 5. In the interest of minimizing Type I errors, individual beta weights were only examined for significance if the increase in R2 for the block attained significance of p < .10.
Results for the equation predicting dropout status are presented in Table 2. The set of demographic indices was significant (R 2change = .25, p < .001), as was the set of academics (R 2change = .19, p < .001). Within the block of demographic variables, older children were at higher risk for dropout (beta = .39, p < .001). In addition, Puerto Rican ethnicity (beta = .20, p < .01) and single-parent household status (beta = .18, p < .05) contributed significantly to the effect, each in a positive direction. School absences were strongly related to dropout (beta = .31, p < .001), and moderate positive associations were found for teacher-rated competence and problems (beta = .18 and .19, respectively, p < .10). Grades were moderately negatively related (beta = −.21, p < .10).
Table 2.
Multiple Hierarchical Regressions Modeling Dropout Status on Independent Variables Measured in the Freshman Year (N = 134)
| Step | Independent Variable | B | SE B | β | R 2Δ |
|---|---|---|---|---|---|
| 1 | Demographics | .25**** | |||
| Gendera | .07 | .07 | .08 | ||
| Age | .16 | .03 | .39**** | ||
| Ethnicityb | .20 | .08 | .20*** | ||
| Family structurec | .16 | .07 | .18** | ||
| 2 | Intelligence | .01 | |||
| 3 | Academic | .19**** | |||
| Grades | −.03 | .02 | −.21* | ||
| Teacher-rated competence | .03 | .02 | .18* | ||
| Teacher-rated problems | .05 | .03 | .19* | ||
| School absences | .01 | .00 | .31**** | ||
| 4 | Peer- and self-rated adjustment | .01 | |||
| Adjusted R 2 | .37 | ||||
| Multiple R | .66**** | ||||
0 = female, 1 = male.
0 = non-Puerto Rican, 1 = Puerto Rican.
0 = more than one parental figure in household; 1 = single-parent household.
p < .10;
p < .05;
p < .01;
p < .001.
For all equations predicting academic outcomes among children who remained in school, Time 1 adjustment was strongly associated with the outcome (see Table 3). In addition, high freshman grades were predictive of senior year teacher-rated classroom competence (beta = .37, p < .01), and Puerto Rican youth were most likely to miss school (beta = .24, p < .01).
Table 3.
Multiple Hierarchical Regressions Predicting Senior-Year Academic Grades, Teacher-Rated Competence, Teacher-Rated Problems and School Attendance (N = 96)
| Freshman-Year Independent Variable | Senior-Year Outcome
|
|||||||||||||||
|---|---|---|---|---|---|---|---|---|---|---|---|---|---|---|---|---|
| Grades
|
Teacher-Rated Competence
|
Teacher-Rated Problems
|
School Absences
|
|||||||||||||
| B | SE B | β | R 2 Δ (step) | B | SE B | β | R 2 Δ (step) | B | SE B | β | R 2 Δ (step) | B | SE B | β | R 2 Δ (step) | |
| Time 1 adjustmenta | .59 | .08 | .58*** | .34*** | .48 | .10 | .44*** | .19*** | .46 | .10 | .43*** | .18*** | .67 | .12 | .51*** | .26*** |
| Demographics | .02 | .04 | .05 | .06* | ||||||||||||
| Genderb | .72 | 1.37 | .04 | |||||||||||||
| Age | −.52 | .75 | −.06 | |||||||||||||
| Ethnicityc | 4.03 | 1.57 | .24** | |||||||||||||
| Family structured | .77 | 1.34 | .07 | |||||||||||||
| Intelligence | .02 | .00 | .01 | .01 | ||||||||||||
| Academic adjustmente | .02 | .06* | .04 | .02 | ||||||||||||
| Grades | — | — | — | .43 | .17 | .37** | ||||||||||
| Teacher-rated competence | — | — | — | |||||||||||||
| Teacher-rated problems | .11 | .23 | .07 | |||||||||||||
| School absences | .01 | .03 | .07 | — | — | — | ||||||||||
| Peer- and self-rated adjustment | .03 | .04 | .08 | .04 | ||||||||||||
| Adjusted R 2 | .31 | .21 | .27 | .27 | ||||||||||||
| Multiple R | .65*** | .58** | .60*** | .62*** | ||||||||||||
Time 1 adjustment for the dependent variable in each equation.
0 = female, 1 = male.
0 = non-Puerto Rican, 1 = Puerto Rican.
0 = more than one parental figure in household, 1 = single-parent household.
Academic adjustment includes all academic variables, less relevant Time 1 adjustment index (which is entered in first step of each equation).
p < .10;
p < .01;
p < .001.
Table 4 summarizes the final two equations predicting senior-year psychological distress and drug use. Freshman Psychological Distress was very stable across time, so Time 1 adjustment accounted for the majority of the variance in predicting distress (R2change = .46, p < .001). Within the significant block of demographics (R2change = .06, p < .05), beta weights indicated that younger students reported higher levels of distress at Time 2 than did their older peers (beta = −.23, p < .01).
Table 4.
Multiple Hierarchical Regressions Predicting Senior-Year Psychological Distress and Drug Use (N = 96)
| Freshman-Year Independent Variable | Senior-Year Outcome
|
|||||||
|---|---|---|---|---|---|---|---|---|
| Psychological Distress
|
Drug Use
|
|||||||
| B | SE B | β | R 2 Δ (step) | B | SE B | β | R 2 Δ (step) | |
| Time 1 adjustmenta | .73 | .08 | .68**** | .46**** | .40 | .14 | .28*** | .08*** |
| Demographics | .06** | .08* | ||||||
| Genderb | −2.20 | 2.80 | −.06 | .72 | 1.37 | .05 | ||
| Age | −4.72 | 1.51 | −.23*** | −.52 | .75 | −.07 | ||
| Ethnicityc | −1.80 | 3.17 | −.04 | 4.03 | 1.57 | .25*** | ||
| Family structured | −.82 | 2.72 | −.02 | .77 | 1.34 | .06 | ||
| Intelligence | .00 | .00 | ||||||
| Academic adjustment | .01 | .02 | ||||||
| Peer- and self-rated adjustment | .03 | .09* | ||||||
| Sociability | −.30 | .90 | −.05 | |||||
| Leadership | −.93 | .83 | −.05 | |||||
| Sensitive-isolated | −1.46 | .86 | −.20* | |||||
| Aggressive | .41 | .90 | .06 | |||||
| Distress | .08 | .04 | .19* | |||||
| Drug use | — | — | — | |||||
| Adjusted R 2 | .46 | .13 | ||||||
| Multiple R | .74**** | .51** | ||||||
Note. Academic adjustment variables are collapsed in this table because the block did not achieve significance in either equation.
Time 1 adjustment for the dependent variable in each equation.
0 = female, 1 = male.
0 = non-Puerto Rican, 1 = Puerto Rican.
0 = more than one parental figure in household, 1 = single-parent household.
p < .10;
p < .05;
p < .01;
p < .001.
Drug Use was also stable over time (R2change = .08, p < .01). Within the block of demographic variables (R2change = .08, p < .10), results suggested that Puerto Rican students were more likely to use drugs as seniors (beta = .25, p<.01). The block of peer- and self-rated adjustment indices also achieved significance (R2change = .09, p < .10), with peer-rated Sensitive-Isolated behavior associating negatively with drug use (beta = −.20, p < .10).
DISCUSSION
Unlike data that attribute a high level of variability in academic risk to low-income status (McDermott, 1995), these findings provide valuable insights into risk beyond relative poverty. In these analyses, we provide robust evidence for the relative ease of identifying inner-city teens who are at highest risk for poor academic outcomes. The majority of the risk indices used in this investigation of low-SES students can be readily accessed by school administrators and psychologists, in the form of previous academic performance and demographic information. Given the strong predictive power of personal attributes measured in the freshman year demonstrated here, school psychologists need not depend on lengthy referral processes before intervening on behalf of the most at-risk teens. Implications of the findings for each of the domains of dropout, senior-year academic adjustment, and senior-year distress and drug use will be discussed in turn.
Dropout status was clearly linked to demographics and school-based freshman-year predictors. Supporting the results reported elsewhere in the literature (Meisels & Liaw, 1993), age—as a proxy for being overage for grade—was strongly related to dropout. In addition, Puerto Rican children and those from single-parent households faced risk even beyond that associated with being overage for grade. After accounting for the effect of these demographic indices, freshman-year grades, teacher-rated behavior, and school absences were linked to later dropout. Of these, absences were by far the most powerful (the others were marginally significant, and the direction of the effect for teacher-rated competence is surprisingly, if minimally, positive). Clearly, children at highest risk for dropout have been on the dropout trajectory since their entry into high school, and likely long before. The ease of their identification—even on the basis of attendance and overage for grade alone—suggests that they can readily be identified and intervened with long before they get to the point of dropping out.
Similarly, among students who did not drop out, academic performance was remarkably stable from the freshman to senior year. Building upon previous findings of continuity over time in this domain (Simner & Barnes, 1991), these results once again suggest that school personnel need not wait for extensive evaluations or referral processes: The best predictor of future performance is indeed past performance. The stability for grades, teacher-rated classroom behavior, and attendance was so high as to preclude other significant effects, with the exception that Puerto Rican youths were more likely to miss school than others. Efforts to create linkages between schools and these children and their families could increase school administrators’ understanding of the problem and their ability to help the children come to, and stay in, school.
The independent role of intelligence in dropout and academic outcomes was essentially nonexistent. Keeping in mind that previous academic performance was the strongest predictor of later performance, school achievement appears to mediate the role of intelligence in positive school-based outcomes (Lynam et al., 1993; Luthar & Blatt, 1995). Further, our findings suggest that intelligence does not account for differences in performance, refuting the view that ethnic differences in achievement inevitably reflect underlying genetic differences in intelligence (Herrnstein & Murray, 1994).
Interestingly, gender had no predictive power in these analyses. Despite univariate associations indicating that boys were more likely to drop out and have classroom behavior problems, gender ceased to predict any of the outcomes in a multivariate context. As with intelligence, it is possible that other factors dominated effects that might have been accounted for by gender such as previous adjustment or being overage for grade.
Our data on the stability of academic indices also resonate with assertions that for inner-city teens, performance at school represents a choice of investment of effort. Students from minority backgrounds, for example, may experience tension between adopting their cultural identity on the one hand, and investing in school on the other (Ogbu, 1990). For many of these youth, doing well in school may be of little interest (Fordham & Ogbu, 1986; Luthar & Blatt, 1995); however, if their early behaviors reflect the adoption of mainstream beliefs including the value of doing well in school, then they are likely to continue along this path later in life (Luthar, 1999). Thus, the seniors who were doing well were the ones who, by the time they were freshman, had adopted a belief system that largely endorsed and valued school achievement.
Psychological distress was remarkably stable across the high school years. In general, relatively few data exist on the stability of psychological well-being during adolescence (Fauber, Forehand, Long, Burke, & Faust, 1987). Beyond the effect of stability over time, younger students were more likely to report high levels of distress. Precedence for these findings can be found in a study of low-income African American youth (Fitzpatrick, 1993) in which self-reported depressive symptoms were higher among younger versus older youths. Similarly, McLoyd and Wilson (1990) reported that younger adolescents experienced more psychological distress than did older teens, and suggested that younger adolescents may have comparatively less mature coping strategies and fewer psychological resources.
Youths who had been identified by their peers as being sensitive and socially isolated were least likely to report senior-year drug use. Socially isolated students have been shown to be high academic achievers (Luthar & McMahon, 1996; Wentzel & Asher, 1995), and they may be less likely to engage in a “social” pursuit like drug use. Although it has been argued that drug use among inner-city teens is more a function of external factors such as the availability of drugs in the inner-city (National Research Council, 1993) than of internal distress, our data provide some evidence of a long-term prospective link between distress and later drug use. The modest association between freshman-year psychological distress and later drug use serves as one more indication that early distress is worthy of attention to prevent subsequent poor outcomes.
Limitations and Conclusion
Due to the nature of the sample and the measures chosen in this investigation, several caveats are in order. First, these findings are based on a small group of inner-city adolescents from a single northeastern city who began as freshmen in one high school. Therefore, care should be taken in extrapolating these findings to other groups of teens. In addition, the selective nature of the cohort of students who provided senior-year questionnaire data (i.e., the nondropouts) should be kept in mind. Second, to fully study the place that intellectual functioning holds in the picture of academic success or failure, future research might use a more comprehensive measure than the Raven’s Progressive Matrices. Although this measure was used with good reason here, it is strictly limited in its ability to capture the breadth of intellectual functioning. Third, by the nature of the study’s focus on personal characteristic risk factors, we do not include a host of other influences that would make for a more complete model of student achievement and behavior. More comprehensive ecological approaches to adolescent academic adjustment that take into account school, home, and motivational influences (e.g., Hawkins & Weis, 1985; Wang, Haertel, & Walberg, 1993) put the variables we consider here in a broader context.
What are the implications of this work for school psychologists? As noted, and with the exception of the distress and drug-use assessments, we used data that could be relatively easily accessed or collected by school personnel. Developing a risk index for students in the beginning of high school, and even long before, would lend to early identification of particularly vulnerable children within an already at-risk low-income group. Rather than waiting for children to be referred for problems, these data can be used to support a proactive policy to identify and engage in prevention strategies that might change poor pathways to productive ones. Programs such as William Milliken’s Communities in Schools (Resnick & Burt, 1996), the Valued Youth Partnership (which has shown marked success reducing dropout among Hispanic youth; Sosa, 1990), and Robert Felner’s School Transition Environment Project (Felner et al., 1993) use an early identification process based on risk markers to match vulnerable adolescents with services designed to promote school success.
Although schools do not routinely collect data on psychological distress and drug use, these data suggest that it should be considered. The stability of both of these indices over the high school years, and the relationship between early distress and later drug use, suggest that administering a brief screening instrument early in the freshman year could aid significantly in identifying students who are likely to have persistent difficulties in these domains throughout their high-school career.
In summary, these results suggest that school psychologists in inner-city schools can readily access data to help them identify particularly at-risk students early on. The challenge is for professionals to use these data and to intervene with vulnerable students before their academic and personal difficulties become crystallized in the course of their developmental trajectories.
Acknowledgments
This research was supported by a grant from the William Casper Graustein Memorial Fund to Carol Ripple, and by funds from the Social Science Research Council, New York, Research Scientist Development Award K21-DA00202 and P50-DA09241 to Suniya Luthar. Sincere thanks to the students, teachers, and administrators who made this work possible, and to Edward Zigler and Walter Gilliam for their invaluable input.
Footnotes
Although drug use also correlated highly with psychological distress, it was maintained as a separate index in the interest of exploring it as a distinct antecedent and outcome. In particular, the relationship between antecedents such as psychological distress and later drug use over this relatively long period of time is incompletely understood.
Analyses were also conducted on the raw PESQ scores to allow for comparability of results between this study and previously reported 6-month analyses (Luthar & Cushing, 1997). The pattern of results with transformed and raw scores was identical.
Means (and standard deviations) on repeated measures were as follows, for Freshmen and Seniors, respectively: Grades, 6.49 (2.39) and 5.62 (2.35); Teacher-Rated Competence, 30.51 (2.53) and 29.96 (2.78); Teacher-Rated Problems, 19.44 (1.56) and 20.02 (1.81); Absences, 14.49 (11.86) and 8.53 (8.77); Psychological Distress, 51.72 (18.45) and 48.78 (18.55); and Drug Use, 20.06 (4.77) and 23.46 (7.56).
In light of results that suggested the possibility of interaction effects, a series of exploratory regressions including sets of interaction terms involving Time 1 adjustment and demographic variables were performed in addition to these equations. However, none of these sets achieved significance, and they are not reported here.
Contributor Information
Carol H. Ripple, Yale University
Suniya S. Luthar, Columbia Teachers College
References
- Achenbach TM, Edelbrock C. Manual for the Youth Self-Report and Profile. Burlington, VT: University of Vermont Department of Psychiatry; 1987. [Google Scholar]
- Arroyo CG, Zigler E. Racial identity, academic achievement, and the psychological well being of disadvantaged adolescents. Journal of Personality and Social Psychology. 1995;69:903–914. doi: 10.1037//0022-3514.69.5.903. [DOI] [PubMed] [Google Scholar]
- Battle J. Academic achievement among Hispanic students from one- versus dual-parent households. Hispanic Journal of Behavioral Sciences. 1997;19:156–170. [Google Scholar]
- Beauvais F, Chavez E, Oetting E, Deffenbacher J, Cornell G. Drug use, violence, and victimization among White American, Mexican American, and American Indian dropouts, students with academic problems, and students in good academic standing. Journal of Counseling Psychology. 1996;43:292–299. [Google Scholar]
- Blechman EA, McEnroe MJ, Carella ET. Childhood competence and depression. Journal of Abnormal Psychology. 1986;95:223–227. doi: 10.1037//0021-843x.95.3.223. [DOI] [PubMed] [Google Scholar]
- Bryk AS, Thum YM. The effects of high school organization on dropping out: An exploratory investigation. American Educational Research Journal. 1989;26:353–383. [Google Scholar]
- Cairns RB, Cairns BD, Neckerman HJ. Early school dropout: Configurations and determinants. Child Development. 1989;60:1437–1452. doi: 10.1111/j.1467-8624.1989.tb04015.x. [DOI] [PubMed] [Google Scholar]
- Cantwell Z. Assessment of developed general intellectual ability with nonverbal measures. The Journal of Psychology. 1986;120:473–478. [Google Scholar]
- Chapa J, Valencia RR. Latino population growth, demographic characteristics, and education stagnation: An examination of recent trends. Hispanic Journal of Behavioral Sciences. 1993;15:165–187. [Google Scholar]
- Cicchetti D, Toth SL. Developmental psychopathology and disorders of affect. In: Cicchetti D, Cohen DJ, editors. Developmental psychopathology: Risk, disorder, and adaptation. Vol. 2. New York: Wiley; 1995. pp. 369–420. [Google Scholar]
- Cohen J, Cohen P. Applied multiple regression/correlation analysis for the behavioral sciences. Hillsdale, NJ: Erlbaum; 1975. [Google Scholar]
- Connell JP, Spencer MB, Aber JL. Educational risk and resilience in African-American youth: Context, self, action, and outcomes in school. Child Development. 1994;65:493–506. [PubMed] [Google Scholar]
- Eckenrode J, Rowe E, Laird M, Braithwaite J. Mobility as a mediator of the effects of child maltreatment on academic performance. Child Development. 1995;66:1130–1142. [PubMed] [Google Scholar]
- Ensminger ME, Lamkin RP, Jacobson N. School leaving: A longitudinal perspective including neighborhood effects. Child Development. 1996;67:2400–2416. [PubMed] [Google Scholar]
- Fagan F, Pabon E. Contributions of delinquency and substance use to school dropout among inner-city youths. Youth & Society. 1990;21:306–354. [Google Scholar]
- Fantuzzo JW, Rohrbeck CA, Hightower AD. A teacher assessment of self-controlling skills and their relationship to self-control and adjustment ratings. Journal of School Psychology. 1989;27:35–45. [Google Scholar]
- Fauber R, Forehand R, Long N, Burke M, Faust J. The relationship of young adolescent Children’s Depression Inventory (CDI) scores to their social and cognitive functioning. Journal of Psychopathology and Behavioral Assessment. 1987;9:161–172. [Google Scholar]
- Felner R, Brand S, Adan A, Mulhall P, Flowers N, Sartain B, DuBois S. Restructuring the ecology of the school as an approach to prevention during school transitions: Longitudinal follow-ups and extensions of the School Transitional Environment Project (STEP) In: Jason L, Danner K, Kurasaki K, editors. Prevention and school transition: Prevention in human services. Binghamton, NY: Haworth Press; 1993. pp. 102–136. [Google Scholar]
- Fine M. Why urban adolescents drop into and out of public high school. Teachers College Record. 1986;87:89–105. [Google Scholar]
- Fitzpatrick KM. Exposure to violence and presence of depression among low-income, African-American youth. Journal of Consulting & Clinical Psychology. 1993;61:528–531. doi: 10.1037//0022-006x.61.3.528. [DOI] [PubMed] [Google Scholar]
- Ford DY. Black students’ achievement orientation as a function of perceived family achievement orientation and demographic variables. Journal of Negro Education. 1993;62:47–66. [Google Scholar]
- Fordham S, Ogbu JU. Black students’ school success: Coping with the burden of “acting white”. In: Muuss RE, editor. Adolescent behavior and society. New York: McGraw-Hill; 1990. pp. 275–291. [Google Scholar]
- Goldenberg C. Society for Research and Child Development Social Policy Report. 1. X. Ann Arbor, MI: Society for Research in Child Development; 1996. Latin American immigration and U.S. schools. [Google Scholar]
- Gottfried AW. Measures of socioeconomic status in child development research: Data and recommendations. Merrill-Palmer Quarterly. 1985;31:85–92. [Google Scholar]
- Grissom JB, Shepard LA. Repeating and dropping out of school. In: Shepard LA, Smith ML, editors. Flunking grades: Research and policies on retention. New York: Falmer Press; 1989. pp. 34–63. [Google Scholar]
- Hawkins JD, Weis JG. The social development model: An integrated approach to delinquency prevention. Journal of Primary Prevention. 1985;6(2):73–97. doi: 10.1007/BF01325432. [DOI] [PubMed] [Google Scholar]
- Herrnstein RJ, Murray CA. The Bell Curve: Intelligence and class structure in American life. New York: Free Press; 1994. [Google Scholar]
- Hightower AD, Work WC, Cowen EL, Lotyczewski BS, Spinell AP, Guare JC, Rohrbeck CA. The Teacher-Child Rating Scale: A brief objective measure of elementary school children’s school problem behaviors and competencies. School Psychology Review. 1986;15:393–409. [Google Scholar]
- Hollingshead AB, Redlich FC. Social class and mental illness. New York: Wiley; 1958. [DOI] [PMC free article] [PubMed] [Google Scholar]
- Juvonen J, Murdock TB. Grade-level differences in the social value of effort: Implications for self-presentation tactics of early adolescents. Child Development. 1995;66:1694–1705. [PubMed] [Google Scholar]
- Kaplan M, Marks G. Adverse effects of acculturation: Psychological distress among Mexican American young adults. Social Science and Medicine. 1990;31:1313–1319. doi: 10.1016/0277-9536(90)90070-9. [DOI] [PubMed] [Google Scholar]
- Kovacs M. The Children’s Depression Inventory: A self-rated depression scale for school-aged youngsters. University of Pittsburgh; 1982. Unpublished manuscript. [Google Scholar]
- Kovacs M. The Children’s Depression Inventory. Psychopharmacology Bulletin. 1985;21:995–998. [PubMed] [Google Scholar]
- Kupersmidt JB, Coie JD. Preadolescent peer status, aggression, and school adjustment as predictors of externalizing problems in adolescence. Child Development. 1990;61:1350–1362. doi: 10.1111/j.1467-8624.1990.tb02866.x. [DOI] [PubMed] [Google Scholar]
- Luthar SS. Vulnerability and resilience: A study of high-risk adolescents. Child Development. 1991;62:600–616. doi: 10.1111/j.1467-8624.1991.tb01555.x. [DOI] [PMC free article] [PubMed] [Google Scholar]
- Luthar SS. Social competence in the school setting: Prospective cross-domain associations among inner-city teens. Child Development. 1995;66:416–429. doi: 10.1111/j.1467-8624.1995.tb00880.x. [DOI] [PMC free article] [PubMed] [Google Scholar]
- Luthar SS. Children in poverty: Risk and protective forces in adjustment. In: Kazdin AE, editor. Sage Series on Developmental Clinical Psychology and Psychiatry: Vol 41. Thousand Oaks, CA: Sage; 1999. [Google Scholar]
- Luthar SS, Blatt SJ. Differential vulnerability of Dependency and Self-criticism among disadvantaged teenagers. Journal of Research on Adolescence. 1995;5:431–449. [Google Scholar]
- Luthar SS, Cushing G. Substance use and personal adjustment among disadvantaged teenagers: A six-month prospective study. Journal of Youth and Adolescence. 1997;26:353–372. [Google Scholar]
- Luthar SS, Doernberger CH, Zigler E. Resilience is not a unidimensional construct: Insights from a prospective study of inner-city adolescents. Development and Psychopathology. 1993;5:703–717. doi: 10.1017/S0954579400006246. [DOI] [PMC free article] [PubMed] [Google Scholar]
- Luthar SS, McMahon TJ. Peer reputation among inner-city adolescents: Structure and correlates. Journal of Research on Adolescence. 1996;6:581–603. [Google Scholar]
- Luthar SS, Ripple CH. Sensitivity to emotional distress among intelligent adolescents: A short-term prospective study. Development and Psychopathology. 1994;6:343–357. [Google Scholar]
- Luthar SS, Zigler E. Intelligence and social competence among high-risk adolescents. Development and Psychopathology. 1992;4:287–299. doi: 10.1017/S0954579400000158. [DOI] [PMC free article] [PubMed] [Google Scholar]
- Lynam D, Moffitt T, Stouthamer-Loeber M. Explaining the relation between IQ and delinquency: Class, race, test motivation, school failure, or self control? Journal of Abnormal Psychology. 1993;102:187–196. doi: 10.1037//0021-843x.102.2.187. [DOI] [PubMed] [Google Scholar]
- Masten AS, Best KM, Garmezy N. Resilience and development: Contributions from the study of children who overcome adversity. Development & Psychopathology. 1990;2:425–444. [Google Scholar]
- Masten AS, Garmezy N, Tellegen A, Pellegrini DS, Larkin K, Larsen A. Competence and stress in school children: The moderating effects of individual and family qualities. Journal of Child Psychology and Psychiatry. 1988;29:745–764. doi: 10.1111/j.1469-7610.1988.tb00751.x. [DOI] [PubMed] [Google Scholar]
- Masten AS, Morison P, Pellegrini DS. A Revised Class Play method of peer assessment. Developmental Psychology. 1985;21:523–533. [Google Scholar]
- McDermott PA. Sex, race, class, and other demographics as explanations for children’s ability and adjustment: A national appraisal. Journal of School Psychology. 1995;33:75–91. [Google Scholar]
- McLanahan SS. Parent absence or poverty: Which matters more? In: Duncan GJ, Brooks-Gunn J, editors. Consequences of growing up poor. New York: Sage; 1997. pp. 35–48. [Google Scholar]
- McLoyd VC. Socioeconomic disadvantage and child development. American Psychologist. 1998;53:185–204. doi: 10.1037//0003-066x.53.2.185. [DOI] [PubMed] [Google Scholar]
- McLoyd VC, Wilson L. The strain of living poor: Parenting, social support, and child mental health. In: Huston AC, editor. Children in poverty. New York: Cambridge; 1990. pp. 105–135. [Google Scholar]
- McMillen M, Kaufman P. Office of Educational Research and Improvement, NCES 98–250. Washington, DC: U.S. Department of Education; 1997. Dropout rates in the United States: 1996. [Google Scholar]
- Meisels SJ, Liaw F. Failure in grade: Do retained students catch up? Journal of Educational Research. 1993;87(2):69–77. [Google Scholar]
- Milgram NA, Palti G. Psychosocial characteristics of resilient children. Journal of Research in Personality. 1993;27:207–221. [Google Scholar]
- National Research Council. Losing generations: Adolescents in high-risk settings. Washington, DC: National Academy Press; 1993. [Google Scholar]
- Oakland T. School dropouts: Characteristics and prevention. Applied and Preventive Psychology. 1992;1:201–208. [Google Scholar]
- Ogbu JU. Literacy and schooling in subordinate cultures: The case of Black America. In: Lomotey K, editor. Going to school: The African-American experience. Albany: State University of New York Press; 1990. pp. 113–131. [Google Scholar]
- Paulson MJ, Coombs RH, Richardson MA. School performance, academic aspirations, and drug use among children and adolescents. Journal of Drug Education. 1990;20:289–303. doi: 10.2190/8J0X-LY6D-PL7W-42FA. [DOI] [PubMed] [Google Scholar]
- Powers S, Jones PB, Barkan JH. Validity of the Standard Progressive Matrices as a predictor of achievement of sixth and seventh grade students. Educational and Psychological Measurement. 1986;46:719–722. [Google Scholar]
- Raven JC, Court JH, Raven J. Manual for Raven’s Progressive Matrices and Vocabulary Scales. London: H. K. Lewis; 1977. [Google Scholar]
- Resnick G, Burt MR. Youth at risk: Definitions and implications for service delivery. American Journal of Orthopsychiatry. 1996;66(2):172–188. doi: 10.1037/h0080169. [DOI] [PubMed] [Google Scholar]
- Reynolds CR, Richmond BO. Revised Children’s Manifest Anxiety Scale: Manual. Los Angeles: Western Psychological Services; 1985. [Google Scholar]
- Ripple CH. Long-term predictors of academic adjustment and high-school dropout among inner-city adolescents. Yale University; New Haven, CT: 1995. Unpublished doctoral dissertation. [Google Scholar]
- Saylor CR, Finch AJ, Jr, Spirito A, Bennett B. The Children’s Depression Inventory: A systematic evaluation of psychometric properties. Journal of Consulting and Clinical Psychology. 1984;52:955–967. doi: 10.1037//0022-006x.52.6.955. [DOI] [PubMed] [Google Scholar]
- Shedler J, Block J. Adolescent drug use and psychosocial health. American Psychologist. 1990;45:612–630. doi: 10.1037//0003-066x.45.5.612. [DOI] [PubMed] [Google Scholar]
- Simner ML, Barnes MJ. Relationship between first-grade marks and the high school dropout problem. Journal of School Psychology. 1991;26:331–335. [Google Scholar]
- Slotkin J, Forehand R, Fauber R, McCombs A, Long N. Parent-completed and adolescent-completed CDIs: Relationship to adolescent social and cognitive functioning. Journal of Abnormal Child Psychology. 1988;16:207–217. doi: 10.1007/BF00913596. [DOI] [PubMed] [Google Scholar]
- Tabachnick BG, Fidell LS. Using multivariate statistics. New York: Harper Collins; 1989. [Google Scholar]
- Sosa A. Making education work for Mexican-Americans: Promising community (ERIC Document Reproduction Service No ED 319 580) San Antonio, TX: Intercultural Development Research Association; 1990. [Google Scholar]
- Walberg H, Tsai S. Correlates of reading achievement and attitude: A national assessment study. Journal of Educational Research. 1985;78(3):159–167. [Google Scholar]
- Wang MC, Haertel GD, Walberg HJ. Toward a knowledge base for school learning. Review of Educational Research. 1993;63:249–294. [Google Scholar]
- Weitzman M, Siegel DM. What we have not learned from what we know about excessive school absence and school dropout. Developmental and Behavioral Pediatrics. 1992;13:55–58. [PubMed] [Google Scholar]
- Wentzel KR, Asher SR. The academic lives of neglected, rejected, popular, and controversial children. Child Development. 1995;66:754–763. doi: 10.1111/j.1467-8624.1995.tb00903.x. [DOI] [PubMed] [Google Scholar]
- Winters K. Personal Experience Screening Questionnaire Manual. Los Angeles: Western Psychological Services; 1991. [Google Scholar]
- Winters K, Stinchfield R, Henly G, Schwartz R. Validity of adolescent self-report of alcohol and other drug involvement. International Journal of the Addictions. 1990;25:1379–1395. doi: 10.3109/10826089009068469. [DOI] [PubMed] [Google Scholar]